Nomenclature
- AIP
-
Aeronautical Information Publication
- ALP
-
Aircraft Landing Problem
- ASSP
-
Aircraft Sequencing and Scheduling Problem
- ECAC
-
European Civil Aviation Conference
- EUROCONTROL
-
European Organisation for the Safety of Air Navigation
- FCFS
-
First Come First Serve
- GAMS
-
General Algebraic Modeling System
- H
-
heavy
- ICAO
-
International Civil Aviation Organization
- J
-
super
- L
-
light
- M
-
medium
- MILP
-
Mixed Integer Linear Programming
- MTOW
-
Maximum Take-Off Weight
- PM
-
Point Merge
- PMS
-
Point Merge System
- TMA
-
Terminal Manoeuvering Area
1.0 Introduction
The rapid growth of demand for air transportation is dramatically increasing at present and prediction indicators show that it will continue to rise. Even though Covid-19 has had a negative impact on air traffic operations, they are expected to regain 2019 levels by 2026 according to the prediction of the most likely scenario from EUROCONTROL [1]. However, in normal circumstances, EUROCONTROL has predicted in their most likely scenario that the number of passengers from the European Civil Aviation Conference (ECAC) region is predicted to reach 2.05Bn by 2040 [2]. The increase in the number of passengers usually results in the scheduling of more flights or the use of aircraft with higher passenger capacity to meet the increased demand. These changes result in congestion that usually affects TMA (Terminal Manoeuvering Area) operations. For this reason, air traffic management around the TMA becomes vital to significantly reduce the negative effects of growing demand. One focal point for managing traffic around the TMA is the sequencing and scheduling of arrival aircraft. It is important to enhance traffic flow in terms of noise mitigation, capacity/demand balance, time management, fuel consumption, and carbon emission efficiency. This problem is called the Aircraft Sequencing and Scheduling Problem (ASSP) in the existing literature. One of its sub-sections is the Aircraft Landing Problem (ALP) is covered by many researchers in the literature.
ALP has been studied widely in the literature, to read comprehensive literature on mathematical modeling for solving ALP, refer to Refs. [Reference Adler, Liebert and Yazhemsky3–Reference Sama, D’Ariano, D’Ariano and Pacciarelli5]. Beasley et al., defined ALP as deciding a landing time for an aircraft in the TMA. It considers the interactions and separation criteria among aircraft. The authors scheduled aircraft in single runway and multiple runway cases [Reference Beasley, Krishnamoorthy, Sharaiha and Abramson6]. Another study examined the sequencing of landing aircraft at London Heathrow to improve runway utilisation by employing a heuristic approach [Reference Beasley, Sonander and Havelock7]. Chen and Xia, investigated a model to represent ALP optimal scheduling and used a heuristic algorithm in the model. As stated by the researchers, the computational performance of the model is better than the First Come First Serve (FCFS) approach and the model was easy to use by controllers [Reference Chen and Xia8].
There are also some studies that focused on some techniques such as Trombones [Reference Dalmau, Alenka and Prats9–Reference Sáez, Prats, Polishchuk and Polishchuk11] and Point Merge (PM) [Reference Boursier, Favennec, Hoffman, Trzmiel, Vergne and Zeghal12–Reference Cecen19] to increase the efficiency of sequencing landing aircraft in TMAs. Trombone-shape procedure consists of parallel legs and many waypoints that enable controllers to give a shortcut regarding current traffic circumstances while point merge system has sequencing legs that are iso-distanced to a merge point. Controllers also give “direct-to” instruction to the aircraft on the sequencing leg after maintaining safe separation among successive aircraft in PMS. The main aims of these studies can be gathered under the topics of optimising fuel consumption, minimising delay, and reducing the carbon emissions of aircraft.
Along with these studies, there are also some approaches to reduce separation minima in the phase of approach and take-off among successive aircraft. One example of these approaches is the recategorisation of aircraft regarding, not only maximum take-off weight (MTOW), but also some characteristics of the aircraft, such as its shape and performance ability. The ICAO defines the wake turbulence category to determine separation criteria among aircraft on arrival and departure. It is based on the maximum certificated take-off mass of the aircraft [20]. As stated by ICAO, all aircraft types of 136,000kg or more are classed as Heavy (H), types less than 136,000kg but more than 7,000kg are Medium (M) and aircraft of 7,000kg or less are categorised as Light (L). However, the introduction of the A380 by Airbus was a game changer in terms of separation criteria according to the MTOW. Because there is a huge difference among MTOW of Heavy category and A380 (approx. 575 tons), the scale of wake turbulence category needed to be changed to adapt to new weights, shape, and performance parameters. ICAO added a new wake turbulence category, Super (J), and, with this new category, defined new separation minima among successive aircraft on arrival and departure operations. The new separation minima for arrival and departure operations are given in Tables 1 and 2. Table 1 was employed as stated in another study [Reference Liang, Delahaye and Xu21].
ICAO wake turbulence categories and distance-based separation minima on arrival

ICAO wake turbulence categories and time-based separation minima on departure

With these regulations, operations are separated safely, and traffic is flown according to their wake turbulence separation minima. Although these tables are in use to provide safe operation, some studies have been carried out to recategorise aircraft to define new separation minima at an acceptable level. One example of this is addressed in research conducted by Lang et al. [Reference Lang, Tittsworth, Bryant, Wilson, Lepadatu, Delisi, Lai and Greene22]. They exhibited a methodology for recategorisation and gave an example of how this methodology handles capacity increases over the U.S. In recent years, EUROCONTROL has studied the recategorisation of aircraft within the European Wake Turbulence Categorization and Separation Minima on Approach and Departure project, known as RECAT-EU [23]. Some other studies have also been carried out on this topic [Reference Rooseleer, Treve, Visscher and Graham24–Reference Sekine, Kato, Kageyama and Itoh28].
The recategorisation of aircraft under RECAT-EU consists of six static wake turbulence categories. This category scale (between A-F) has been as regarding aircraft wingspan, MTOW, and some other performance metrics. The new categorisation specified in RECAT-EU by EUROCONTROL is given in Tables 3 and 4 [23].
RECAT-EU wake turbulence categories and distance-based separation minima on arrival

RECAT-EU wake turbulence categories and time-based separation minima on departure

For this study, the aim was to form a mathematical model to schedule aircraft with the new RECAT-EU scale and analyse the effect of this separation minima on the PMS at Sabiha Gökcen International Airport (LTFJ), using a mixed integer linear programming (MILP) model to optimally sequence aircraft. To the best of the author’s knowledge, in the existing literature, there has been no study to date that aims to form a mathematical model to optimise sequencing arrival aircraft in the PM technique with RECAT-EU and specifically measure its effect at LTFJ. The comparison between the current ICAO wake turbulence categories and the new RECAT-EU categories was conducted to reveal the performance of the PMS at LTFJ in terms of the flight duration on the sequencing leg and ground delay.
2.0 Point merge system at LTFJ
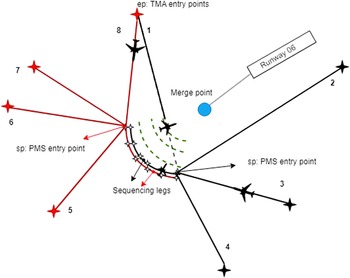
This study examines the route structure of the PMS at LTFJ, which is a single runway airport (06/24 configuration) in Istanbul. Although each direction in the runway configuration has a point merge system, for this study the arrival routes for Runway 06 were considered. The study assumes the route structure of PMS at LTFJ as given in Fig. 1.
A basic representation of the TMA route structure.

There are seven entry points, two sequencing legs separated vertically (1,000ft.), and a merge point for the PMS at LTFJ. Although there are seven points for TMA entry, there are eight routes that link through sequencing legs. All routes are labeled 1–8 above and all are included in the mathematical model using this labeling.
The length of each route was used as defined in Aeronautical Information Publication (AIP) for LTFJ. Conflicts at the beginning of sequencing legs were solved by defining a delay in the model. These legs are structured as sections that form quasi arcs with equal distance from the merge point. The sequencing is carried out by issuing a direct-to instruction to each aircraft on the legs as soon as the necessary separation with the leading aircraft is established. Turning point is a point that aircraft gets direct-to instruction and then it directs to merge point. When the traffic density allows it, the aircraft are given clearance to reach the merge point without using the legs. The distance is defined as the iso-distanced between turning points on the sequencing leg and the merge point. Aircraft speed between the turning point and merging point was constant to protect separation among successive aircraft. In this study, the turning point is applied by controlling time instead of points. It means that the aircraft on the legs can turn at any time when safe separation with leading aircraft was provided. This also gives flexibility in controlling traffic flow on the sequencing legs. But the maximum duration for flying on the legs was limited to avoid deviating from reality.
3.0 Conceptual model and mathematical modelling
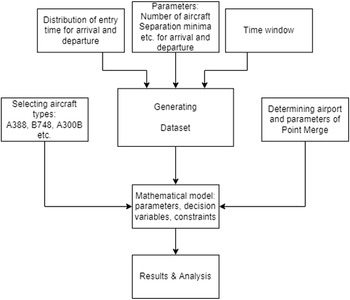
The conceptual model of the study is given in Fig. 2.
Conceptual model.

As shown in Fig. 2, firstly, the distribution of the entry time for each aircraft was determined. After that, the parameters, such number of aircraft, separation criteria, and time window for the traffic flow were established. These were all combined in the process of generating the dataset and scenarios with the selection of aircraft types and airport parameters for the PMS. After the dataset and scenarios were formed, the mathematical model was formed in GAMS (General Algebraic Modeling System) with parameters, decision variables, and constraints. Finally, the results of the model were analysed.
3.1 Mathematical model
The mathematical model was formed to optimise the sequence of arrival aircraft in LTFJ and to analyse the performance of PMS at this airport by making a comparison between the ICAO wake turbulence category and RECAT-EU.

In the model, sep(o1, o2) and sepd(o1, o2) parameters were used to control separation among successive aircraft on arrival and departure, respectively. Both were calculated by utilising Tables 1–4 and reference speed of 200Kn was used to convert distance into time for arrivals. These parameters were used, firstly, to reflect the ICAO wake turbulence category separation minima and then employed to give the RECAT-EU separation minima to the model.
 \begin{align} \mathop \sum \limits_{\rm{i}} (delaypmse{t_i} + tseqle{g_i} + g{d_i})\end{align}
 \begin{align} {x_{i,{\rm{\;}}j}} = 1{\rm{\;}} \end{align}
 \begin{align*} \forall i \in {\rm{I}},{\rm{\;}}\forall {\rm{j}} \in {\rm{J}},{\rm{\;}}j = 1,{\rm{\;\;\;e}}{{\rm{p}}_i} \lt 5,\;{\rm{mod}}{{\rm{e}}_i} = 1\end{align*}
 \begin{align} {x_{i,{\rm{\;}}j}} = 1{\rm{\;}} \end{align}
 \begin{align*} \forall i \in {\rm{I}},{\rm{\;}}\forall j \in {\rm{J}},{\rm{\;}}j = 2,{\rm{\;\;\;e}}{{\rm{p}}_i} \gt 4,\;{\rm{mod}}{{\rm{e}}_i} = 1 \end{align*}
 \begin{align} pmse{t_i} = {\rm{e}}{{\rm{t}}_i} + {\rm{du}}{{\rm{r}}_{k,j}} + delaypmse{t_i} \end{align}
 \begin{align*} \forall i \in {\rm{I}},{\rm{\;\;}}\forall j \in {\rm{J}},{\rm{\;\;}}\forall k \in {\rm{K}},{\rm{\;\;}}k = {\rm{e}}{{\rm{p}}_i},\,j = {\rm{s}}{{\rm{p}}_i},{\rm{\;mod}}{{\rm{e}}_i} = 1 \end{align*}
 \begin{align} pmse{t_{i2}} - pmse{t_{i1}} \geq {\rm{rs}} - {\rm{M\,*}}\left( {1 - y{1_{i1,i2}}} \right){\rm{\;}} \end{align}
 \begin{align*} \forall i1,i2 \in {\rm{I}},{\rm{\;\;}}i1 \ne i2,\,{\rm{s}}{{\rm{p}}_{i1}} = {\rm{s}}{{\rm{p}}_{i2}},{\rm{\;mod}}{{\rm{e}}_{i1}} = 1,{\rm{\;mod}}{{\rm{e}}_{i2}} = 1 \end{align*}
 \begin{align} pmse{t_{i1}} - pmse{t_{i2}} \geq {\rm{rs}} - {\rm{M\,*}}\left( {y{1_{i1,i2}}} \right){\rm{\;}} \end{align}
 \begin{align*} \forall i1,i2 \in {\rm{I}},{\rm{\;\;}}i1 \ne i2,\,{\rm{s}}{{\rm{p}}_{i1}} = {\rm{s}}{{\rm{p}}_{i2}},{\rm{\;mod}}{{\rm{e}}_{i1}} = 1,{\rm{\;mod}}{{\rm{e}}_{i2}} = 1 \end{align*}
 \begin{align} mp{t_i} = pmse{t_i} + {\rm{fd}} + tseqle{g_i} \end{align}
 \begin{align*} \forall i \in {\rm{I}},{\rm{\;mod}}{{\rm{e}}_i} = 1 \end{align*}
 \begin{align} mp{t_{i2}} - mp{t_{i1}} \geq {\rm{se}}{{\rm{p}}_{{\rm{o}}1,{\rm{\;\;o}}2}} - {\rm{M\,*}}\left( {1 - y{2_{i1,i2}}} \right){\rm{\;}} \end{align}
 \begin{align*} \forall i1,i2 \in {\rm{I}},{\rm{\;\;}}\forall {\rm{o}}1,{\rm{o}}2 \in {\rm{O}},{\rm{\;\;}}i1 \ne i2,\,{\rm{o}}1 = {\rm{ca}}{{\rm{t}}_{i1}},\,{\rm{o}}2 = {\rm{ca}}{{\rm{t}}_{i2}} \end{align*}
 \begin{align*} {\rm{mod}}{{\rm{e}}_{i1}} = 1,{\rm{\;mod}}{{\rm{e}}_{i2}} = 1 \end{align*}
 \begin{align} mp{t_{i1}} - mp{t_{i2}} \geq {\rm{se}}{{\rm{p}}_{{\rm{o}}1,{\rm{\;\;o}}2}} - {\rm{M\,*}}\left( {y{2_{i1,i2}}} \right){\rm{\;}} \end{align}
 \begin{align*} \forall i1,i2 \in {\rm{I}},{\rm{\;\;}}\forall {\rm{o}}1,{\rm{o}}2 \in {\rm{O}},{\rm{\;\;}}i1 \ne i2,\,{\rm{o}}1 = {\rm{ca}}{{\rm{t}}_{i2}},\,{\rm{o}}2 = {\rm{ca}}{{\rm{t}}_{i1}} \end{align*}
 \begin{align*} {\rm{\;mod}}{{\rm{e}}_{i1}} = 1,{\rm{\;mod}}{{\rm{e}}_{i2}} = 1 \end{align*}
 \begin{align} ln{d_i} = mp{t_i} + {\rm{fd}}1 \end{align}
 \begin{align*} \forall i \in {\rm{I}},{\rm{\;mod}}{{\rm{e}}_i} = 1 \end{align*}
 \begin{align} deptim{e_i} = {\rm{e}}{{\rm{t}}_i} + g{d_i} \end{align}
 \begin{align*} \forall i \in {\rm{I}},{\rm{\;mod}}{{\rm{e}}_i} = 2 \end{align*}
 \begin{align} deptim{e_{i2}} - ln{d_{i1}} \geq {\rm{ri}} - {\rm{M\,*}}\left( {1 - y{3_{i1,i2}}} \right){\rm{\;}} \end{align}
 \begin{align*} \forall i1,i2 \in {\rm{I}},{\rm{\;\;}}i1 \ne i2,{\rm{\;mod}}{{\rm{e}}_{i1}} = 1,{\rm{\;mod}}{{\rm{e}}_{i2}} = 2 \end{align*}
 \begin{align} ln{d_{i1}} - deptim{e_{i2}} \geq {\rm{ri}} - {\rm{M\,*}}\left( {y{3_{i1,i2}}} \right){\rm{\;}} \end{align}
 \begin{align*} \forall i1,i2 \in {\rm{I}},{\rm{\;\;}}i1 \ne i2,{\rm{\;mod}}{{\rm{e}}_{i1}} = 1,{\rm{\;mod}}{{\rm{e}}_{i2}} = 2 \end{align*}
 \begin{align} dept{i_{i2}} - deptim{e_{i1}} \geq {\rm{sep}}{{\rm{d}}_{{\rm{o}}1,{\rm{o}}2}} - {\rm{M\,*}}\left( {1 - y{4_{i1,i2}}} \right){\rm{\;}} \end{align}
 \begin{align*} \forall i1,i2 \in {\rm{I}},{\rm{\;\;}}\forall {\rm{o}}1,{\rm{o}}2 \in {\rm{O}},{\rm{\;\;}}i1 \ne i2,\,{\rm{o}}1 = {\rm{ca}}{{\rm{t}}_{i1}},\,{\rm{o}}2 = {\rm{ca}}{{\rm{t}}_{i2}}, \end{align*}
 \begin{align*} {\rm{\;mod}}{{\rm{e}}_{i1}} = 2,{\rm{\;mod}}{{\rm{e}}_{i2}} = 2 \end{align*}
 \begin{align} deptim{e_{i1}} - deptim{e_{i2}} \geq {\rm{sep}}{{\rm{d}}_{{\rm{o}}1,{\rm{o}}2}} - {\rm{M\,*}}\left( {y{4_{i1,i2}}} \right){\rm{\;}} \end{align}
 \begin{align*} \forall i1,i2 \in {\rm{I}},{\rm{\;\;}}\forall {\rm{o}}1,&{\rm{o}}2 \in {\rm{O}},{\rm{\;\;}}i1 \ne i2,\,{\rm{o}}1 = {\rm{ca}}{{\rm{t}}_{i2}},\,{\rm{o}}2 = {\rm{ca}}{{\rm{t}}_{i1}},\\[5pt] & {\rm{mod}}{{\rm{e}}_{i1}} = 2,\;{\rm{mod}}{{\rm{e}}_{i2}} = 2 \end{align*}
 \begin{align} delayp{t_i} \le 300 \end{align}
 \begin{align*} \forall i \in {\rm{I\;}} \end{align*}
 \begin{align} se{g_i} \le 450 \end{align}
 \begin{align*} \forall i \in {\rm{I}} \end{align*}
 \begin{align} g{d_i} \le 600 \end{align}
 \begin{align*} \forall i \in {\rm{I}} \end{align*}
 \begin{align} {x_{i,{\rm{\;}}j}},{\rm{\;\;\;}}y{1_{i1,i2}},{\rm{\;\;\;}}&y{2_{i1,i2}},{\rm{\;\;\;}}y{3_{i1,i2}},{\rm{\;\;\;}}y{4_{i1,i2}} \in \left\{ {0,{\rm{\;}}1} \right\} \\[5pt] &{\rm{all\;other\;variables}} \geq 0 \nonumber \end{align}
Equation (1) represents the objective function of the model. It aims to minimise the sum of delays at the PMS entry, flight duration on the sequencing leg, and ground delays. Equations (2) and (3) assign aircraft to the appropriate sequencing leg entry according to the AIP. Equation (4) calculates the PMS entry time of each aircraft and has the
 $delaypmse{t_i}$
variable to make sure aircraft are not holding for a preceding sequencing leg for more than the maximum value of this variable if any aircraft cannot get into a sequencing leg instantly. Equations (5) and (6) control separation between successive aircraft at the entry of the sequencing leg. Equation (7) calculates time at the merge point for each aircraft this also has the
 $tseqle{g_i}$
variable to make sure aircraft are not flying on the sequencing leg for more than the maximum value of this variable if any aircraft cannot get the direct-to instruction instantly. Equations (8) and (9) control the separation at the merge point between leading and trailing aircraft regarding the wake turbulence separation minima. Equation (10) calculates the landing time of each aircraft on the runway. Equation (11) calculates the departure time of each aircraft and has the
 $g{d_i}$
variable to make sure aircraft are not waiting in the departure queue for more than the maximum value of this variable if any aircraft cannot depart instantly. Equations (12) and (13) ensure the safe separation between arrival and departure aircraft on the runway. Equations (14) and (15) control the wake vortex separation between successive aircraft on departure. Equations (16), (17), and (18) limit the maximum value of the delay mechanism. Equation (19) represents the sign constraints for each variable in the model.
4.0 Scenarios and results
There are two main scenarios in the study. The first scenario uses the ICAO wake turbulence category separation minima and the second employs the RECAT-EU minima to reveal the performance of the PMS at LTFJ.
For each scenario, ten test problems were used to analyse the mathematical model with different frequencies of aircraft categories. Entry times of aircraft were distributed exponentially, and the model was tested with 30 aircraft (14 arrival and 16 departure) in a one-hour time window. Six different aircraft categories were used in the RECAT-based scenario while four different categories were used in the ICAO-based scenario. In each scenario, the wake turbulence categories were varied to test the model with various categories with different frequencies. The percentage distributions of the categories in the scenarios are given in Figs. 3 and 4.
Percentage distribution of RECAT-EU wake turbulence categories.

Percentage distribution of ICAO wake turbulence categories.

Figure 3 shows the percentage distribution of RECAT-EU category for each scenario. A388, B748, A30B, A320, E170 and BE20 were selected as aircraft types in the model. Figure 4 shows the percentage distribution of the ICAO wake turbulence category for each scenario. A388, A30B, E170 and BE20 were selected for the scenarios. After selecting RECAT-EU categories, they were converted into the ICAO wake turbulence category by using the convert schema in Table 5. This conversion was required to use the same aircraft types in the scenarios.
Category conversion between RECAT-EU and ICAO wake turbulence categories

The frequency of aircraft categories was varied in each test problem to reveal the impact of the RECAT-EU and ICAO based separation minima on PMS. Additionally, the same types of aircraft were selected for both scenarios in each test problem by paying attention to the categories, resulting in a more homogeneous comparison.
5.0 Results
This section compares the use of RECAT-EU and ICAO wake turbulence categories to demonstrate the performance of the PMS at LTFJ in terms of arrival and departure delays. The MILP model was implemented in GAMS. Ten test problems with different traffic mixes were generated and used to test the model. The scenarios had 30 aircraft for a 60 minutes and exponential distribution was employed to represent a realistic traffic environment. Ground delay was also restricted to 10 minutes [29].
The main goal of this study was to analys e the effect of RECAT-EU on the PMS at LTFJ and compare it with the ICAO category. Hence, the objective function in the model was formed accordingly. Three indicators were used to demonstrate the performance of the PMS under the RECAT-EU and ICAO condition: delay before PMS entry, flight duration at level flight on the sequencing leg, and ground delay in the departure queue. Table 6 shows the results of the model.
Delays of RECAT-EU and ICAO wake turbulence category of the PMS at LTFJ

There is no sector delay in any scenario. The total flight duration on the sequencing leg is less in each scenario with the RECAT-EU categories than with the ICAO wake turbulence category. It is a noteworthy result since level flight at a lower altitude is not very effective in terms of noise and emissions. While the outputs are very promising in terms of total flight duration on the sequencing leg, it is not so consistent for the total ground delay. In some scenarios, the total ground delay of RECAT-EU is more than the ICAO wake turbulence. Although this brings some negative consequences for the airport, it may be handled by sophisticated departure management. The comparison between RECAT-EU and ICAO wake turbulence categories in terms of these indicators is given in Table 7.
Comparison between RECAT-EU and ICAO wake turbulence category for the PMS performance at LTFJ

No sign means that RECAT-EU performs better than the ICAO category in Table 7, a negative sign shows that ICAO is more efficient. RECAT-EU is better than the ICAO wake turbulence category for the LTFJ PMS in terms of total flight duration on the sequencing leg. The highest percentage improvement occurred in Scenario 2 at 68%. This means that the RECAT-EU category has 68% less level flight duration on the sequencing leg than the ICAO category. Furthermore, it has 19.12% less total ground delay in Scenario 2. However, when checking Scenario 10, there is no advantage in using RECAT-EU, but there is a strong disadvantage in using it in terms of ground delay. It increased the total ground delay and the level of this increment cannot be underestimated. Figures 5 and 6, show the differences between these two categories clearly.
Comparison between the RECAT-EU and ICAO categories in terms of flight duration on the sequencing leg.

Comparison between the RECAT-EU and ICAO categories in terms of ground delay.

5.1 Statistical analysis
There are many methods to compare the means of two variables and there are two main categories to determine the further process and apply a statistical method. These are hypothesis testing of parametric and non-parametric, and it is possible to apply non-parametric when the preconditions of parametric tests are not satisfied.
Since there are paired groups, such as before RECAT-EU and after RECAT-EU, it is possible to apply paired samples t-test. This test has some preconditions, such as independency, a test of normality and outliers. As the difference between the two variables is not normally distributed, the non-parametric Wilcoxon test was applied instead of the parametric paired samples t-test.
IBM SPSS Statistics 22 was used to obtain descriptive statistics and analyse the variables to statistically compare their means. All results were combined to compare their means in all scenarios. Therefore, the statistical analysis was completed with 300 observations (30 aircraft with 10 different scenarios). Table 8 shows the descriptive statistics of flight duration on the sequencing leg and the ground delay in the departure queue variables using RECAT-EU and ICAO categories.
Descriptive statistics

While the mean flight duration on the sequencing leg is 9.73 sec. with the ICAO wake turbulence category, it is 6.5 sec. with RECAT-EU. The maximum value in the ICAO category is 95 sec. and 85 for the RECAT-EU category. Table 9 shows the rank of this test.
Ranks of the test

a RECAT_EU_cat < ICAO_cat
b RECAT_EU_cat > ICAO_cat
c RECAT_EU_cat = ICAO_cat
Table 9 shows that there are 25 aircraft that have less duration on the sequencing leg after applying RECAT-EU category in the LTFJ PMS and this value is 20 aircraft for the ground delay in the departure queue. There are 3 aircraft that have more duration on the sequencing leg after applying it and this value is 17 aircraft for the other variable in the table. Furthermore, there are 112 and 123 aircraft that have the same duration on the sequencing leg and in the departure queue before applying the RECAT-EU category, respectively. Test statistics are given in Table 10.
Test statistics

The significance value was selected as 0.05 to compare the p-value of the test. When (p-value < 0.05), it means that there is a significant statistical difference between the scores of the two groups, otherwise, it means that there is no significant statistical difference between the scores [Reference Büyüköztürk30]. After this brief notification, the Wilcoxon test demonstrated significant statistical differences between the scores of the two groups: total flight duration on the sequencing leg before applying RECAT-EU (applying ICAO cat.) and its scores after applying RECAT-EU (p = 0.001<0.05). Since there are only two groups, the direction of its effect can be seen from the Mean Column of Table 8. It can be said that the impact of applying RECAT-EU has a positive effect on reducing flight duration on the sequencing leg. However, there is no significant statistical difference between the scores of the two groups for ground delay in the departure queue (p = 0.791>0.05).
6.0 Conclusion
This study presents a comparison between scenarios using RECAT-EU and ICAO wake turbulence categories to demonstrate the performance of the PMS at Sabiha Gökçen International Airport (LTFJ) in terms of arrival and departure delays. Ten different test problems were created and used with the RECAT-EU category and ICAO category scenarios separately. These problems were modeled with the MILP technique in GAMS/CPLEX solver to minimise arrival and departure delays. The results demonstrated that using RECAT-EU is better than using the ICAO category in terms of total flight duration on the sequencing leg in each scenario and its highest improvement rate was in Scenario 2 at 68%. However, there is not a consistent outcome when the results are compared in terms of total ground delay. Even if RECAT-EU was better in some scenarios, such as Scenario 1, 2 and 3, there is a significant negative effect when Scenario 10 was checked. The ICAO category was better than RECAT-EU by 106.58 in this scenario. This is a considerable gap, but this may be managed by strong departure management to ease the departure queue.
After analysing the model’s results, statistical analysis was carried out to compare the means of the variables. IBM SPSS Statistics 22 was used to make an appropriate hypothesis test. Because the groups did not have normal distribution, the non-parametric Wilcoxon test was used to compare the means of the two related samples. A significant statistical difference (p = 0.001<0.05) was found for flight duration on the sequencing leg, but no significant statistical difference (p = 0.791>0.05) was seen for ground delay in the departure queue when conducted before and after applying the RECAT-EU category comparison. Although the difference in the average total flight duration on the sequencing legs obtained from the RECAT-EU and ICAO scenarios is small, when the scenarios are analysed individually, as shown in Scenario 2 (Fig. 5), the difference in the total flight duration on sequencing legs reaches 100 sec.
To expand this work, it is planned to model whole route structures for the extended TMA with real historical data, focus on airport operations, and include objective functions, such as covering fuel consumption and carbon emission in future research.