
I. INTRODUCTION
The physical dimension of metal oxide field effect transistors (MOSFETs) which are essential components of semiconductor integrated circuits (ICs) have been subjected to continuous downscaling since the birth of ICs to improve the device performance and reduce the production cost per bit. This shrinking of the semiconductor device dimension follows an empirical trend popularly known as Moore’s law, which describes that the number of transistors per IC, or in other words processing capacity and speed doubles, every two years. Reference Moore1 Moore’s prediction was found true for a long while thanks to the rapid advancement of semiconductor device processing technologies such as lithography, selective etching processes etc. On the other hand from the materials aspect, the key material property that enabled the existence of Si-MOSFET devices is the excellent insulating characteristic of SiO2 thin layers which is used as the gate dielectric to isolate the transistor gate from the Si channel. This is possible due to the large band gap of SiO2 (E g ∼9 eV), and the low density of interface traps with Si. For example, in advanced integrated devices SiO2 gate dielectrics with charge densities of 1010 cm−2, midgap interface state densities of 1010 cm−2, and dielectric strength of 15 kV/cm have been produced. Reference Green, Gusev, Degraeve and Garfunkel2,Reference Pahionni3 Further, high quality layer of SiO2 can be grown by simple thermal oxidation that remains amorphous at typical CMOS process condition which is less prone to any structural defects. However, it was evident that continuing the device scaling as per Moore’s law cannot be pushed longer if SiO2 has to be used further as the gate dielectric. The primary disadvantage of using SiO2 as the gate dielectric is its relatively low dielectric constant (k ∼3.9). This imposes significant reduction in the thickness of the SiO2 layer as a consequence of downscaling the MOSFET devices to achieve higher gate capacitance necessary to produce the required drive current in submicron MOSFETs. For example, the specific gate capacitance used for todays CMOS technology nodes demands SiO2 thickness <1 nm. Unfortunately, such ultrathin layers of SiO2 cannot act really as an insulator, as direct tunneling through the dielectric barrier dominates the conduction behavior and the leakage current increases exponentially with decreasing gate dielectric layer thickness. Reference Osten, Czernohorsky, Dargis, Laha, Kuehne, Bugiel and Fissel4 For example, scaling of the gate oxide below 1 nm leads to leakage current density of ∼10 A/cm2 at 1 V which is beyond the acceptable limit for low power device applications. It has also been demonstrated that fabricating CMOS devices with SiO2 layer thickness in the range of 1.0–1.2 nm does not lead to any further gain in the drive current setting a fundamental limit for gate oxide scaling. Reference Timp, Bude, Bourdelle, Garno, Ghetti, Gossmann, Green, Forsyth, Kim, Kleiman, Klemens, Kornblit, Lochstampfor, Mansfield, Moccio, Sorsch, Tennant, Timp and Tung5 Moreover, in contrast to high performance microprocessors, the leakage current densities of transistors in case of low power consumption devices should be well below 10−1 A/cm2, 6 making the gate oxide thickness issue more stringent. There have been additional limiting factors to SiO2 scaling, such as boron diffusion from traditional highly doped poly-Si to lightly doped channel layer Reference Ma, Chen, Liu, Crick, Cheng, Hu and Ko7 that results in shift in the transistor threshold voltage and degraded device reliability owing to hot electron injection at the Si–SiO2 interface causing dielectric breakdown of the gate oxide. Reference Cao, Voorde, Cox and Greene8 These issues related to material limited device scaling is most prominent in case of MOSFETs than in any other device components and became the showstopper in the historical progress of multibillion semiconductor industry. Reference Green, Gusev, Degraeve and Garfunkel2 In this context, one of the major challenge associated with further scaling of integrated devices was to find suitable replacement gate insulator material that possesses higher dielectric constant than SiO2 and therefore can be grown with larger thickness which shall allow sufficient FET current drive while maintaining lower leakage current. Reference Robertson9
II. CHOICE OF ALTERNATIVE GATE INSULATOR
SiO2 is the key material that laid the foundation of Si based microelectronics technology and led it to flourish despite the average performance of Si compared to other semiconductors, such as Ge, GaAs, GaN, SiC, etc. which do not form a thermally stable native oxide. Integrating an alternative dielectric to Si would be possible only at the expense of the advantages of SiO2, which makes the choice of alternative gate dielectric a critical issue. The semiconductor industry first found interim solution remaining within the Si-SiO2 materials framework by selecting silicon oxynitride and oxide/nitride stacks as alternative gate dielectrics which offer slightly higher k value compared to SiO2 and thus lead to reduced leakage, boron penetration, and reliability issues by using relatively larger gate dielectric layer thickness. Reference Gusev, Lu, Garfunkel, Gustafsson and Green10 However, this was only a temporary solution as incorporation of increasing amount of N gives rise to side effects, such as severe degradation of electron mobility in the transistor channel and reduced band gap of the oxide. Reference Cao, Voorde, Cox and Greene8 Therefore, the search of really alternative dielectric materials with much higher dielectric constant was on the agenda to keep pace with the historical steep progress of Si technology. The first parameter to be considered for selecting an alternative material is the appropriate value of the dielectric constant that can be useful for transistor application. While leakage current through the dielectric layer in the direct tunnel regime depends exponentially on its thickness, the capacitance varies linearly. Consequently, dielectrics with too high dielectric constant lead to short channel performance degradation, owing to the fringing field from the gate to source/drain region due to large thickness to length aspect ratio of the gate dielectric. Reference Plummer and Griffin11 Optimum k values within the range of 15 and 50 are predicted to be ideal for continuing scaling of transistors in the future, which shall be applicable for both low standby power and high performance devices. Reference Robertson9 Besides suitable higher k value, any material selected as alternative to substitute SiO2 as gate dielectric will also have to satisfy several other criteria to be eligible for gate dielectric application, such as thermodynamic stability in direct contact with Si, thermal stability even at typical CMOS process temperatures of up to 1000 °C, large band gap, low bulk defect density, low interfacial trap densities, CMOS process compatibility and reliability. Reference Green, Gusev, Degraeve and Garfunkel2
A wide variety of insulating metal oxides with much higher k values has been investigated in the past decade as viable alternative to Si-oxynitride and oxide/nitride systems. Many of these metal oxide alternative dielectrics appear to satisfy some of these requirements, but unfortunately only a very few materials are promising with respect to all of the guidelines. Furthermore, the process complexity associated with deposition of the high-k metal oxides in contrast to simple thermal deposition of SiO2 and oxynitrides pose additional challenges for integrating the alternative dielectrics into mainstream Si technology, such as cost of the deposition tools for large scale production with proper stoichiometry and satisfactory microstructure control, in addition to the requirement of using metal gates, etching and related aspects. Reference Wilk, Wallace and Anthony12
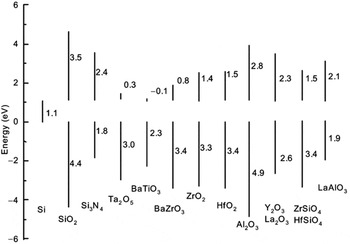
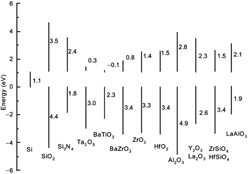
Different binary metal oxides have been considered promising because of the relative ease in controlling the stoichiometry in their thin films. But a number of these oxides are not stable in contact with Si at T > 1000 K and gives rise to an interfacial layer formation. Reference Hubbard and Schlom13 Interfacial layer exhibiting lower k value eventually leads to degradation of the effective dielectric constant and limits the scalability of the device. Another critical parameter to consider is the band gap of the metal oxides, which is mostly much smaller than that of SiO2 (∼9 eV), that directly influences their conduction band and valence band offset (VBO) energies with respect to Si. This is related to the ionic character of the metal oxides in contrast to covalent SiO2. A number of representative dielectric oxides have been found to obey an approximate inverse relation between their static dielectric constant and band gap. This behavior is expected because stronger polarizability implies weaker bonding which leads to smaller separation in bonding and antibonding energies. Reference Cho14 The band offsets, which determine the electron and hole injection barriers respectively at the oxide/Si interface, should be at least 1 eV (for both conduction and valence bands) to prevent charge carrier injection from Si into the bands of the chosen oxide. Reference Robertson15 Figure 1 illustrates the calculated band offsets of several promising high-k dielectric oxides with respect to Si. It is clearly evident that only a few of the high k oxides are suitable candidates for gate dielectric application, despite superior dielectric constant values of several other oxides.
Calculated conduction band and valence band offsets of various oxides on Si. (Reprinted with permission from Ref. Reference Robertson15. Copyright [2000], American Vacuum Society).

An additional roadblock for integrating high-k metal oxides into Si technology is their lower crystallization temperatures. Following the trend with SiO2, the replacement gate dielectric is expected to involve amorphous metal oxides to avoid surface roughness and additional leakage due to the formation of grain boundaries as expected in crystalline material. The higher atomic coordination numbers and ionic character of the metal oxides render them poor glass formers. Reference Lucovsky16 Further, with increasing dielectric constant the crystallization temperature of the oxides also reduces due to increased ionicity, and even the recently preferred binary oxides (e.g., HfO2, ZrO2) do not withstand crystallization at typical CMOS processing temperatures. Alloying with Si or Al (i.e., silicates or aluminates) results in superior thermal stability and higher crystallization temperature, Reference Wilk, Wallace and Anthony12,Reference Wilk and Wallace17–Reference Rittersma, Naburgh, Dao, Hendriks, Besling, Tois, Vainonen-Ahlgren, Tuominen and Haukka19 however, again at the expense of the highest achievable dielectric constant.
Based on the dielectric performance and process condition optimization, the first generation of high-k dielectrics was expected to consist of Hf-based alloys. Interface engineering schemes have been developed to form oxynitride and oxide/nitride reaction barriers between these high-k oxides and Si to minimize the reaction at the interface. Reference Kirsch, Kang, Lozano, Lee and Ekerdt20 The amorphous barrier layers used for Si surface passivation was not only promising for minimizing interfacial reaction but to maintain also high channel carrier mobility, which could otherwise be affected by the interfacial defects and the soft phonons of the high-k oxides in direct contact with Si. In 2007 Intel successfully demonstrated for the first time a 45 nm logic technology using Hf based high-k metal gate stack transistors in a high volume manufacturing process, where an equivalent oxide thickness (EOT) of ∼1 nm was realized. Reference Mistry, Allen, Auth, Beattie, Bergstrom, Bost, Brazier, Buehler, Cappellani, Chau, Choi, Ding, Fischer, Ghani, Grover, Han, Hanken, Hattendorf, He, Hicks, Huessner, Ingerly, Jain, James, Jong, Joshi, Kenyon, Kuhn, Lee, Liu, Maiz, McIntyre, Moon, Neirynck, Pae, Parker, Parsons, Prasad, Pipes, Prince, Ranade, Reynolds, Sandford, Shifren, Sebastian, Seiple, Simon, Sivakumar, Smith, Thomas, Troeger, Vandervoorn, Williams and Zawadzki21 This has gained wide adoption in the industry. 6 While the integration of Hf based gate dielectric to the CMOS device process represented a remarkable success, it is obvious that the lowest possible EOT achievable using alternative dielectric material cannot be realized in presence of the interfacial layer due to their lower k values.
Therefore, clearly further downscaling of CMOS devices must involve usage of high-k oxide materials which should be integrated to Si without any interfacial layer to realize EOT <0.8 nm. Therefore, it is certainly not exaggeration to state that the quality of the interface between the high-k oxide and Si will be the most important parameter to impact the device performance. A good interface quality can be expected either if the oxide is amorphous so that the number of Si dangling bonds at the interface can be minimized by local bonding adjustment, or if it is lattice matched to Si and grown epitaxial with atomically sharp interface. Epitaxial grown high-k oxides could be a smart choice in this regard since this approach has the advantage of defined interface engineering and hence offers more control over the device properties despite larger process complexity related to the epitaxial growth process.
III. EPITAXIAL GATE INSULATORS: CHOICE OF ALTERNATIVE METAL OXIDES
In the recent past various epitaxial complex oxides, especially insulating binary rare earth oxides (REOs, mainly lanthanide oxides, LnOs), have drawn significant interest as prospective 2nd generation of alternative gate dielectrics. Reference Osten, Laha, Czernohorsky, Bugiel, Dargis and Fissel22 Insulating LnOs form a very interesting group of materials for integration on Si Reference Osten, Czernohorsky, Dargis, Laha, Kuehne, Bugiel and Fissel4 as they offer several advantages, such as large dielectric constant, large band gap and band offsets to Si, superior thermal and thermodynamic stabilities, which make them suitable for Si-based technologies. Reference Hubbard and Schlom13,Reference Osten, Laha, Czernohorsky, Bugiel, Dargis and Fissel22 However, the choice of appropriate LnOs for gate dielectric application depends strongly on their stoichiometry. For example, some rare-earth metals exhibit multiple oxidation states (+2, +3, and +4) which lead to oxides with different stoichiometry (LnO, Ln2O3, LnO2), Reference Samsonov23 where not all the compositions are insulating. Moreover, the position of the charge neutrality level of ionic oxides depends strongly on their stoichiometry. Reference Robertson and Xiong24 Therefore, their band alignment to silicon and, finally, the leakage behavior becomes strongly dependent on the oxygen content. Therefore, LnOs which exhibit more than one stoichiometry (e.g., Ce-, Eu-oxides) or those which exhibits stable mixed valence structure (e.g., Pr6O11) are also not the best choices as alternative high-k materials in Si-based devices. Consequently, for practical application it is wise to focus on those insulating LnOs in which the Ln metal possesses only a single valence state. Based on these criteria we focused mainly on LnOs containing Ln3+ cations (exhibiting the composition Ln2O3).
Additionally, Ln2O3 oxides can occur in different crystal structural phases (polymorphs) depending on temperature, e.g., cubic bixbyite structure (Mn2O3 type), hexagonal lanthanum oxide structure (La2O3 type), and monoclinic structure (Sm2O3 type). The different structures exhibit different dielectric properties. Since temperature-dependent crystal phase transitions are not reversible or not completely reversible, and accompanied by interfacial layer formation on Si, the controlled tuning of dielectric properties is difficult for Ln2O3s which can undergo structural phase transformation already within a temperature range typical for CMOS processing Reference Foëx and Traverse25 which make them not suited for gate dielectric applications.
Based on these criteria we focus mainly on Gd2O3 (and to some extent on Nd2O3) for its epitaxial integration on Si as 2nd generation alternative high-k dielectric material. Bulk Gd2O3 occurs in the bixbyite cubic type of structure with single stoichiometry and structural transformation occurs only at T > 1400 K. Reference Nohira, Tsai, Besling, Young, Petry, Conard, Vandervorst, De Gendt, Heyns, Maes and Tuominen26 In addition, this oxide has a large band gap of about 6 eV and nearly symmetrical band offsets to Si, Reference Badylevich, Shamuilia, Afanas’ev, Stesmans, Laha, Osten and Fissel27 a dielectric constant of 14 as well as a low lattice mismatch (∼0.5%) with Si. The bixbyite structure of Gd2O3 has lattice symmetry suitable for epitaxial growth on Si(100) and Si(111). Although the lattice mismatch between Gd2O3 and Si are identical for (100)//(100), (110)//(110), and (111)//(111) epitaxial arrangements based on the symmetry matching, it is to be noted that in practice Gd2O3 grows with (111) orientation on Si(111), whereas (110) oriented growth of Gd2O3 is observed on Si(100) surface under usual epitaxial growth conditions. A detailed discussion of the impact of symmetry matching and surface energy criteria on the epitaxial relation for Gd2O3 growth on Si(100) can be found elsewhere. Reference Osten, Laha, Czernohorsky, Bugiel, Dargis and Fissel22,Reference Roy Chaudhuri, Fissel and Osten28
A. Epitaxial growth
The epitaxial layers of Gd2O3 on different Si surfaces were grown by evaporating commercially available stoichiometric granular Gd2O3 using electron gun in a cluster solid source cluster molecular beam epitaxy system that includes a growth, an annealing, and an analytic chamber connected by an ultra-high vacuum (UHV) transfer system. The layers were grown on silicon substrates with different orientations. Substrates were cleaned ex situ using the last step diluted HF etch followed by a dilution rinse, and then were immediately inserted into the vacuum system. Growth temperatures were in the range of 800–1000 K. Typical growth rates were 0.005–0.01 nm/s. For some growth experiments, additional molecular oxygen was inserted in the chamber without any activation to yield an oxygen partial pressure
 $\left( {{P_{{{\rm{O}}_{\rm{2}}}}}} \right)$
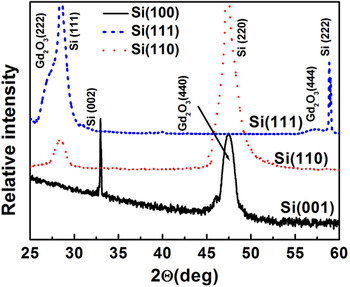
in the range of 10−7 mbar. For the fabrication of metal electrodes, the wafers were transferred immediately after the growth in vacuo into another chamber, where metal dots were evaporated through a shadow mask using electron beam heating. The surface and layer structure was evaluated during the growth by reflection high-energy electron diffraction (RHEED). The chemical natures of the oxides and the band alignment with Si have been investigated using in situ X-ray photoelectron spectroscopy (XPS) in a separate chamber without exposing the layers to atmosphere. Ex situ, the layers were characterized by X-ray diffraction (XRD) (θ/2θ, ω and Φ-scans), by X-ray reflectivity for layer thickness determination (XRR) and by transmission electron microscopy (TEM). Figure 2 shows the X-ray (θ–2θ scan) diffraction patterns of Gd2O3 thin films grown on different Si substrates. The scan for Gd2O3 layer on Si(001) surface exhibits a distinct peak at 2θ = 46.4° corresponding to the d(440) inter planar spacing of cubic Gd2O3 along [110] orientation. The layers on the Si(111) substrate also exhibit single orientation without any indication of disoriented crystallites. The peaks at 28.5° and 59.4° corresponding to d(222) and d(444) interplanar spacing are hidden under the appropriate Si peaks. The scan for Gd2O3 thin films grown on Si(110) displays a peak at 28.5° confirming the preferential growth along (111) direction.
X-ray diffraction patterns of Gd2O3 thin films grown on Si substrates with different orientation.

IV. DEFECTS IN EPITAXIAL HIGH-k RARE EARTH OXIDES: SELECTING OPTIMUM GROWTH CONDITION
The existence of various defects inside the layer and/or at the oxide/Si interface often degrades the device performance. Therefore, it is of paramount importance to understand the nature of the defects inside the metal-oxide stack and at the oxide/Si interface and address their effective passivation for successful integration of epitaxial LnOs to typical CMOS technology.
Defects in the epitaxial LnOs can be broadly classified into two categories, e.g., structural defects and charge defects. The structural defects include domain boundary, misfit dislocation, stacking faults etc., whereas the charge defect encompasses oxide fixed charge, mobile oxide charges, and interface traps. In the present article we shall focus mainly on the charge defects normally encountered in the epitaxial LnOs, their effect on the electrical properties of these heterostructures, and their effective passivation. It should be noted that to understand the role of the charge defects in the LnO thin films it is necessary to realize good structural quality of the epitaxial layers and atomically sharp interfaces with Si. This is because in addition to the charge defects, the quality of interface between the oxide layer and Si surface also significantly influences the dielectric properties of the heterostructures. As a case study to understand the interface formation between the lanthanide oxides and Si, Fissel et al. reported a detailed investigation of the interface formation between Nd2O3 and Si(100) during epitaxial growth.
Reference Fissel, Elassar, Kirfel, Bugiel, Czernohorsky and Osten29
The RHEED investigation during MBE growth under UHV condition
 $\left( {{P_{{{\rm{O}}_{\rm{2}}}}} \lt 5 \times {{10}^{ - 8}}\;{\rm{mbar}}} \right)$
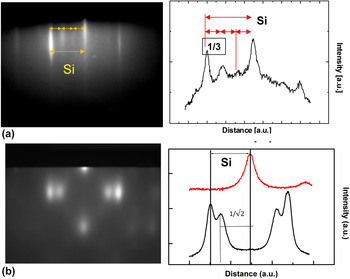
revealed that during the initial stage of oxide layer deposition the surface reconstruction of Si(100) changes from usual (2 × 1) of a clean surface to an unreconstructed (1 × 1). Further deposition leads to additional fractional order RHEED spots appearing at the 1/3 positions between the main (0,1) spots of the zero order Laue zone corresponding to a 3-fold surface periodicity at the surface [Fig. 3(a)]. Similar observation was already reported for the epitaxial growth of Pr2O3 on Si(001).
Reference Fissel, Osten and Bugiel30
During subsequent deposition, the surface changes back to the (1 × 1) structure before bulk spots appear related to diffraction from oxide islands [Fig. 3(b)]. The double spots in Fig. 3(b) correspond to two in-plane lattice constants nearly equal to the lattice constant of silicon and √2 times of that constant, respectively. This indicates that similar to other LnOs crystalline Nd2O3 grows in (110)-oriented domains, with orthogonal in-plane orientations.
Reference Osten, Laha, Czernohorsky, Bugiel, Dargis and Fissel22,Reference Osten, Liu, Bugiel, Mussig and Zaumseil31
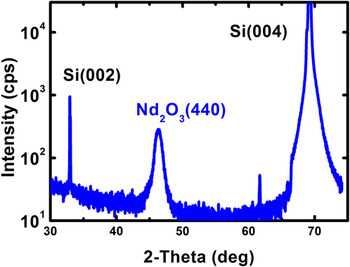
This is also evident from the X-ray diffraction pattern in the θ–2θ geometry, where only the (440) diffraction peak from the oxide layer is visible for the growth on Si(100) (Fig. 4).
RHEED pattern corresponding to Nd2O3 layer on a Si(100) wafer (a) 0.5 nm Nd2O3 and (b) 2 nm Nd2O3 layer thickness. The right hand side displays the intensity profiles along the marked line across the RHEED patterns.

X-ray diffraction pattern in the θ–2θ geometry of a 12 nm Nd2O3 layer grown on a Si (001) substrate.

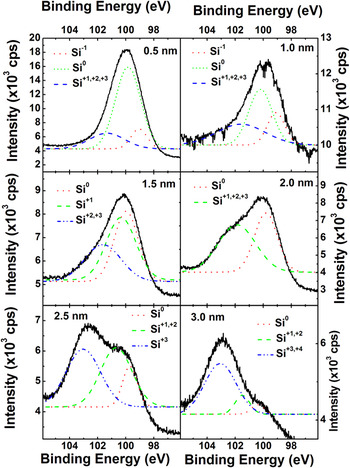
The Nd2O3/Si interface formation was investigated in situ by XPS at different stages of the oxide layer growth. For layers with a thickness in the range up to 1 nm, where the 3-fold periodicity in RHEED was found, the Si 2p core level binding energy mainly corresponds to elemental Si (Si0 state) (Fig. 5). However, additionally a significant broadening was observed also toward the low-energy side of the Si0 peak. Deconvolution of the spectra by Gaussian fit indicated that for layers with thickness ≤1 nm the broadening can be explained by the additional occurrence of a Si1− bonding state due to the formation of Si–Nd bonds in the initial stage of growth. The relatively small shift in the peak position indicates the well-known NdSi2 phase formation.
Reference Netzer32
This finding agrees to an earlier report by Norton et al., where the formation of silicide like surface structure was also associated with the appearance of additional 1/3-order reflections on a (2 × 1) reconstructed surface during Sr deposition on Si(100).
Reference Norton, Park, Lee and Budai33
With increase in the Nd2O3 layer thickness of above 1 nm the spectra exhibit additional peaks at higher binding energies which could be attributed to the different kinds of silicate like bonds.
Reference Fissel, Dabrowski and Osten34
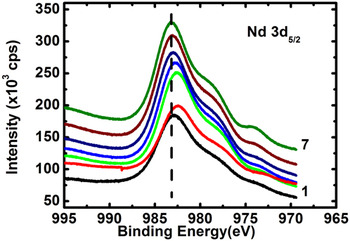
The corresponding neodymium 3d
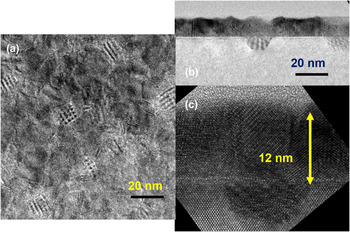
5/2 core-level spectra also supports the silicide-like bond formation at the interface during initial stage of the oxide layer growth (Fig. 6). For the second layer, a shift toward lower binding energies is observed which can be expected if the bonds become metal-like. That behavior together with the observed shifts in the Si spectra can only be explained by an exchange of oxygen bound to silicon by neodymium or by a movement of oxygen atoms from a Si–O–Nd interface site into the layer during the initial stage of growth. TEM investigations also support this assumption. Figure 7 shows TEM micrographs of an Nd2O3/Si(001) heterostructure grown under UHV conditions. The plan-view micrograph exhibits typical Moire fringes originating from interfacial inclusions [Fig. 7(a)]. The crystalline inclusion with the interface extending some nanometers into the Si substrates is clearly seen in the cross-sectional micrographs [Fig. 7(b)]. Additionally, voids were also found in such layers. Based on a detailed analysis of the TEM results, the crystallographic structure of these inclusions could be identified to be identical to the known structure of tetragonal NdSi2.
Reference Bugiel, Osten, Fissel, Kirfel and Czernohosky35
Other LnOs deposited on Si under identical growth condition exhibits similar results. For LnOs growth, the formation and stability of the silicide-like phase depend on the oxygen chemical potential.
Reference Schmeißer, Dabrowski and Müssig36
Considering the low
 ${P_{{{\rm{O}}_2}}}$
under UHV conditions (used in standard MBE growth), the chemical potential of oxygen can also become negative which can facilitate silicide formation over oxide formation. The silicide growth can continue as long as the oxygen chemical potential remains strongly negative due to low oxygen content. This effect predominates at a surface or interface region where the thermodynamic equilibrium is perturbed by different factors, such as stress.
Si 2p spectra together with the appropriate multi peak fitting results of a Si wafer at different stages of Nd2O3 layer growth.

Nd 3d 5/2 core-level XPS spectra for Nd2O3 layers of various thicknesses ranging between 0.5 nm (Spectra 1) to 3 nm (spectra 7). The dashed line represents the expected peak position for bulk Nd2O3.

TEM images of a Nd2O3 layer grown on Si(001), (a) plane-view micrograph, exhibiting pronounced Moiré fringes and (b, c) cross-sectional micrographs with different magnifications exhibiting the formation of crystalline interfacial inclusions. The two Nd2O3(110) domains are indicated by white lines parallel to the atomic planes.

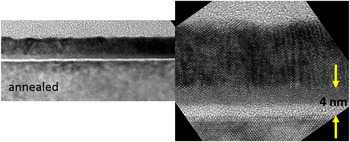
However, such silicide inclusion at the Ln2O3/Si interface can potentially degrade their dielectric properties, especially in case of thin layers. Therefore, for high-k dielectric application the interfacial silicide inclusion has to be avoided. One possible means to circumvent the silicide inclusions is annealing the deposited layers in an oxygen-rich atmosphere. However, such post deposition annealing normally gives rise to an amorphous interfacial layer. Fissel et al. reported that such interfacial layer consists of two regions (Fig. 8), one with lighter and one with darker contrast which was attributed to two different silicates. Reference Fissel, Elassar, Kirfel, Bugiel, Czernohorsky and Osten29
Cross-sectional TEM micrograph of the Nd2O3 layer shown in Fig. 7, after annealing in nitrogen at a pressure of 2 × 10⁻² mbar, and temperature if 600 °C for 10 min. In addition to the disappearance of the silicide inclusions, formation of an amorphous interfacial layer is visible.

These results indicate that to achieve a smooth interface between the epitaxial Ln2O3 and Si, further growth engineering is necessary. In this view, a simple approach is to vary systematically the oxygen chemical potential by variation of the
 ${P_{{{\rm{O}}_{\rm{2}}}}}$
during oxide layer. This has been demonstrated by Czernohorsky et al., where a modified MBE growth process was developed in which the chemical potential of oxygen was optimized with respect to the electrical properties by introducing additional nonactivated molecular oxygen during growth to keep the partial pressure in the range of 10−7 mbar.
Reference Czernohorsky, Bugiel, Osten, Fissel and Kirfel37
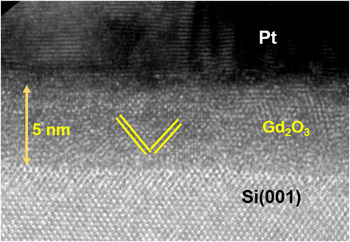
This was found to result in a sharp interface between Gd2O3 and Si (Fig. 9), free from any silicide inclusions as well as silicate or silicon oxide. Therefore, such layers are ideal candidates for investigating the manifestation of charge defects and their influence on the dielectric properties of epitaxial Ln2O3s.
High-resolution cross-sectional TEM micrograph of a Pt/Gd2O3/Si(001) stack. The oxide layer is grown at under a molecular oxygen partial pressure of 5 × 10⁻⁷ mbar. Sharp interface without any amorphous interfacial layer is visible.

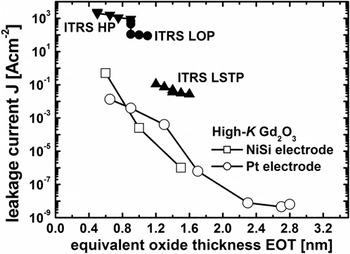
Preliminary investigation of electrical properties of epitaxial layers grown under optimized conditions exhibited very promising characteristics, such as low capacitive equivalent thickness and low leakage current density (CET < 1 nm, J ≈ 10−1 A/cm2). Gottlob et al. reported CET ∼0.86 nm and a leakage current density of ∼0.5 A. cm−2 at 1 V gate bias for MOS stacks consisting of ultra-thin Gd2O3 layers with CMOS-compatible fully silicided nickel-silicide (FUSI-NiSi) metal gate electrodes yields. Reference Gottlob, Echtermeyer, Schmidt, Mollenhauer, Efavi, Wahlbrink, Lemme, Czernohorsky, Bugiel, Fissel, Osten and Kurz38 The CET trend observed for the MOS structures with Gd2O3 gate dielectric and FUSI-NiSi electrode combination met all ITRS targets for oxide thickness as well as leakage current values for high performance (HP), low operating power (LOP), and low standby power (LSTP) applications (Fig. 10). The reported CET values (without quantum–mechanical corrections) represent an upper limit of the achieved effective oxide thickness (EOT). Assuming a quantum–mechanical correction of 0.3 nm to obtain EOT values shifts the trend line to an even more desirable region of specifications. 6 These results indicated that NiSi/Gd2O3 gate stacks with optimized oxide/Si interface properties could be quite promising candidates for scaling efforts to the limit of CMOS. However, despite the outstanding structural qualities, compatibility with CMOS process techniques including metal gate incorporation and encouraging electrical properties the epitaxial Gd2O3 layers (or for that matter other insulating Ln2O3s) suffer from several performance related issues which are required to be addressed prior to real device integration. For example, the MOS structure exhibiting EOT ∼0.86 nm shows strong hysteresis (∼120 mV) in the capacitance–voltage (C–V) profile when the gate bias between forward and backward sweeps at 500 kHz. The hysteretic feature of the C–V profile indicates presence of charge defects inside the oxide layer and/or oxide/Si interface. Gottlob et al. attributed this to oxide traps (Q ot = 3 × 1012 cm−2). Reference Gottlob, Echtermeyer, Schmidt, Mollenhauer, Efavi, Wahlbrink, Lemme, Czernohorsky, Bugiel, Fissel, Osten and Kurz38 Such hysteresis represents flat band voltage (V FB) instability of the dielectric layer which leads to unstable threshold voltage in transistors. This clearly establishes that excellent structural quality of the alternative high-k dielectric does not guarantee satisfactory device performance due to the presence of electrically active charge defects.
Leakage currents versus EOT for ITRS (edition 2005) HP, LOP, LSTP target values, and data epitaxial Gd2O3 layers with different electrodes.

A. Charge defects in epitaxial lanthanide oxides
In MOS structures there can be different types of charge defects that can degrade their electrical performance, such as oxide fixed charge (Q f), interface traps (Q it), and mobile oxide charges (Q m). In addition to unstable threshold voltage and instability of transistor operating characteristics, charge defects scatters carriers in the channel and lowers the carrier mobility. Further, defects cause unreliability; which is the starting point for electrical failure and breakdown of the oxide. SiO2, which is an almost ideal insulating oxide, has very low defect density. The low co-ordination number and high heat of formation of covalent SiO2, that allow it to remain amorphous at typical CMOS processing temperature, helps to minimize the defect density via localized bonding rearrangement. Further, the defects at the Si/SiO2 interface related to Si dangling bonds can be removed by rearranging the bonding network at the interface. Compared to SiO2, high-k metal oxides normally contain more defects. The bonding in high-k metal oxides is highly ionic with higher coordination number which make them poor glass formers. Reference Lucovsky16 Therefore, it is difficult to rearrange the bonds in the metal oxides for defect passivation. Since the charge defects in high-k dielectrics are undesirable for device applications for obvious reasons, much of the present-day engineering of these oxides consists of pragmatic strategies of trying to reduce defect densities by processing control and annealing. In this section we discuss about the nature of different charge defects existing in epitaxial LnOs and at the Ln2O3/Si interface and their effective passivation to improve the dielectric performance.
Let us start with the issues related to the dielectric properties of as-grown epitaxial Gd2O3 layers. The as-grown single crystalline Gd2O3 thin films on Si usually suffer from strong flatband voltage (V FB) instability and are not process robust. This could be due to incomplete passivation of intrinsic dangling bonds induced by the existing binding mismatch at the Gd2O3/Si interface. When a Gd2O3 layer is deposited on clean Si surface; inevitably, the layer always consists of some defects pertaining to the Si dangling bonds at the interface and also due to the very different chemical nature of Si substrate (covalent) and oxide (highly ionic). Despite the oxide being grown epitaxially on Si substrate, not all Si surface atoms would have an opportunity to bond with overgrown epi-Gd2O3 layer’s atoms. Such defects remain unsaturated due to the difference in the lattice parameters and space groups of the oxide and Si substrate. Reference Fissel, Dabrowski and Osten34
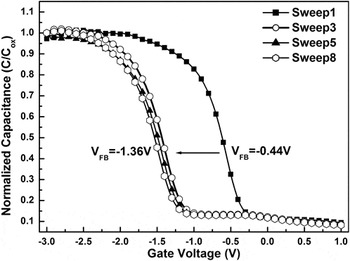
For example, MOS structures consisting of epitaxial Gd2O3 grown on clean Si substrates with atomically sharp interface, exhibit a large shift in the flat band voltage toward negative gate bias direction during multiple C–V sweeping (Fig. 11), which infers to a large number of intrinsic/extrinsic defects present at the interface. Reference Sun, Laha, Ding, Zhang, Osten and Fissel39 Such instability occurs due to the accumulation of mostly positive fixed charges at the Gd2O3/Si interface created during C–V sweeping, Reference Sun, Laha, Ding, Zhang, Osten and Fissel39,Reference Laha, Fissel and Osten40 which could significantly degrade the electrical performance of any device. Reference Lujan, Magnus, Ragnarsson, Kubicek, Gendt, Heyns and Meyer41,Reference Casse, Thevenod, Guillaumot, Tosti, Martin, Mitard, Weber, Andrieu, Ernst, Reimbold, Billon, Mouis and Boulanger42 Laha et al. reported Q f ∼9.5 × 1012 cm−2 for epitaxial Gd2O3 on Si which is only two orders of magnitude lower than the atomic density of dangling bonds on a nonreconstructed Si(001) surface. This implies that approximately 1% of Si surface bonds remain unsaturated even after oxide growth onto it. Reference Laha, Fissel and Osten40 Each Si surface atom possessing a dangling bond usually seeks an additional electron to become electrically neutral. They tend to capture the required electrons from the oxide layer near the interface, thereby creating large number electron vacancies, i.e., positive charges, which results in a large shift of the flat band voltage.
C–V characteristics of single crystalline Gd2O3 on Si(100) substrate.

In addition to the shift in the V
FB under applied bias, MOS structures involving epitaxial Gd2O3 layers on Si also suffer from significant C–V hysteresis when the gate bias is cycled from accumulation to the inversion region and back. This hysteretic nature of the C–V characteristic is related to some sort of recharging process inside the dielectric. The origin of the observed hysteresis may not be unambiguously associated with some definite process. Nazarov et al. suggested that the C–V hysteresis in epitaxial Gd2O3/Si system could be attributed to both trapping of the holes inside the dielectric and recharging the electrons near-surface traps.
Reference Nazarov, Gomeniuk, Gomeniuk, Gottlob, Schmidt, Lemme, Czernohorsky and Osten43
One of the major sources of charge trapping in the metal oxides is the omnipresent oxygen vacancies (VOs) inside the layer, which give rise to defect states inside the band gap of the metal oxides. VOs have been identified as critical trapping centers in diverse high-k metal oxides, such as HfO2, ZrO2, LaAlO3 etc.
Reference Xiong, Robertson, Gibson and Clark44,Reference Xiong, Robertson and Clark45
Further, in ionic metal oxides VOs redistribution can also occur under sufficiently high electric field,
Reference Holzlechner, Kastner, Slouka, Hutter and Feig46,Reference Laha, Ai, Babu, Fissel and Osten47
which can act as potential source of Q
m, thereby contributing at least partially to the observed C–V hysteresis. Czernohorsky et al. demonstrated that the hysteretic C–V characteristics of Gd2O3/Si heterostructures varies with
 ${P_{{{\rm{O}}_{\rm{2}}}}}$
up to a certain limit, which clearly establishes the definitive role of VOs on the hysteretic V
FB instability of epitaxial Gd2O3 layers.
Reference Czernohorsky, Bugiel, Osten, Fissel and Kirfel37
It is obvious that such charge defects, which degrade the dielectric properties of epitaxial Ln2O3s, need to be minimized to improve their electrical performance prior to their integration into microelectronic devices.
V. PASSIVATION OF THE CHARGE DEFECTS IN EPITAXIAL LANTHANIDE OXIDES
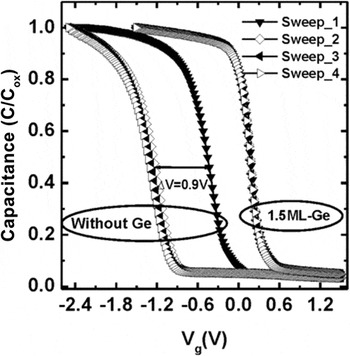
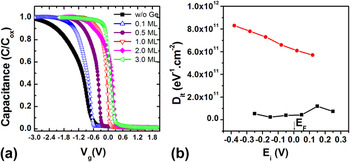
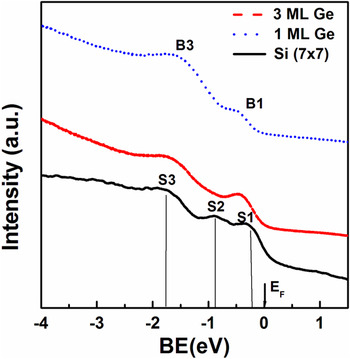
In semiconductor industry one of the most commonly practiced method for passivation of charge defects in MOS structures is a thermal anneal in forming gas ambience. As a first measure for passivation of interface defect states in epitaxial Ln2O3s/Si heterostructures Sun et al. investigated forming gas anneal for the Gd2O3/Si system and found an influence of metal electrode. Reference Sun, Laha, Ding, Zhang, Osten and Fissel39 For example, a post MOS fabrication anneal was found to be effective in case of tungsten electrode, whereas annealing prior to the electrode deposition was found necessary for Pt electrodes. Annealing epitaxial Gd2O3/Si system in forming gas environment at around 450 °C has been reported to reduce the Q fs which stabilizes the V FB. However, this approach is not only very specific to the electrode type, but is not effective for complete elimination of Q fs in the epitaxial Ln2O3s. A negative shift in the flat band voltage (∼−0.44 V) for Pt/Gd2O3/Si stack has been reported even after the forming gas anneal of the MOS structures fabricated on p-type Si. The negative flat band voltage results from Q f ≈ 2.3 × 10¹²/cm2, which is estimated using the relation: Q f = C ox(V FB − Φms), where C ox is the oxide layer capacitance and Φms is the metal work function. Additionally, Pt/Gd2O3/Si stacks possess a large density of trapped interface charges (D it ∼7.63–8.8 × 1011 cm−2). Reference Sun, Laha, Ding, Zhang, Osten and Fissel39 These findings clearly indicate that forming gas anneal is an inadequate method to provide acceptable electrical properties for epitaxial Ln2O3s. Moreover, post deposition anneal also involves the risk of creating uncontrolled interfacial layer, exhibiting smaller dielectric constant as well as results in loss of epitaxy. As an alternative to forming gas anneal, Laha et al. demonstrated that the electrical properties of Gd2O3/Si structures can be improved significantly by interface engineering that involves atomic control growth of a silicate-like interfacial structure prior to the Gd2O3 layer. Reference Laha, Osten and Fissel48 However, controlling the interface composition is quite tedious and it involves multiple steps for substrate’s surface preparation which renders the method less preferred for device fabrication. Another viable alternative surface preparation approach could be the passivation of Si dangling bond states by suitable chemisorbed species prior to the oxide layer growth. For examples, it has been widely reported that an ultrathin Si layer is very effective to passivate Ge surfaces for deep sub-micron p- and n-field effect transistor (FET) application, Reference Wu, Zhang, Zhu, Chan, Li, Balasubramanian, Chin and Kwong49–Reference Taoka, Harada, Yamashita, Yamamoto, Sugiyama and Takagi51 whereas similar investigation for the effect of Ge on Si based devices is not commonplace. But it can be expected that deposition of Ge onto Si surface has also significant impact on the surface charge states of Si. It is known that a sub-monolayer (ML) Ge deposited onto a Si(111) surface leads to a charge transfer from the center Si adatoms near the faulted half unit cell (FHUC) of a Si(111) (7 × 7) unit cell to the nearby Ge atoms, which makes the dangling bond states of Si adatoms empty. Reference Ma, Qin, Xu, Shi, Gao, Wang and Pantelides52 In principle this effect might have significant impact on subsequent properties of devices built on such Si surfaces. Laha et al. investigated the influence of chemisorbed Ge layer on the growth and dielectric properties of epitaxial Gd2O3 layers on Si. Reference Laha, Fissel and Osten40 In this approach different amount of Ge (0.15–3 ML) was deposited by e-beam evaporation on clean Si surfaces prior to the Gd2O3 layer growth. The in situ RHEED patterns of the Gd2O3 layers grown on such Ge-covered Si surfaces (Fig. 12) are very similar to what has been observed for the layers grown pristine Si surfaces. Reference Laha, Osten and Fissel53 This demonstrates that despite the large lattice mismatch between Si and Ge, few MLs of Ge pre-coverage (ΦGe) does not have any impact on the growth and structure of the Gd2O3 layer for ΦGe at least up to 2 ML. Figure 13 compares the C–V characteristics of Gd2O3 layers grown on pristine Si surface and on a Ge pre-covered Si surface. A strong V FB instability corresponding to Q f ∼9.5 × 1012 cm−2 was observed in case of Gd2O3 grown on Si surface without Ge passivation, whereas for Si passivated with 1.5 ML Ge a much stable and ideal-like C–V characteristics was obtained. A systematic increase in ΦGe leads to a monotonic increase in V FB up to a maximum value of 0.3 V for 1.5 ML of Ge coverage [Fig. 14 (a)]. Further increase of Ge coverage was reported to result in nonuniformity in C–V measurements across the wafer. Reference Laha, Fissel and Osten40 The estimated V FB in this case (+0.3 V) indicates negligible amount Q f present at the interface. This improvement in the dielectric properties of the Gd2O3 layers was found to be independent of the Si surface orientation. It was also found that Ge pre-coverage on Si surface improves the density of interface traps significantly [Fig. 14 (b)], which also led to significant reduction in the hysteresis of the C–V characteristic. Reference Laha, Fissel and Osten40 These results clearly indicate that Ge deposition prior to the oxide layer growth significantly influence the electronic properties of Si surfaces and, consequently, the oxide/Si interface. To understand the influence of Ge on the surface electronic properties, Laha et al. also investigated the Si(111) surface states with different ΦGe using UPS. Figure 15 displays the photoemission spectra of Si(111) surfaces with different ΦGe. For pristine Si(111)-(7 × 7) surfaces (ΦGe ∼0), the well-known signals related to the adatom state (S1), the rest atom state (S2), and the back-bond state (S3), are visible at energies close to the Fermi level (E F). Reference Rowe and Ibach54,Reference Uhrberg, Hansson, Nicholls, Persson and Flodström55 In contrast, the spectra from the Ge covered Si(111) surface exhibits only two surface states measured under the same condition, one (B1) about 0.38 eV and the other about 1.70 eV (B3) below the Fermi level. The first peak corresponds to the adatom state of clean Si(111)-(7 × 7) surface, whereas the energetic position of the second peak (B3) is located in between the S2 and S3 states of the clean Si surface. These results are in accordance to the earlier report by Carlisle et al., Reference Carlisle, Miller and Chaing56 where it was found that with increasing ΦGe (>0.3 ML), rest-atom and back-bond surface states merge into one broad feature located approximately halfway between them. Reference Martensson, BNi, Hansson, Michael Nicholls and Reihl57 Such changes in the surface states indicate significant change in the atomic arrangement of the Si surface due to Ge deposition. For example, in case of Si(111) the chemisorbed Ge atoms randomly occupy the Si adatom positions at the very early stage (ΦGe < 0.1 ML). However, with increasing coverage they preferentially occupy the corner adatoms’ position in the FHUC of Si(111)(7 × 7) surface structure. Reference Kajiyama, Tanishiro and Takayanagi58,Reference Wang, Gao, Guo, Wang and Pantelides59 At higher coverage (ΦGe > 0.5 ML), Ge atoms form nanoparticles on FHUC side consisting of approximately eight atoms. Reference Ma, Qin, Xu, Shi, Gao, Wang and Pantelides52,Reference Xu, Ma, Ji, Yang and Gao60 In the presence of Ge nanoparticles, the Si center adatoms transfer charges to the nearby Ge atoms and thereby dangling bond states of such adatoms become partly empty. Reference Ma, Qin, Xu, Shi, Gao, Wang and Pantelides52 Such charge transfer from Si to Ge occurs due to the difference in electronegativity and the compressive strain in Ge layer. Consequently, dipoles form at the Si/Ge interface with an excess of 0.1 electrons on the Ge side. Reference Pourtois, Houssa, Jaeger, Kaczer, Leys, Meuris, Caymax, Groeseneken and Heyns61 Similar behavior has also been reported by various other groups for the Si(001) surfaces, Reference Fontes, Patel and Comin62,Reference Patthey, Bullock, Abukawa, Kono and Johansson63 despite their different microstructure. Reference Oyanagi, Sakamoto, Shioda, Kuwahara and Haga64
RHEED patterns of epitaxial Gd2O3 on (a) Si(111) and (b) Si(001) substrates. 2 ML Ge was deposited on Si surface prior to the oxide layer growth. (Reprinted from Ref. Reference Laha, Fissel and Osten40 with permission of AIP publishing).

C–V characteristics of Pt/Gd2O3/Si(001) MOS capacitors depicting the effect of 1.5 ML Ge coverage on Si(001) substrates. The capacitors fabricated on Ge passivated Si surface exhibit improved C–V behavior. (Reprinted from Ref. Reference Laha, Fissel and Osten40 with permission of AIP publishing).

(a) The C–V characteristics of Pt/Gd2O3/Si(111) MOS capacitors as a function of Ge coverage. The flat band voltage increases monotonically with increasing Ge coverage up to ∼1.5 ML. (b) Density of interface traps for Pt/Gd2O3/Si capacitors fabricated on clean and Ge passivated Si(111) wafers, exhibiting significant improvement on D it values.

UPS spectra from clean Si(111) (7 × 7) surfaces with different Ge coverage, obtained at a photon energy of 21.2 eV. The spectra were recorded along 〈11−2〉 azimuth at an emission angle of 5° with respect to surface normal.

Therefore, the observed reduction in fixed oxide charge density in the Gd2O3/Si interface can mainly be attributed to the charge transfer from Si dangling bonds toward Ge. In case of Gd2O3 growth on Si without pre-deposited Ge the remaining dangling bonds in the oxide/Si interface attempt to capture additional electrons from oxide regions close to the interface to become electrically neutral. Thereby, large number electron vacancies will be created, i.e., positive charges, which results in a large shift of V FB. In contrast, when epitaxial Gd2O3 is grown on a Ge passivated surface, the contribution of the adatom dangling bond states significantly decreases. Moreover, due to the higher electron density at the top Ge layer owing to dipole formation, it is very unlikely that the electrons from the oxide interface would be captured by the underlying substrates, which leads to much more stable interface.
A reduction in fixed oxide charge density in the Gd2O3/Si interface and resultant improvement in the V FB stability of epitaxial Gd2O3/Si structures was observed also for oxide layers grown on Si covered by submonolayer carbon, Reference Laha, Fissel and Osten65 indicating a similar charge transfer effect. Moreover, it was established that V FB can be tailored by tuning the concentration of the chemisorbed species which can provide additional flexibility for device operation. Reference Laha, Fissel and Osten40,Reference Laha, Fissel and Osten65,Reference Shekhter, Roy Chaudhuri, Laha, Yehezkel, Shriki, Osten and Eizenberg66 These observations establish the proof of principle about defect minimization at the oxide/Si interface by Si dangling bond passivation via charge transfer from Si adatoms to isovalent chemisorbed species with higher electronegativity.
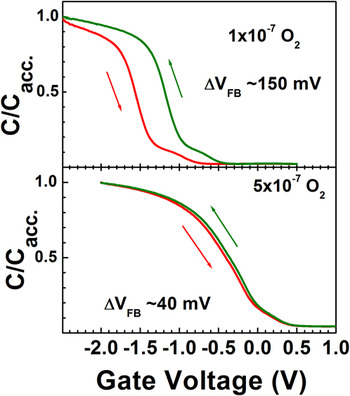
Although surface passivation of Si by isoelectronic elements (Ge or C) prior to the oxide layer growth is a simple and effective way to reduce the fixed oxide charge and trap densities at the epitaxial Gd2O3/Si interface, this cannot completely eliminate the hysteretic C–V characteristics of the MOS structures. As discussed in the previous section, in addition to charging effect, the hysteresis in C–V could be partially related to the mobile charge defects inside the oxide layer owing to VOs. Earlier we observed that with an increase in oxygen chemical potential during the oxide layer growth by an increase in
 ${P_{{{\rm{O}}_{\rm{2}}}}}$
from 1 × 10⁷ mbar to 5 × 10⁷ mbar, the hysteresis also reduces significantly (Fig. 16).
Reference Czernohorsky, Bugiel, Osten, Fissel and Kirfel37
However, a monotonic increase in
 ${P_{{{\rm{O}}_{\rm{2}}}}}$
does not ensure complete elimination of the VOs in the oxide layers.
Reference Czernohorsky, Bugiel, Osten, Fissel and Kirfel37
Moreover, the magnitude of the flatband voltage change from voltage cycling (ΔV
FB > 40 mV) was still beyond the acceptable value (ΔV
FB < 20 mV) for stable transistor operation.
Reference Wilk, Wallace and Anthony12
C–V characteristics of two epitaxial Gd2O3 layers on Si(001) substrates grown at different oxygen partial pressures.

Therefore, to minimize the VOs related defects various post growth processing techniques have also been attempted to compensate those defects in different ionic oxides. However, as already mentioned above with regard to the thermal anneal in forming gas ambience, post growth processing which often involves annealing at high temperature sometimes degrades the overall electrical properties due to the formation of interfacial layers with inferior dielectric constants. Reference Bonnet, Lachkar, Colson and Larpin67,Reference Pan, Wu and Yen68 Alternatively, incorporation of dopants has been reported to be a viable route to improve the electrical properties of different oxides by reducing the influence of VOs. For example, first principle calculations suggested that nitrogen (N) incorporation in Hf based dielectrics can reduce the leakage current conduction by effectively deactivating VOs related gap states. Reference Umezawa, Shiraishi, Ohno, Watanabe, Chikyow, Torii, Yamabe, Yamada, Kitajima and Arikado69 Substantial improvement of electrical properties has also been reported for HfO2 thin films doped with fluorine, nitrogen, or lanthanum. Reference Seo, Sreenivasan, McIntyre and Saraswat70–Reference Wanga, Lia, Chin, Zhu, Shao, Lu, Shen, Yu, Chi, Shen, Huan, Pan, Du, Lo, Chan and Kwong72
To explore the possible influence of dopants on the electrical properties of epitaxial Ln2O3s, we investigated the influence of nitrogen incorporation on the dielectric properties of epitaxial Gd2O3 layers. Nitridation of the layers was achieved by using nonactivated molecular N2O as process gas instead of O2 during growth. The incorporation of nitrogen into the oxide layers was checked by secondary ion mass spectroscopy (SIMS). The formation of Gd–N bonds in the Gd2O3:N layers was confirmed by in situ XPS measurements from the chemical shift of the Gd 4d peaks toward lower binding energy compared to pure Gd2O3 layers.
Reference Roy Chaudhuri, Fissel, Archakam and Osten73
However, a quantitative estimation of the N incorporated into the Gd2O3 layers by this approach is yet to be achieved. Layers with different amount of N were grown by maintaining different partial pressure of N2O
 $\left( {{P_{{{\rm{N}}_{\rm{2}}}{\rm{O}}}}} \right)$
during deposition. All Gd2O3:N samples grown with different
 ${P_{{{\rm{N}}_{\rm{2}}}{\rm{O}}}}$
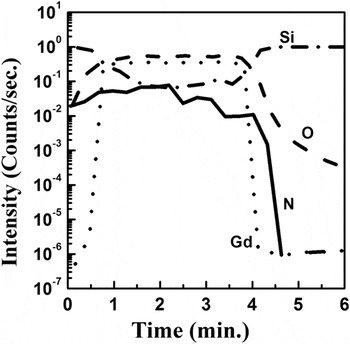
exhibited similar uniform distribution of N concentration across the oxide layer. Figure 17 displays the SIMS profile of a representative Gd2O3:N sample which confirms the presence of N inside the oxide layer.
SIMS depth profile of Gd, O, N and Si elements of a representative Gd2O3:N sample as function of etching time.

Further, to understand the impact of N incorporation on the growth of Gd2O3 and the electrical properties of MOS stacks with epitaxial Gd2O3:N on Si, these layers were compared with control Gd2O3 layers grown with similar partial pressure of molecular oxygen. Reference Roy Chaudhuri, Fissel, Archakam and Osten73,Reference Roy Chaudhuri, Fissel and Osten74 The streaky RHEED patterns [Fig. 18(a)] exhibited by the Gd2O3:N layer surface indicate the same two-dimensional growth on Si(111) as observed for undoped oxide. Figure 18(b) compares the X-ray diffraction patterns of two Gd2O3:N layers grown at different N2O partial pressures with a control Gd2O3 layer in the θ–2θ geometry. The shoulder observed at 2θ ∼28.9° beside the Si(111) peak corresponds to the (111) oriented epitaxial Gd2O3 with cubic bixbyite type of structure. These results indicate that usage of N2O as a process gas incorporates N into the Gd2O3 layers only at a doping level and it does not affect the growth and structure of the layers.
(a) RHEED pattern along the 〈110〉 azimuth of a representative Gd2O3:N layer (
 ${P_{{{\rm{N}}_{\rm{2}}}{\rm{O}}}}$
∼5 × 10⁻⁷ mbar) and (b) X-ray diffraction patterns in the θ–2θ geometry of a control Gd2O3 layer and two representative Gd2O3:N layers.

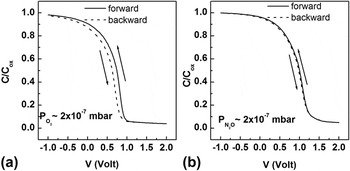
However, a dramatic change in the dielectric properties of the epitaxial Gd2O3 layers was observed due to N incorporation. Figure 19 compares the C–V characteristics of a Gd2O3 and a Gd2O3:N sample grown under lower partial pressure of the process gases (∼2 × 10⁻⁷ mbar). The control sample prepared under reduced
 ${P_{{{\rm{O}}_{\rm{2}}}}}$
[Fig. 19(a)] exhibits a strong hysteresis in the C–V behavior inferring that there exist a large number of mobile oxide charges inside the oxide layer. A density of Q
m ∼2 × 1012 cm−2 was estimated from the hysteretic shift of the V
FB (∼140 mV) assuming only Q
m contribution to the C–V hysteresis. In contrary, in case of N doping [Fig. 19(b)] hysteresis in C–V was nearly vanished with ΔV
FB < 10 mV corresponding to a Q
m < 1 × 1011 cm−2. This clearly demonstrates that nitridation of Gd2O3 even at a low level
 $\left( {{\rm{lower}}\;{P_{{N_2}O}}} \right)$
already results in a nearly ideal dielectric behavior, likely due to an effective compensation of mobile oxide charges.
Representative C–V hysteresis curves corresponding to (a) a control epitaxial Gd2O3 samples and (b) an epitaxial Gd2O3:N sample.

The influence of doping by other species has also been investigated by introducing carbon into Gd2O3. C incorporation in different high-k oxides was reported to improve their dielectric properties. Reference Dutta, Hembram, Mohan Rao and Waghmare75,Reference Chu, Chang, Steigerwald, Flemimg, Opila, Lang, Van Dover and Jones76 In our investigation, incorporation of C into the epitaxial Gd2O3 layers was found to result also in a significant improvement in the dielectric properties of MOS structures (i.e., minimize C–V hysteresis and lower leakage current density) for C concentration below 0.5%. Reference Laha, Ai, Babu, Fissel and Osten47,Reference Laha, Bin, Babu, Fissel and Osten77 However, at higher concentration, C segregates to the oxide/Si interface during growth. That leads to polycrystallinity and degradation of the electrical properties due to the formation of additional defects, Reference Laha, Ai, Babu, Fissel and Osten47,Reference Shekhter, Roy Chaudhuri, Laha, Yehezkel, Shriki, Osten and Eizenberg66 which makes it less preferred choice for doping Gd2O3 compared to N.
In addition to their impact on the dielectric properties, the dopants can also have significant influence on the electronic structure of high-k oxides. For example, density functional calculations revealed that incorporation of N into high-k oxides leads to a reduction of their band gap and the VBO with Si which could result in degradation of the MOS electrical properties. Reference Shang, Peacock and Robertson78 Therefore, to gain a holistic understanding, the impact of N incorporation into epitaxial Gd2O3 layers on its band structure and dc leakage properties were also investigated. The electronic structure of the oxide layers were probed using in situ XPS measurement. Valence band photoelectron spectra of the layers were used to estimate the impact of N doping on the VBO of Gd2O3 with Si, which was determined from the relation:
 $$\Delta {E_{\rm{V}}} = \left( {E_{{\rm{CL}}}^{{\rm{Ox}}} - E_{\rm{V}}^{{\rm{Ox}}}} \right) - \left( {E_{{\rm{CL}}}^{{\rm{Si}}} - E_{\rm{V}}^{{\rm{Si}}}} \right) - \Delta {E_{{\rm{CL}}}}\quad ,$$
where
 $\left( {E_{{\rm{CL}}}^{{\rm{Ox}}} - E_{\rm{V}}^{{\rm{Ox}}}} \right)$
and
 $\left( {E_{{\rm{CL}}}^{{\rm{Si}}} - E_{\rm{V}}^{{\rm{Si}}}} \right)$
are the core level to valence band maximum (VBM) energy difference for bulk Gd2O3 or Gd2O3:N and Si, respectively, and ΔE
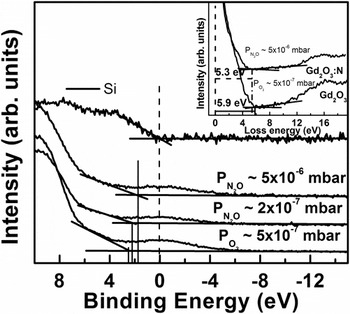
CL is the separation between a certain core level of the oxide (O 1s) and Si (Si 2p). The parameters for Si were measured from an identical bare Si wafer. The Si 2p peak position, measured under the presence of a thin oxide layers (∼2 nm) at the Si surface, was found to be independent on the nature and the partial pressure of the processing gas (O2 or N2O) applied during the epitaxial layer growth, and, moreover, no notable difference in the oxide peak position was observed for samples with different thicknesses. Since the VBM for Si was nearly zero, the VBO between Gd2O3:N or Gd2O3 and Si could be directly determined from the position of the VBM of the oxide layers on Si. Figure 20 presents the VB photoelectron spectra of a control Gd2O3 sample and Gd2O3:N samples grown on Si at different
 ${P_{{{\rm{N}}_{\rm{2}}}{\rm{O}}}}$
. A value of 2.4 ± 0.2 eV was obtained for VBO for all control Gd2O3 samples grown at different
 ${P_{{{\rm{O}}_{\rm{2}}}}}$
, which is in good agreement to an earlier report.
Reference Laha, Osten and Fissel48
Doping of Gd2O3 with N leads to a reduction of the VBO with Si. Thereby, the VBO value of Gd2O3N was found to reduce progressively with increasing
 ${P_{{{\rm{N}}_{\rm{2}}}{\rm{O}}}}$
from 2.2 ± 0.2 eV for
 ${P_{{{\rm{N}}_{\rm{2}}}{\rm{O}}}}$
∼2 × 10⁻⁷ mbar up to a value of 1.7 ± 0.2 eV at
 ${P_{{{\rm{N}}_{\rm{2}}}{\rm{O}}}}$
∼2 × 10⁻⁶ mbar. Further increase of
 ${P_{{{\rm{N}}_{\rm{2}}}{\rm{O}}}}$
did not influence the VBO under present experimental conditions, inferring saturation in the concentration of N incorporated into the Gd2O3 layer.
Valence Band spectra for Si, a control Gd2O3 layer and two Gd2O3:N layers, (inset) O 1s energy loss spectra of a control Gd2O3 layer and a Gd2O3:N layer.

In further investigations, the band gaps of the Gd2O3:N and control Gd2O3 layers were estimated in XPS from the threshold energy of the plasmon energy loss spectrum observed at higher binding energy of the O 1s core level peak, as already demonstrated for other metal oxides.
Reference Nohira, Tsai, Besling, Young, Petry, Conard, Vandervorst, De Gendt, Heyns, Maes and Tuominen26
As shown in the inset of Fig. 20, the extrapolation yields a band gap energy of 5.9 ± 0.2 eV for the control sample, which agrees very well to the previously reported values for epitaxial Gd2O3 layers on Si.
Reference Laha, Osten and Fissel48
In contrast, the band gap of the Gd2O3:N layers was found to decrease from 5.7 ± 0.2 eV for a layer grown at
 ${P_{{{\rm{N}}_{\rm{2}}}{\rm{O}}}}$
∼2 × 10⁻⁷ mbar to 5.2 ± 0.2 eV for a layer grown at
 ${P_{{{\rm{N}}_{\rm{2}}}{\rm{O}}}}$
∼2 × 10⁻⁶ mbar.
The band gap narrowing and reduction in VBO of epi-Gd2O3:N with Si can be understood by considering the nature of the VB structure of the binary Ln sesquioxides. In case of the Ln sesquioxides the valence band maximum is formed mainly by the O 2p states. Reference Gillen, Clark and Robertson79 In case of substitutional N incorporation in different lanthanide and transition metal oxides (e.g., La2O3, HfO2), their upper VB levels are shared between both O 2p and N 2p states. Reference Shang, Peacock and Robertson78 The energy level of the N 2p states lie above the O 2p states, which leads to a shift of the VBM toward higher energy, thereby reducing the VB offset of the N doped oxide layer with Si. The same is valid for Gd2O3, the increase of N content in the Gd2O3 layers causes the VBM to possess increasing N 2p character, which leads to the gradual reduction of the band gap and VBO with Si, until saturation. The conduction band offsets (CBOs) estimated for the Gd2O3/Si structures considering the differences in the VBO, the energy gap of the Si substrate (∼1.12 eV) and the measured band gap of the oxide were found to be nearly identical (2.4 ± 0.2 eV) for all the Gd2O3 and Gd2O3:N samples; indicating that the CB of the oxide layers remains nearly unaffected by N doping, that agrees well with ab initio calculations reported for related oxides. Reference Shang, Peacock and Robertson78
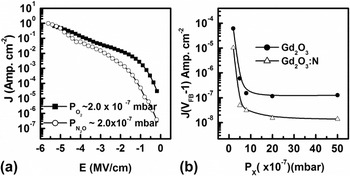
The reduction in the VBO with Si due to N incorporation can be expected to degrade the insulating properties of the Gd2O3:N layer owing to lower hole barrier. However, as demonstrated for a representative set of samples in Fig. 21(a), the room temperature dc leakage measurements revealed that at applied electric fields below 4 MV/cm all the Gd2O3:N samples grown under different
 ${P_{{{\rm{N}}_{\rm{2}}}{\rm{O}}}}$
exhibit lower leakage current densities compared to the control Gd2O3 samples grown under similar
 ${P_{{{\rm{O}}_{\rm{2}}}}}$
indicating their superior insulating properties. For example, at 1 V (V
FB −1 V), the leakage current densities of the Gd2O3:N layers were found to be about one order of magnitude lower compared to the control samples [Fig. 21 (b)].
(a) Room temperature dc leakage current densities of a representative Gd2O3 and a Gd2O3:N layer. (b) dc leakage current densities measured at 1 V for different Gd2O3 and Gd2O3:N samples as functions of ambient gas partial pressure (P X) during growth. X denotes O2 in case Gd2O3 and N2O in case of Gd2O3:N layers. The lines are to guide the eyes.

The superior insulating properties of the Gd2O3:N layers can be explained by considering the influence of N on the electrically active defects in Gd2O3, especially on VOs, which are the most dominating electrically active defect in complex oxides grown at higher temperatures. Reference Robertson, Xiong, Clark and Gusev80,Reference Guha and Naryan81 Experimental investigations and ab initio calculations revealed that VOs induce electron conduction paths in complex oxides which give rise to enhanced leakage current densities. Reference Fleming, Lang, Jones, Steigerwald, Murphy, Alers, Wong, van Dover, Kwo and Sergent82–Reference Liu, Clark and Robertson85 The same can be suggested for epitaxial Ln2O3s. In case of ionic oxides, this occurs via VOs induced energy states within the band gap, which are occupied by two electrons for the neutral vacancy (V 0 O) and are strongly localized on the orbitals of the adjacent metal ions. Reference Shekhter, Roy Chaudhuri, Laha, Yehezkel, Shriki, Osten and Eizenberg66,Reference Robertson, Xiong, Clark and Gusev80,Reference Broqvist and Pasquarello83 Moreover, migration of VOs under sufficiently large electric field can also give rise to an increase in the leakage current densities in complex oxides. Reference Tse, Liu, Xiong and Robertson86–Reference Wang and McKinstry88 Lowering of the leakage current densities by incorporation of N into Gd2O3 layers can be understood in much the same way as the elimination of the hysteresis effect in C–V measurements of nitrogen-doped Gd2O3 by considering the specific role of N in compensating the adverse effects the VOs related defects. In analogy to the effect of N incorporation in various other ionic oxides, this can only happen either due to the formation of N–VOs complexes and/or substitution of the VOs by N atoms in the Gd2O3:N. First principle calculations of N incorporation in different oxides suggested that in a minimum free energy configuration two N atoms occupy the nearest neighbor O sites to VOs. Reference Umezawa, Shiraishi, Ohno, Watanabe, Chikyow, Torii, Yamabe, Yamada, Kitajima and Arikado69,Reference Li and Robertson89 In this arrangement each N atom extracts one electron from the neutral VO sites to form a closed shell electronic configuration. Consequently, neutral VOs transform into positively charged VO 2+ forming electric dipoles, which effectively elevates the energy of the VO related gap states above the conduction band of these oxides. In this way the dc leakage conduction is reduced. Reference Umezawa, Shiraishi, Ohno, Watanabe, Chikyow, Torii, Yamabe, Yamada, Kitajima and Arikado69,Reference Robertson, Xiong, Clark and Gusev80
In analogy, the observed improvement in the dielectric properties of the Gd2O3:N layers could be attributed to a similar mechanism when N atoms combine favourably to the VO sites in Gd2O3 and modify their charge states. Moreover, N atoms can also immobilize the VOs which can in turn reduce the VOs motion related leakage current conduction under an applied electric field.
Reference Umezawa, Shiraishi, Ohno, Watanabe, Chikyow, Torii, Yamabe, Yamada, Kitajima and Arikado69
The effect gets more pronounced with increasing N content in the Gd2O3:N layers grown at higher
 ${P_{{{\rm{N}}_{\rm{2}}}{\rm{O}}}}$
. Further, the electric field corresponding to dielectric breakdown was found to be in the range of 4.5–5 MV/cm for all the samples, which agrees to the thermochemical description of dielectric breakdown in high-k materials.
Reference McPherson, Kim, Shanware and Mogul90,Reference McPherson, Khamankar and Shanware91
However, in case of the Gd2O3:N layers the breakdown field was found to reduce with increasing N content. Such reduction in the dielectric breakdown field could be attributed to a collective effect of the reduced VB offset and an enhanced local electric field in the Gd2O3 layer due to N incorporation.
Reference McPherson, Kim, Shanware and Mogul90,Reference McPherson, Khamankar and Shanware91
VI. SUMMARY AND OUTLOOK
We discussed different ways of growth optimization for improvement of dielectric properties of insulating Ln2O3 epitaxial grown on Si using molecular beam epitaxy. The growth optimization and discussion involves the density of charge defects inside the oxide layer as well as the oxide/Si interface, their impacts on the dielectric properties of oxide/Si heterostructures and different methods to passivate the charge defects. As a standard material we have considered epitaxial Gd2O3 layers to discuss the proof of principles. We demonstrated that the best vacuum condition achieved in the MBE chamber during oxide layer growth (∼10−8 mbar) leads to silicide formation at the interface, which degrades the dielectric properties of the oxide layers. A controlled supply of molecular oxygen during the growth improves the interface quality significantly, however too high oxygen partial pressure leads to formation of lower permittivity interfacial layer and finally limits the achievable minimum effective oxide thickness. Partial pressure of oxygen in the range 10−7 mbar was found to be optimal to achieve epitaxial layers having atomic sharp interface to Si. Although such layers exhibit good dielectric properties in terms of the effective oxide thickness, as grown epitaxial Ln2O3s exhibit strong shift of the flatband voltage toward negative gate bias direction and also suffer from hysteretic flat band instability which render them unsuitable for transistor applications. In view of understanding the origin of flat band instability, we discussed the nature of fixed oxide charges in the epitaxial layers and their impact on the dielectric properties. The unsaturated dangling bond states in the oxide/Si interface were found to be responsible for the creation of positive charges inside the oxide layer, since they captures electrons form the oxide layer near to the interface. In addition to the fixed oxide charges, interface traps and mobile oxide charges originating from omnipresent oxygen vacancy related defect states also degrade the dielectric properties of the oxides. Consequently, these defects are required to be minimized prior to integrating these oxides into the Si technology for device application.
We have discussed different possible methods of defect passivation, such as annealing, doping and surface passivation by foreign atoms. Annealing the Ln2O3 layers in forming gas ambience, which is one of the most commonly used method for defect passivation in microelectronic materials, stands inadequate due to its sensitivity to the type of the metal gate used. As a viable alternative to this approach we have demonstrated that few monolayers of chemisorbed Ge or C on Si surface significantly improves the electrical properties of MOS structures with epitaxial Gd2O3 layers by passivation the Si dangling bond states. This happens due to the charge transfer from the dangling bonds of Si to the Ge or C atoms owing to the difference in their electronegativity. The passivation of the fixed oxide charges and interface traps stabilizes the flat band voltage and reduces hysteresis. Moreover, the flat band voltage can be tuned systematically by precisely controlling the amount of the chemisorbed species.
Incorporation of nitrogen into the oxide layers in a doping level was found to be a suitable way for passivation mobile oxide charges inside the layers, which results in vanishing flat band voltage hysteresis. Incorporation of N into the epitaxial Gd2O3 layer results in a band gap narrowing, which is related to the shift of valence band edge in Gd2O3:N layers toward higher energy due to their presumably increasing N 2p character in the valence band edge. Despite the declining VBOs with Si, the dc leakage current densities of epitaxial Gd2O3 layers is reduced significantly by N doping. These observations suggest that N incorporation in a doping level can improve the overall electrical properties of epitaxial Ln2O3s by passivation the detrimental effects of the electrically active VOs related defect states. Therefore, it appears that suitably doped epitaxial Ln2O3 layers deposited on surface Si surfaces, which are passivized with chemisorbed Ge, can be ideal candidate materials for next generation high-k dielectric applications. However, it should be noted that the extent to which the band gap of Gd2O3:N and its band offsets with Si can be tuned by increasing the N doping concentration still remains unclear. Furthermore, the impact of oxide doping and oxide/Si modification by Ge pre-deposition in active devices, such as CMOS based FET, is not yet tested in practice.
ACKNOWLEDGMENT
This paper reviews research results we have been working on for the last 10 years at the Institute of Electronic Materials and Devices, Leibniz University Hannover. We are grateful to all PhD students and scientist working with us on particular aspects of that challenging project. We also would like to thank all partners and friends in Germany and all over the world for intense collaboration and help. Finally, we acknowledge the support of various organisations, in particular DFG (Deutsche Forschungsgemeinschaft), BMBF (Bundesministerium für Forschung und Technologie), DAAD (Deutscher Akademischer Austauschdienst), Humboldt Foundation, and GIF (German-Israel Foundation for Scientific Research and Development).