

Introduction
The oriental fruit fly Bactrocera dorsalis (Hendel) (Diptera: Tephritidae) is a serious pest on a wide range of fruit crops in the Indian subcontinent. Particularly on mango (Mangifera indica L., Anacardiaceae), it causes losses of up to 80% (Verghese and Kamala Jayanthi, Reference Verghese, Kamala Jayanthi, Parvatha Reddy, Verghese and Krishna Kumar2001). The pest is active throughout the year in South India, whereas it hibernates in the northern parts (November to March) in the pupal stage (Butani, 1979). After mating, females lay their eggs in fruits while they are still on the tree. The ensuing larvae render the fruit inedible as on hatching, they feed on the pulp of these fruits, resulting in a brown patch around the oviposition site, and the infested fruit starts rotting. These affected fruits drop down prematurely and the maggots come out of the fruits to pupate in the soil (Verghese and Kamala Jayanthi, Reference Verghese, Kamala Jayanthi, Parvatha Reddy, Verghese and Krishna Kumar2001). Fruit fly populations increase rapidly during the summer, which usually coincides with the mango cropping season, and during the off-season, they survive on guava (Psidium guajava L., Myrtaceae), thereby completing several generations each year (Kamala Jayanthi and Verghese, Reference Kamala Jayanthi and Verghese2011).
Given the tremendous economic importance of B. dorsalis, progress has been made in managing the pest using methyl eugenol traps (Ali et al., Reference Ali, Ullah and Khan1999), proteinaceous food baits (Cornelius et al., Reference Cornelius, Duan and Messing1999, Reference Cornelius, Nergel, Duan and Messing2000; Pinero et al., Reference Pinero, Mau and Vargas2009), insecticide applications (Anjum et al., Reference Anjum, Razag and Yazadni2000) and integrated methods (Verghese et al., Reference Verghese, Tandon and Stonehouse2004). Nevertheless, the efficiency of these methods mainly depends on fruit fly population levels. Prediction of the fruit fly field population levels would help greatly in determining the success of integrated pest management programmes (Kamala Jayanthi and Verghese, Reference Kamala Jayanthi and Verghese2011). To date, weather-based regression models continue to dominate fruit fly prediction in a region (Verghese et al., Reference Verghese, Nagaraju, Madhura, Jayanthi and Sreedevi2006b). Attempts were also made to improve the precision of regression models using host plant phenology along with weather variables with a 78% prediction accuracy (Kamala Jayanthi and Verghese, Reference Kamala Jayanthi and Verghese2011). Therefore, this study was designed to verify whether the latest soft-computing techniques such as artificial neural networks (ANNs) that are being widely used in the modelling and prediction of real-world problems, which are not modelled or too difficult to model mathematically (Hashimoto, Reference Hashimoto1997; Haykin, Reference Haykin2001; Sreekanth et al., Reference Sreekanth, Geethanjali, Sreedevi, Shakeel, Ravi Kumar and Jayanthi2009), are suitable for fruit fly predictions. Usually, these problems are typically associated with complex, dynamic systems of particularly non-linear nature, a common criterion usually associated with biological systems. Neural networks have self-learning capability and are fault-tolerant as well as noise-immune to suit such non-linear biological systems, and have highly successful applications in various fields such as forecasting, system identification, pattern recognition and so on (Sreekanth et al., Reference Sreekanth, Geethanjali, Sreedevi, Shakeel, Ravi Kumar and Jayanthi2009). However, few studies have applied ANNs to predict insect populations. Rajat et al. (Reference Rajat, Narayana, Krishna Reddy, Ranga Rao, Gowda, Reddy and Rama Murthy2003) used a neural network-based forecasting model in the population dynamics of the pod borer Helicoverpa armigera (Hubner) (Lepidoptera: Noctuidae). A prediction model was also developed for population occurrence of the paddy stemborer Scirpophaga incertulas Walker (Lepidoptera: Pyralidae) using back-propagation (BP) ANNs and principal components analysis (Lin-nan et al., Reference Lin-nan, Lin, Li-min, Li-lian and Shi-sheng2009).
In the present study, a model was developed to predict B. dorsalis trap catches using a combination of weather and host plant phenology data via soft-computing tools, namely ANNs, to obtain more accurate and precise forecasting than with the traditionally used regression models.
Materials and methods
Study location
The study was carried out at the Indian Institute of Horticultural Research, Bangalore (12o58′00″N; 77o35′00″E; 920 m above sea level).
Field data collection
Three methyl eugenol traps were placed approximately 100 m from each other in a 15-year-old guava (cultivar Allahabad Safeda) orchard. The traps consisted of plywood blocks of 2 cm3 impregnated with methyl eugenol and dichlorvos (as a killing agent; Verghese et al., Reference Verghese, Nagaraju and Jayanthi Mala2006a). The blocks were placed in mineral water bottles with a 2-cm2 opening on all the four sides of the bottle from two-thirds height from the bottom. These bottles were thereafter suspended firmly to a guava branch with the help of twine placed at a height of 100 cm from the ground (Madhura and Viraktamath, Reference Madhura, Viraktamath, Verghese and Reddy2001). The flies were monitored on a fortnightly basis (from 1 June 2000 to 17 June 2002). The flies attracted to each trap were obtained fresh and brought immediately to the laboratory for identification using the characters described by Drew and Hancock (Reference Drew and Hancock1994). Parallel field observations were recorded on the host plant phenology of P. guajava, namely tender leaves, half-mature leaves, full-mature leaves, senescent leaves, flower buds, opened flowers, small immature fruits, medium-sized immature fruits and large mature fruits. All these variables were scored visually on a per cent basis (0–100).
In addition to fruit fly trap catches and host plant phenology data, concurrent weather parameters including relative humidity (%), wind speed (km/h), maximum temperature (oC), minimum temperature (oC) and rainfall (mm) were collected every fortnight from the meteorological section of the institute located in close proximity to the study orchard.
Data processing and neural network training
The Elman network, along with a Quasi-Newton (QN) algorithm based on Newton's method, was used for programming in MATLAB 7.0. In QN-ANN models, source nodes in the input layer of the network supply the respective elements of the activation pattern that constitute the input signals to the neurons in the second layer. The output signals of the second layer are used as inputs in the third layer, and so on for the rest of the network. Thus, typically, the neurons in each layer of the network have their inputs from the output signals of the preceding layer only. The set of the output signals of the neurons in the output layer of the network constitutes the overall response of the network supplied by the source nodes in the input layer, as shown in Fig. 1, which explains a typical ANN with two hidden layers as used in the present study.
Illustrative model of the QN-ANN network

In the present study, to develop an accurate fruit fly prediction model, ANNs were trained with Elman along with a QN algorithm (based on Newton's method), as mentioned above. Newton's method (that has the following basic step: X k+1 = X k–A k− 1g k, where A k is the Hessian matrix (second derivatives) of the performance index at the current values of the weights and biases) is an alternative to the conjugate gradient methods for fast optimization, and it often converges faster than the conjugate gradient methods. However, it is complex and expensive to compute the Hessian matrix for Elman networks using Newton's method. Nevertheless, there is a class of algorithms that is based on Newton's method, but which does not require the calculation of the second derivatives called the QN (or secant) method, which update an approximate Hessian matrix at each iteration of the algorithm and the update is computed as a function of the gradient.
In the present study, the total identified input nodes for this structure are 14 independent variables that include both abiotic (weather parameters, namely rainfall, relative humidity, wind speed and temperatures (minimum and maximum)) and biotic (host plant phenology variables, namely tender leaves, half-mature leaves, full-mature leaves, senescent leaves, flower buds, opened flowers, small immature fruits, medium-sized immature fruits and large mature fruits) variables that have a direct influence on fruit fly population fluctuations (Kamala Jayanthi and Verghese, Reference Kamala Jayanthi and Verghese2011). The selected QN-ANN structure was 14-25-20-1 (i.e. 14 input layer nodes – abiotic/biotic variables; two hidden layers each with 25/20 nodes, respectively; and one output layer node – fruit fly trap catch), where mapping the hidden layers and the respective nodes was carried out based on a trial and error method, as there was no standard methodology for selecting the same (Abdusselam, Reference Abdusselam2007). The applied transfer functions are radial basis and hyperbolic tangent sigmoid. Normally, the dataset for an ANN is divided into three parts: training, validation and testing (Affandi et al., Reference Affandi, Kunio and Haryadi2007). However, because of the limited sampling data (2 years of fruit fly catches) in the present study, we considered only training and testing. The only difference between a testing phase and a validation phase is that if the error rate of the validation phase increases, then the training stops. In the present study, those two terms are used synonymously. Results of linear regression analysis carried out with the same dataset by Kamala Jayanthi and Verghese (Reference Kamala Jayanthi and Verghese2011) were used to study the comparative predictive performance of a traditional regression model (Little and Hills, Reference Little and Hills1978) along with the developed ANN model. The efficiency/response of the neural network for accurate output was measured using statistical indices, namely root mean square error (RMSE), regression coefficient (R 2) and Nash–Sutcliffe model efficiency coefficient (E), and calculated according to equations (1)–(3).

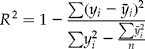
where y i is the observed data,  is the calculated data and n is the number of observations.
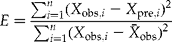
where X obs and X pre are observed and predicted data, respectively, and n is the number of data in the set.
Results
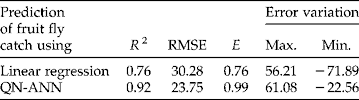
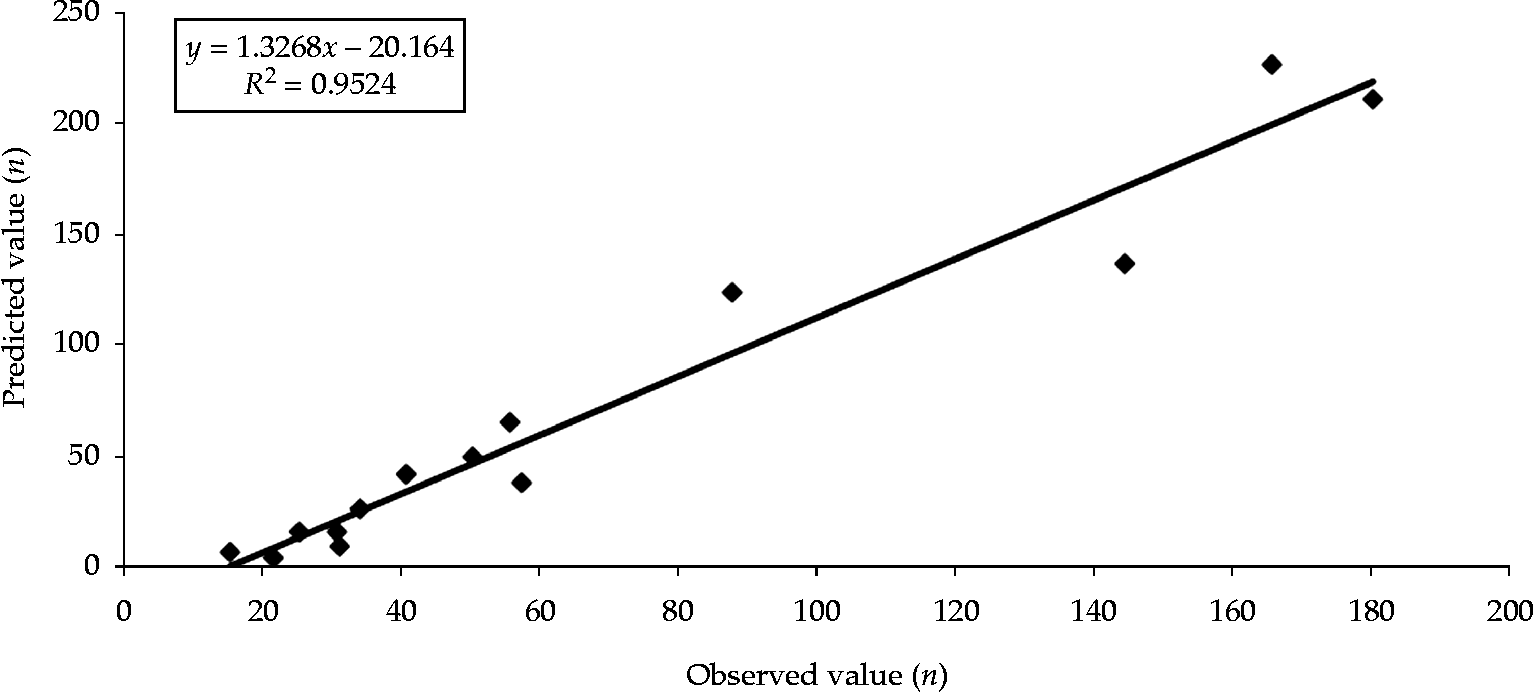
In the present study, ANN could predict the B. dorsalis trap catches more accurately (R 2 = 92) compared with the traditional regression models (R 2 = 76). Apart from R 2, another statistical parameter measuring the goodness-of-fit of the model, i.e. RMSE, was also found to be reasonably lower in the ANN model (23.75) compared with the regression model (30.28). The error variation was also found to be comparatively less in the ANN model than in the regression method. The Nash–Sutcliffe model efficiency coefficient (E), a widely used and potentially reliable statistic index for assessing the goodness-of-fit of predictive models (Nash and Sutcliffe, Reference Nash and Sutcliffe1970), was high in the ANN model (0.99) compared with the regression model (0.76) (Table 1). Essentially, the closer the Nash–Sutcliffe model efficiency is to unity, the more accurate the model is, and the present study clearly highlighted the improved efficiency of the ANN model over the traditional regression model for predicting the B. dorsalis trap catches. A scatter plot of predicted versus observed fruit fly trap catches showed that the ANN was successful in estimating the fruit fly trap catches more accurately. The values are close to a diagonal line, which represents a perfect fit between the predicted and observed values of fruit fly trap catches, even with some points being slightly scattered (Fig. 2).
Performance of the QN-ANN and linear regression models
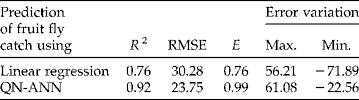
QN-ANN, quasi-Newton artificial neural network; RMSE, root mean square error; E, Nash-Sutcliffe model of efficiency coefficient; Max., maximum; Min., minimum.
Scatter plot of model prediction versus observed fruit fly trap catch
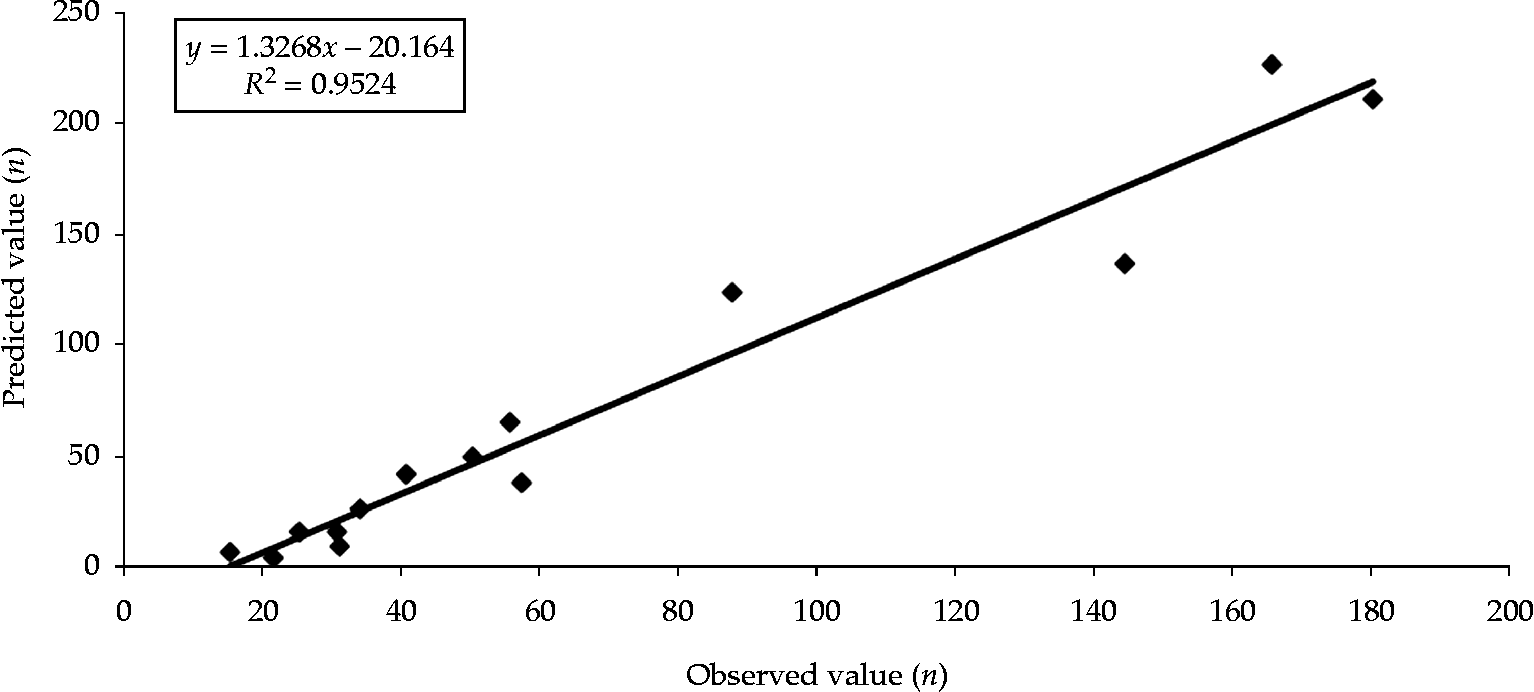
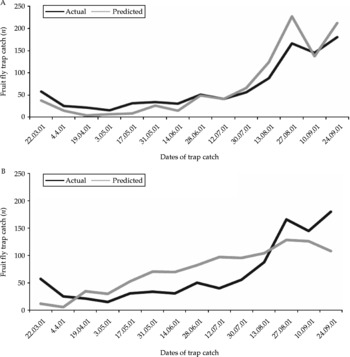
Figure 3 shows a comparison between the estimated and observed fruit fly trap catches using the ANN and a traditional linear regression model, respectively. The mean absolute error or the mean actual difference in observed and predicted values for each data point was 1.82 and 5.69 fruit flies per trap for the ANN and the linear regression models, respectively. The difference between the observed and predicted values ranged from 22.56 to 61.08 fruit flies per trap for the ANN model and − 71.89 to 56.21 for the linear regression model, with positive and negative deviation values indicating the over- and under-prediction of the fruit fly trap catches, respectively.
Trend of the actual and predicted fruit fly trap catches using (A) QN-ANN and (B) linear regression

Discussion
Predicting population dynamics is the essential part of both research and the management of B. dorsalis. A good deal of work on forecast models of B. dorsalis has been done, especially using regression approaches (Shukla and Prasad, Reference Shukla and Prasad1985; Verghese and Sudhadevi, Reference Verghese, Sudhadevi, Verghese, Kumar and Parvatha Reddy1998; Verghese et al., Reference Verghese, Nagaraju, Madhura, Jayanthi and Sreedevi2006b; Hasyim et al., Reference Hasyim, Muryati and de Kogel2008; Kamala Jayanthi and Verghese, Reference Kamala Jayanthi and Verghese2011). The best-fit relationship with a reliability of 36% was obtained with the regression of trap catches and minimum temperature for B. dorsalis (Verghese and Sudhadevi, Reference Verghese, Sudhadevi, Verghese, Kumar and Parvatha Reddy1998). Further, the combination of minimum temperature and wind speed in the same study provided an inadequate coefficient of determination (13.6%) for predicting the fruit fly trap catch. A study in Indonesia has reported that regression models based on weather parameters, namely rainfall, number of rainy days and temperature, explained, respectively, 58, 38 and 23% variability in Bactrocera tau (Walker) trap catches (Hasyim et al., Reference Hasyim, Muryati and de Kogel2008). A stepwise regression of host plant phenology and weather variables could predict B. dorsalis trap catches by up to 78% (Kamala Jayanthi and Verghese, Reference Kamala Jayanthi and Verghese2011).
In the present study, a multilayer ANN (QN-ANN) trained by BP algorithms was developed to predict the fruit fly trap catch levels with a dataset of 14 input variables (weather and host plant phenology) resulting in a predictive performance of 92% (R 2). This may be due to a neural network that is an interconnected set of input/output units where each connection has a weight associated with it and can be ‘trained’ to recognize a distinct exact pattern in the input data that could maximize its predictive performance. Further, usually during the learning phase, the network learns by adjusting the weights to predict the call label of input samples during the testing phase (Rajat et al., Reference Rajat, Narayana, Krishna Reddy, Ranga Rao, Gowda, Reddy and Rama Murthy2003), enabling the neural networks to possess high tolerance to noisy data and to identify patterns on which they were not trained. The efficiency coefficient, E, widely used to evaluate the model was closer to unity, indicating a perfect fit. The scatter plot exhibited a perfect fit between the observed and predicted trap catches, showing the efficiency of the ANN predictive model (Affandi et al., Reference Affandi, Kunio and Haryadi2007).
The QN-ANN, a ‘black-box model’ for predicting the fruit fly trap catch, was designed to identify the connection between the input and output without going into the analysis of the internal structure of the physical process. Usually, the predicting success of the ANN depends on the selection of appropriate complexity levels that corresponds to the objectives of modelling and to the available data (Sharov, Reference Sharov, Korpilahti, Mukkela and Salonen1996).
Conclusion
The present study indicated that ANNs can be efficiently used to predict B. dorsalis trap catch levels, with simple limited time data making fruit fly prediction possible even in areas that lack huge historic datasets as an input model.
Acknowledgements
The authors are grateful to the Director, IIHR, Bangalore for providing facilities for carrying out this study. The authors duly acknowledge the constructive comments of the anonymous reviewers who helped to improve the manuscript.