Implications
This study demonstrates the feasibility of using a preference-based methodology – choice-experiment surveys – to assist with developing breeding objectives. The methodology can be used when traditional approaches such as profit equations and bio-economic models are not practical. It is important when the choice-experiment survey is being designed that the traits are specified in meaningful and realistic terms in the context of the production system of interest.
Introduction
In animal breeding programmes, there are often well-defined breeding objectives based on the relative economic importance of specific traits within a production system (e.g. Ponzoni, Reference Ponzoni1988; Amer and Fox, Reference Amer and Fox1992). Using traditional methods, economic weights (EWs) are derived using profit equations that take into account cost and revenue components in order to measure the effect of genetic changes on profit. The economic implications of a unit change determine the weighting applied in the economic breeding objective, which in turn influences the direction of genetic progress (Hazel, Reference Hazel1943). However, well-researched definitions of breeding objectives are less likely to be used in practice if they fail to reflect the perceptions of the breeders or commercial farmers for whom they are designed (Dekkers and Gibson, Reference Dekkers and Gibson1998). Traditional economic modelling often overlooks the indirect value of subjective traits that may contribute to profitability in production systems (Sölkner et al., Reference Sölkner, Grausgruber, Okeyo, Ruckenbauer and Wurzinger2008) and also traits linked to animal welfare and/or environmental impact (Nielsen et al., Reference Nielsen, Olesen, Navrud, Kolstad and Amer2011), which may influence farmers’ decisions (Olesen et al., Reference Olesen, Navrud and Kolstad2006) despite being difficult to define economically.
Recent approaches to deriving EWs for animal breeding programmes have used stated-preference techniques to elicit the preferences of consumers or farmers. In stated-preference experiments, participants are repeatedly asked to choose between two or more options at-a-time differentiated on a set of attributes (Caussade et al., Reference Caussade, Ortúzar, Rizzi and Hensher2005). This representation of options in terms of their characteristics for a set of attributes is consistent with Lancaster's theory of consumer demand, whereby consumers derive utility not from goods themselves but rather from their underlying attributes (Lancaster, Reference Lancaster1966). In the context of animal breeding, this approach involves analysing farmers’ preferences in terms of the benefits that they perceive will arise from changes in genetic traits (Tano et al., Reference Tano, Kamuanga, Faminow and Swallow2003).
For example, Wurzinger et al. (Reference Wurzinger, Ndumu, Baumung, Drucker, Okeyo, Semambo and Sölkner2006) and Tano et al. (Reference Tano, Kamuanga, Faminow and Swallow2003) used choice experiments to value cattle traits in Africa based on farmers’ preferences when production and price data were not readily available. Scarpa et al. (Reference Scarpa, Ruto, Kristjanson, Radeny, Drucker and Rege2003) estimated preference values for genetic traits in pastoralists’ cattle populations in Kenya that would be desirable for future breeding or conservation programmes. Sy et al. (Reference Sy, Faminow, Johnson and Crow1997) evaluated the preferences of parts of the Canadian beef production system for beef cattle characteristics, and von Rohr et al. (Reference von Rohr, Hofer and Kunzi1999) surveyed meat quality experts in Switzerland to derive estimates of price changes attributable to quality difference in pig carcasses. Common to all of these studies – and the present one – is the involvement of farmers and producers, thereby increasing industry engagement in the development of breeding programmes and better meeting farmers’ needs.
This article reports the results from choice-experiment surveys to capture the preferences of acknowledged experts and farmers from the Irish sheep industry with respect to the relative importance of target traits in the definition of a breeding objective. The surveys were conducted using internet-based software known as 1000Minds, which derives part-worth utilities (i.e. weights) representing the relative importance of the traits. The software was co-invented by the fourth author and is available for free for unfunded academic use via www.1000minds.com. From the part-worth utilities, measures representing the relative importance of the traits in economic value terms per unit change in each trait were calculated. These economic values were also compared with ones obtained from economically based breeding objectives for sheep in Ireland as recently estimated by the first author (Byrne et al., Reference Byrne, Amer, Fennessy, Cromie, Keady, Hanrahan, McHugh and Wickham2010). Such a comparison has not been reported in the literature before. Though the 1000Minds software used for the choice-experiment surveys has been used to estimate part-worth utilities for traits for breeding pasture plant species in Australia (Smith and Fennessy, Reference Smith and Fennessy2011), this study is the first application of the software to developing a breeding objective.
Material and methods
Survey design
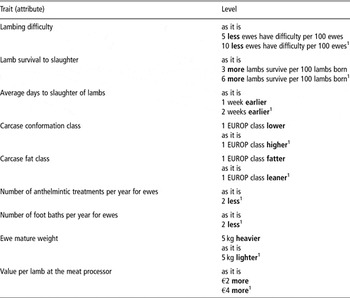
The traits to include in the choice-experiment surveys were informed by an economically based breeding objective for sheep in Ireland (Byrne et al., Reference Byrne, Amer, Fennessy, Cromie, Keady, Hanrahan, McHugh and Wickham2010). To ensure that only the most relevant traits were included in the survey, and that the traits were well defined, this initial specification was augmented and further refined after consulting with agricultural experts and experienced farmers, respectively (six and seven individuals each). The survey was also pilot-tested with them. Table 1 reports the final set of nine traits (or ‘attributes’) included in the survey, where each trait has two or three levels expressed as deviations from the current situation or base level (referred to as ‘as it is’) from each participant's personal point of view.
Traits included in the survey as attributes and their levels

1Highest ranked of the levels within the attribute.
The levels for each trait, and also their logical (or ‘natural’) ranking, were based on meaningful and realistic variations in trait performances consistent with the experience of experts and farmers in the context of the Irish production system. For example, 1 week of lamb growth amounts from 0.5 to 0.7 kg of carcase weight and is worth approximately €2 per lamb in gross economic terms. Similarly, three more lambs surviving per 100 lambs is equivalent to approximately €2 per lamb (€70 average gross value per lamb; Anonymous, 2008), where more lambs surviving corresponds to a higher-ranked (i.e. more desirable) level within that particular trait. In the absence of data on genetic variation in trait performance, the development of trait levels representing realistic differences is very important. On the basis of an assumed phenotypic standard deviation for ewe mature weight in Ireland of around 8 kg, differences between levels represent either an increase or decrease of approximately one-half of a phenotypic standard deviation. The trait levels for lambing difficulty represent decreases of one and two phenotypic standard deviations, respectively, and are therefore meaningful in the context of the Irish production system. This is equivalent to a maternal variance proportion (m 2) of 0.22 (Byrne et al., Reference Byrne, Amer, Fennessy, Cromie, Keady, Hanrahan, McHugh and Wickham2010) with a heritability of approximately 0.1.
A monetary attribute was included in the survey in the form of ‘value per lamb at the meat processor’. The use of a monetary attribute enables the part-worth utilities derived for the other attributes to be converted to, and expressed in, economic value terms. The levels for this trait were based on the estimated growth in lambs over an additional 1 or 2 weeks before slaughter (a factor for which the economic implications are likely to be well known by participants); in gross economic terms this represents €2 for 1 week or €4 for 2 weeks.
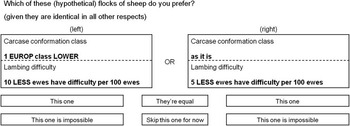
The 1000Minds software for implementing the choice-experiment surveys applies a method for deriving part-worth utilities known by the acronym PAPRIKA (Potentially All Pairwise RanKings of all possible Alternatives; Hansen and Ombler, Reference Hansen and Ombler2009). Other methods for deriving part-worth utilities are outlined by Belton and Stewart (Reference Belton and Stewart2002). In the present context, participants are asked repeatedly to choose between a pair of hypothetical sheep flocks with respect to which flock is more preferred. Each pair of flocks is defined in terms of just two traits at-a-time (i.e. a partial profile design) and such that participants are forced to confront a trade-off between the traits – that is, arising from one of the hypothetical flocks having a higher level on one trait and a lower level on the other trait than the other flock. Figure 1 shows an example of a choice question.
Example of a choice question for determining part-worth utilities.

Each participant continues answering questions until all possible questions involving two traits at-a-time have been answered. The number of such questions asked (and the burden on participants) is minimised because each time a question is answered, PAPRIKA (implemented via the software) eliminates all other possible questions that are implicitly answered as corollaries of those already answered (via the logical property of ‘transitivity’ – e.g. if flock ‘A’ is preferred to flock ‘B’, and ‘B’ is preferred to flock ‘C’, then, logically, ‘A’ must be preferred to ‘C’). This ensures that each participant's answers are consistent so that an overall ranking of all hypothetically possible flocks (i.e. all combinations of the attributes and levels) is defined. PAPRIKA represents each participant's answers as a system of inequalities and/or equalities defined in terms of variables corresponding to part-worth utilities (of as-yet-unknown value) where the inequalities represent answers involving strict preference for one of the hypothetical flocks presented in the choice question and the equalities represent answers involving indifference. PAPRIKA concludes by solving the system of inequalities and equalities to obtain the participant's part-worth utilities (representing the relative importance of the attributes to the participant). The part-worth utilities are expressed as percentages such that the ideal hypothetical flock (i.e. characterised by the highest-ranked levels on all traits) has a total utility of 100%, the sum of all the part-worth utilities (percentages) and the maximum hypothetically possible.
Survey participants
During August–September 2010, 24 acknowledged ‘experts’ (agricultural advisors, farmers, pedigree sheep breeders, scientists) from throughout Ireland were invited by email to participate in the internet-based survey. Their expert status was based on their involvement in the Irish sheep industry at the advisory or research level, in a breeding scheme (Byrne et al., Reference Byrne, Amer, Fennessy, Rohloff, Cromie, Donnellan, Potterton, Hanrahan and Wickham2009), or in the development of breeding objectives (Byrne et al., Reference Byrne, Amer, Fennessy, Cromie, Keady, Hanrahan, McHugh and Wickham2010). Sheep production in Ireland can be broadly separated into lowland and hill farming systems (Byrne et al., Reference Byrne, Amer, Fennessy, Cromie, Keady, Hanrahan, McHugh and Wickham2010) with different breeds farmed in each system (Hanrahan, Reference Hanrahan2008); therefore, each expert was asked to answer the survey as if he or she were first a lowland farmer and second a hill farmer. Of the 24 experts invited to participate, 19 completed the survey under the lowland scenario and 13 under the hill farming scenario.
In addition to the experts, a group of lowland farmers and a group of hill farmers were surveyed to assess whether, and to what extent, these two groups’ preferences differ from the experts’ preferences. The survey was administered in two separate meetings held during June–July 2010 in Portlaoise and Westport attended by 13 lowland and 12 hill farmers, respectively. At each meeting, the farmers came to a consensus answer for each choice question (e.g. see Figure 1) in the survey. Their preferences were elicited in group meetings rather than individually online (as for the experts) because most of them did not have reliable internet access.
Derivation of preference economic values (pEVs)
On the basis of the part-worth utilities derived from the survey, economic values for each of the traits – hereinafter referred to as pEVs – were calculated. The pEVs were calculated for each of the four groups referred to above, namely the experts who responded individually as (1) lowland farmers (n = 19) and (2) hill farmers (n = 13), respectively, and the consensus responses of the (3) lowland farmers and (4) hill farmers, respectively. For groups (1) and (2), the participants’ individual pEVs were also averaged across the group.
The pEV for each trait was calculated according to the relativity of the part-worth utilities for the attribute vis-à-vis the part-worth utilities for the attribute expressed in monetary terms in the survey, ‘value per lamb at the meat processor’ (Orme, Reference Orme2010). Thus, the pEV per flock was calculated to reflect a unit change in the trait relative to the current situation or base level according to this equation:

where for trait i and individual participant q, P is the part-worth utility for each level (i.e. 1, 2 or 1, 2, 3) within an attribute, α is the number of units represented in each attribute level and β is the monetary value per part-worth utility for individual q. Values for β were calculated as

where for individual participant q, Pmv is the part-worth utility for each attribute level for the monetary attribute and αmv is the number of units represented in each attribute level for the monetary attribute.
Equation (1) above can be easily understood by considering the following simple example. Suppose the part-worth utilities for the (non-monetary) attribute ‘average days to slaughter of lambs’ are: ‘as it is’ (α 1) = 0% (P 1qi), ‘1 week earlier to slaughter’ (α 2) = 8.5% (P 2qi) and ‘2 weeks earlier to slaughter’ (α 3) = 16.2% (P 3qi). And suppose the part-worth utilities for the (monetary) attribute ‘value per lamb at the meat processor’ are: ‘as it is’ (αmv 1) = 0% (Pmv 1q), ‘€2 more per lamb at the meat processor’ (αmv 2) = 10.1% (Pmv 2q) and ‘€4 more per lamb at the meat processor’ (αmv 3) = 19.7% (Pmv 3q). Applying equation (1) to the first attribute, it is possible to deduce that 3 weeks earlier to slaughter (1 week + 2 weeks) is worth 24.7% (8.5% + 16.2%), and thus 1 day earlier to slaughter is worth 1.18% (24.7%/21 days). Similarly for the second attribute, €6 (€2 + €4) is worth 29.8% (10.1% + 19.7%), and thus 1% is worth €0.20 (€6/29.8%). Given 1 day earlier to slaughter is worth 1.18% and 1% is worth €0.20, then the pEV for days earlier to slaughter can be calculated as being €0.23 per day earlier (i.e. 1.18 × €0.20).
For traits that are presented as either an increase or decrease in trait level relative to the current situation (e.g. ±5 kg change in ‘ewe mature weight’, ±1 ‘EUROP conformation class’), pEVs per flock were calculated as the summed part-worth utilities across levels, assuming the level within the attribute with the lowest value represents the zero point. For example, suppose the mean part-worth utilities for the attribute ‘carcase conformation class’ are: ‘1 EUROP conformation class lower’ (α 1) = 0% (P 1qi), ‘as it is’ (α 2) = 2.6% (P 2qi) and ‘1 EUROP conformation class higher’ (α 3) 3.4% (P 3qi). The trait levels represent three conformation classes; ‘as it is’ represents a deviation of one class from ‘1 EUROP conformation class lower’, and ‘1 EUROP conformation class higher’ represents a deviation of two classes from ‘1 EUROP conformation class lower’. Therefore, for the attribute ‘carcase conformation class’, three conformation classes is worth 6.0% (2.6% + 3.4%), and thus one class is 2.0% (6.0%/3 days). From the part-worth utilities for ‘value per lamb at the meat processor’ noted earlier, we already know that €6 (€2 + €4) is worth 29.8% (10.1% + 19.7%) and thus 1% is worth €0.20 (€6/29.8%). Therefore, the mean pEV for carcase conformation class can be calculated as €0.40 per class (2.0 × €0.20).
Economic modelling changes
Economic values for foot rot, faecal egg count (FEC) and lambing difficulty derived by Byrne et al. (Reference Byrne, Amer, Fennessy, Cromie, Keady, Hanrahan, McHugh and Wickham2010) – hereinafter referred to as ‘bio-economic model economic values’ (EVs) – were re-calculated so that they are comparable with the pEVs. Byrne et al. (Reference Byrne, Amer, Fennessy, Cromie, Keady, Hanrahan, McHugh and Wickham2010) derived an EV for changes in the incidence of foot rot; so that it could be compared with the pEVs for the number of foot baths per year for ewes, the EV for foot rot was converted to units per foot bath, assuming the number of foot baths was an indicator of prevalence. This equated to a cost of €0.60 per foot bath per ewe.
An EV for the number of anthelmintic treatments has not been reported for the Irish sheep industry, although EVs have been calculated for FEC (Byrne, T.J., unpublished results), which account for the impact of FEC on production performance. The EV of adult FEC is −€0.010 per 1% increase in FEC. Assuming that an increase of one-half of a phenotypic standard deviation in FEC (43%, based on phenotypic variance of 7400%; Byrne, T.J., unpublished results) increases requirements by one treatment per ewe per year, the economic value per anthelmintic treatment can be calculated as being −€0.43 (i.e. €0.010 × 100 × 43%).
Byrne et al. (Reference Byrne, Amer, Fennessy, Cromie, Keady, Hanrahan, McHugh and Wickham2010) reported EVs for lambing difficulty for single-bearing and multiple-bearing ewes as separate traits, with the EV for multiple-bearing ewes adjusted so it was presented in terms of per lamb born. The EV for lambing difficulty in multiple-bearing ewes was multiplied by the average number of lambs born in a litter of multiples such that it was presented per ewe with lambing difficulty (as in our survey). For pEVs to be comparable with EVs for lambing difficulty, the lambing difficulty economic value was taken as the average EV for singles and multiples (Byrne et al., Reference Byrne, Amer, Fennessy, Cromie, Keady, Hanrahan, McHugh and Wickham2010) weighted by the proportion of ewes in flocks having singles and multiples:

where Ps is the proportion of single-bearing ewes (0.52), EVsg is the economic value for lambing difficulty in single-bearing ewes (−0.25), Pm is the proportion of multiple-bearing ewes (0.48), EVmt is the economic value for lambing difficulty in multiple-bearing ewes (−0.13) and Nm is the average number of lambs born in a litter of multiples (2.04).
Comparison of pEVs and EVs
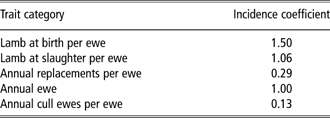
The EVs (Byrne et al., Reference Byrne, Amer, Fennessy, Cromie, Keady, Hanrahan, McHugh and Wickham2010) are calculated per unit change in each trait per animal. They are converted to EWs by applying discounted genetic expression (DGE) coefficients (McClintock and Cunningham, Reference McClintock and Cunningham1974), where DGE coefficients quantify the aggregate contribution to farm profit from expressions of the sires’ genes per lamb born, accounting for the timing and frequency of expression for different traits. Owing to the way the questions were expressed in the survey, pEVs are reported per unit change in the trait on a per flock basis and assumed to occur instantaneously; hence, they are not directly comparable with EVs reported by Byrne et al. (Reference Byrne, Amer, Fennessy, Cromie, Keady, Hanrahan, McHugh and Wickham2010). Therefore, bio-economic incidence coefficients were derived to scale EVs based on the frequency of expression of traits in a flock in a year per ewe, thereby allowing for the EVs to be compared with the pEVs calculated in this study. The EVs were scaled by bio-economic incidence coefficient to calculate incidence-adjusted bio-economic model economic values (mEVs), such that

where for trait i, EV is the un-scaled EV and k is the bio-economic incidence coefficient representing the trait category for trait i (Table 2).
Bio-economic incidence coefficients for the scaling of economic values to a flock level per ewe

For example, the EV for the trait ‘lamb survival to slaughter’ is in the units of per lamb born (per ewe) that survives to slaughter (Byrne et al., Reference Byrne, Amer, Fennessy, Cromie, Keady, Hanrahan, McHugh and Wickham2010). However, on a flock basis in Ireland, the average number of lambs born per ewe is 1.50. Similarly, the EV for ‘days to slaughter’ is reported in the unit of days per lamb, where in Ireland 1.06 lambs are slaughtered per ewe. The flock bio-economic incidence coefficients applied to each of the trait groups are presented in Table 2.
As an example of the application of bio-economic incidence coefficients, an increase in ewe mature weight is expected to have an economic impact on three aspects of the production system: higher annual maintenance-feed requirements for the ewe, higher feed requirements for growing and maintaining the replacement female and a heavier carcase weight for the cull ewe (Byrne et al., Reference Byrne, Amer, Fennessy, Cromie, Keady, Hanrahan, McHugh and Wickham2010). The economic implication of each of these components is calculated, with each component being multiplied by the respective bio-economic incidence coefficient. This allowed the mEV (adjusted for bio-economic incidence) of ewe mature weight (accounting for all economic components) to be compared with the single pEV assigned to ewe mature weight by survey participants. It is also of interest to compare EWs as computed by Byrne et al. (Reference Byrne, Amer, Fennessy, Cromie, Keady, Hanrahan, McHugh and Wickham2010) with comparable EWs derived using preference methods. This was achieved using the formula:

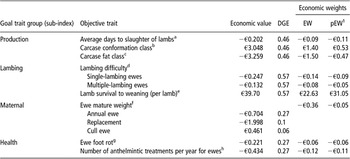
Thus, the preference economic weight (pEW) is adjusted by accounting for the relativity between the directly comparable pEVs and the EVs after they have been adjusted by the incidence coefficients (mEV). Table 5 compares the breeding objective derived using bio-economic EVs (un-scaled), DGE coefficients and EWs as reported by Byrne et al. (Reference Byrne, Amer, Fennessy, Cromie, Keady, Hanrahan, McHugh and Wickham2010), with corresponding weights that can be formulated using the average preference survey results from all surveyed groups. The traits are separated into four sub-indices.
Statistical analysis
Two sets of means and standard deviations of the experts’ part-worth utilities for each trait were calculated from the survey (as lowland farmers (n = 19) and as hill farmers (n = 13)). Three (null) hypotheses were tested using t-tests. First, under both the expert lowland and hill farming scenarios that, for each trait, the part-worth utility is statistically the same as would be obtained if all traits were of equal importance. Second, that the mean pEV for each trait under the lowland and hill farming scenarios is statistically the same, and that the mean pEV from the experts for each trait is statistically the same as the farmer group consensus pEVs (this requires assumptions regarding the variance structure of the consensus data). Third, that the mean pEVs for each trait under the expert lowland or hill farming scenarios and the scaled mEV are statistically the same (this addresses the issue of whether the traits in the choice-experiment surveys were accorded greater or lesser importance than equivalent measures obtained from bio-economic models).
Results
Survey process
The choice survey took the experts approximately 18 min each to complete and required them to answer an average of 47 choice questions each. Participants reported that they found the task easy, although several commented that the questions seemed repetitive. The two meetings of the lowland and hill farmers in which the survey was administered to the group lasted approximately 90 to 120 min. Each meeting began with the survey task being explained to the farmers and as the meeting proceeded the farmers came to a consensus for each choice question, usually after discussing it.
The experts’ part-worth utilities
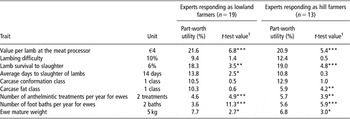
The mean part-worth utilities and the t-test results from testing for each trait assuming that the part-worth utility is statistically the same as would be obtained if all traits were of equal importance (i.e. 100% divided by the number of traits) are reported in Table 3. With respect to the first hypothesis, ‘value per lamb at the meat processor’ and ‘lamb survival to slaughter’ were the two most important traits for the experts under both the lowland and hill farming scenarios – their part-worth utilities were significantly greater than for the other traits. In contrast, ‘number of foot baths per year for ewes’, ‘number of anthelmintic treatments per year for ewes’ and ‘ewe mature weight’ were relatively unimportant. ‘Average days to slaughter of lambs’ was much more important under the lowland scenario than the hill farming scenario; ‘carcase fat class’ was relatively unimportant under the hill farming scenario compared with the lowland scenario.
Mean part-worth utilities and t-test results for each trait for experts responding as lowland and hill farmers, respectively

*P < 0.05, **P < 0.01, ***P < 0.001.
1For the null hypothesis that each trait's part-worth utility is equal to the value that would be obtained if all traits were of equal importance (i.e. 100%/9 = 11.1%).
pEVs
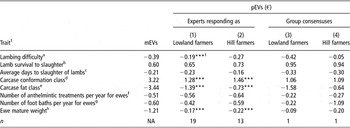
The mEVs and mean pEVs for each trait for the four surveyed groups are in Table 4. With respect to the second hypothesis (t-test results are not reported but are available on request), the mean pEVs obtained from the experts responding as lowland and hill farmers, respectively, were significantly different only for ‘carcase fat class’. The comparisons between experts and farmers necessitate the assumption that the same variance structure applies to both groups. Compared with the experts responding as lowland farmers, the pEVs for (actual) lowland farmers were significantly different for ‘lambing difficulty’, ‘lamb survival to slaughter’, ‘average days to slaughter of lambs’, ‘number of foot baths per year for ewes’, ‘number of anthelmintic treatments per year for ewes’ and ‘ewe mature weight’. Compared with the experts responding as hill farmers, the pEVs for hill farmers were significantly different for ‘lambing difficulty’, ‘average days to slaughter of lambs’ and ‘number of foot baths per year for ewes’.
Mean pEVs for each trait for the four surveyed groups and mEVs (derived from Byrne et al. (Reference Byrne, Amer, Fennessy, Cromie, Keady, Hanrahan, McHugh and Wickham2010) and adjusted with incidence coefficients)

pEVs = ‘preference economic values’; mEVs = incidence-adjusted bio-economic model economic values.
aPer 1% increase in percentage of ewes requiring assistance.
bPer 1%.
cPer day.
dPer EUROP conformation class.
ePer EUROP fat class.
fPer treatment.
gPer bath.
hPer kg.
1Asterisks denote results from t-tests for the null hypothesis that the mEV and the identified pEV are statistically the same (*P < 0.05, **P < 0.01, ***P < 0.001). It is not possible to perform these tests with respect to the pEVs from the group consensuses because there is only one observation (unlike from the surveyed experts). For the same reason it is also not possible to compare pEVs between the farmers groups
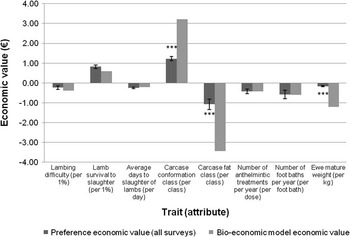
With respect to the third hypothesis tested, the pEVs for ‘carcase conformation class’ obtained from the experts responding as lowland and hill farmers, respectively, were significantly lower than the mEV, whereas the pEVs for ‘carcase fat class’ and ‘ewe mature weight’ under both scenarios were higher (less negative) than the mEVs. In addition, for ‘lambing difficulty’ the pEV under the lowland scenario (but not the hill farming scenario) was significantly higher (less negative) than the mEV. Mean pEVs (across all four surveyed groups) for each trait and mEVs (adapted from Byrne et al., Reference Byrne, Amer, Fennessy, Cromie, Keady, Hanrahan, McHugh and Wickham2010) are presented in Figure 2. On the basis of the combined survey results, the mEVs, and hence EW (Table 5), are inflated for ‘carcase conformation class’, ‘carcase fat class’ and ‘ewe mature weight’.
Average preference economic values (pEVs, across all surveyed groups) and incidence-adjusted bio-economic model economic values (mEVs) for each trait.

Summary of breeding objective traits in sub-indices, expressed as EWs derived by Byrne et al. (Reference Byrne, Amer, Fennessy, Cromie, Keady, Hanrahan, McHugh and Wickham2010) and pEW in the units: expressions of the sires’ genes per lamb born

EWs = economic weights; pEWs = preference economic weight; DGE = discounted genetic expression.
aPer day.
bPer EUROP carcase conformation class.
cPer EUROP carcase fat class.
dPer 1% increase in the percentage of ewes requiring moderate assistance or worse.
ePer lamb surviving to slaughter.
fPer kg of mature weight.
gPer 1% increase in ewes with a foot class greater than zero.
hPer anthelmintic treatment per ewe.
1Calculated based on equation (5).
Discussion
This study used 1000Minds software to capture the preferences of experts and farmers from the Irish sheep industry with respect to the relative importance of target traits in the definition of a breeding objective. By converting the part-worth utilities from the choice-experiment surveys to pEVs, the relative importance of the traits in economic value terms per unit change in each trait was revealed. The results suggest that participants assess the value of several traits, including carcase conformation, carcase fat and ewe mature weight, differently from those calculated using bio-economic models (Byrne et al., Reference Byrne, Amer, Fennessy, Cromie, Keady, Hanrahan, McHugh and Wickham2010).
Comparison of the expert pEVs for traits
Sy et al. (Reference Sy, Faminow, Johnson and Crow1997) propose that utility is a function of various factors including the characteristics of the product (in general terms), the participant's socio-economic background and the interaction between these two groups of variables. Hence it might be expected that part-worth utilities, and therefore pEVs, for traits would differ when the surveyed experts responded either as lowland or hill farmers. Yet, with the exception of ‘carcase fat class’, statistically significant differences between mean pEVs under the two scenarios were not found (Table 4). With little difference in pEVs, the use of one set of pEVs to develop a breeding objective to accommodate both lowland and hill sectors of the industry is feasible. This is not surprising given that the realised economic response to selection using an index has been shown to be robust in the face of large changes in economic values (Vandepitte and Hazel, Reference Vandepitte and Hazel1977; Smith, Reference Smith1983).
The significantly lower pEV for improvement in fat class (i.e. towards leaner animals) by hill farmer experts is probably because hill breeds tend to deposit less fat in the carcase than lowland breeds (Kempster, Reference Kempster1981), and so hill farmers are unlikely to be penalised for over-fatness in their slaughter lamb prices. It is likely, based on a perception that carcase fatness is positively linked with robustness, that hill farmers would prefer their sheep to be fatter (McHugh, M.P., personal communication).
Converting part-worth utilities into pEVs
The arbitrariness in the scaling of part-worth utilities can be eliminated by expressing them in monetary terms (Orme, Reference Orme2010). In the context of the present choice-experiment surveys, this required at least one attribute to be expressed in monetary units, as a difference between two attribute levels. This enabled the part-worth utilities to be converted into pEVs. Only one monetary attribute was included in the survey; however, it is possible that if others had been included they might not have received the same weighting per euro, depending on the factors (e.g. direct and indirect, monetary and non-monetary) associated with changing that particular monetary attribute. Hence, there is potential value in including several monetary attributes in order that the variation in weightings given to monetary traits and the implications for calculating economic values for all other traits can be explored.
The derivation of EWs in breeding objectives requires that differences in the timing and frequency of expression of different traits be accounted for (e.g. McClintock and Cunningham, Reference McClintock and Cunningham1974). Nielsen and Amer (Reference Nielsen and Amer2007) argued that the application of discounted gene-flow principles to breeding objectives in survey-based methods depends explicitly on how the questions are asked. Participants in the present surveys were asked: ‘Which of these (hypothetical) sheep flocks do you prefer?’ (see Figure 1). This question assumes that the implication of the required choice between the pairs of hypothetical sheep flocks occurs instantaneously to the participant. This approach leaves the application of discounted gene-flow principles as a post-survey process, rather than requiring survey participants to implicitly account for the differences when making choices.
A potential issue with choice-based approaches for the derivation of economic values is that participants can confound the economic implications of changes in a trait with the level of genetic variation for the trait. An example of confounding may be provided by comparing pEVs for ‘lambing difficulty’. Although the economic implications of lambing difficulty in hill environments are likely to be greater (McHugh, M.P., personal communication), hill farmers assigned a lower (less negative) pEV to ‘lambing difficulty’ than lowland farmers. This is in contrast to expert responses for ‘lambing difficulty’ (Table 4). However, the assumption of equivalent variance structure in the hypothesis test means that firm conclusions about the level of confounding cannot be drawn. The calculation of economic values in a breeding objective should focus on the economic implications of changes in the trait rather than on the genetic variation in the trait (Harris, Reference Harris1970); therefore, this confounding phenomenon may present a challenge to the use of preference-based methods for calculating economic values.
Historically in Ireland, breed improvement has focused on a limited range of growth and carcase traits (Byrne et al., Reference Byrne, Amer, Fennessy, Rohloff, Cromie, Donnellan, Potterton, Hanrahan and Wickham2009), and therefore the focus of commercial farmers has likely been on improving these terminal traits. Inflated mEVs for carcase conformation and carcase fat traits when compared with pEVs possibly arise because in the Irish lamb production system farmers put a low value on carcase quality traits. The reality is that procurement issues often over-ride payment schedules related to carcass quality (even though payment schedules are advertised) and a proportion of farmers tend to be paid on the basis of carcass weight only. Therefore, improvements in carcase quality may be regarded as being of lower priority than suggested by the EVs.
The significant difference between the pEV and mEV for ‘ewe mature weight’ may represent one, or perhaps a combination of two, aspect(s) related to how participants interpreted the trait. First, the real costs of increasing ‘ewe mature weight’ depend on the relative cost of feed at different times of the year: if feed supply is limiting, the greater is the cost and it is possible that farmers do not account for the cost associated with raising replacements to different mature weights. In this respect, at the time of the study Irish farmers were receiving very high prices for ewe carcasses relative to prices in the recent past (Murphy, Reference Murphy2010), which may have influenced their choices in the survey. Second, the requirement when developing a breeding objective is that economic values are calculated as partial economic values (Hazel, Reference Hazel1943). Large ewe mature size is positively genetically correlated with litter size and lamb growth rate, and this positive association could be recognised by sheep farmers and influence their preference for ewe mature size. Although the survey question included the caveat that the two hypothetical flocks under consideration were ‘identical in all other respects’ (see Figure 1), the observed differences between the pEV and mEV for ‘ewe mature weight’ may reflect participants’ valuation of traits based on their implicit (or explicit) knowledge of correlated traits. This suggests that caution is required when using choice experiments to formulate EVs for traits in which farmers are expected to struggle to identify independent consequences of genetic changes.
Comparison of breeding objectives
The questions presented assumed that the implications of choices are instantaneous and are incurred at the flock level. However, the EVs (from bio-economic models) required the application of bio-economic incidence coefficients to ensure correct units for comparison with pEVs. By accounting for the relativity between the directly comparable pEVs and mEVs, the change in emphasis of the breeding objective can be observed (Table 5). Although Nielsen and Amer (Reference Nielsen and Amer2007) alluded to the importance of considering aspects related to the timing and frequency of expression of traits (McClintock and Cunningham, Reference McClintock and Cunningham1974), the implications of this on the weightings of traits in breeding objectives derived by preference-based methods seem to have been ignored. Tano et al. (Reference Tano, Kamuanga, Faminow and Swallow2003) developed surveys, which included bull and cow traits, but did not take into account the different timing and frequency of expression of the traits in the analysis, and hence it would be unlikely that accurate weightings for traits in a breeding objective context could be derived. Scarpa et al. (Reference Scarpa, Ruto, Kristjanson, Radeny, Drucker and Rege2003) stated that choice-experiment estimates appear to be sufficiently precise for estimating values for cattle traits that are relevant in market transactions. However, in terms of developing economic indexes, which allow for the ranking of selection candidates, the marginal values reported by Scarpa et al. (Reference Scarpa, Ruto, Kristjanson, Radeny, Drucker and Rege2003) are not relevant, as they do not account for the timing and frequency of trait expression.
Study technique and methodology
The most critical aspect of the survey process was the specification of the survey itself; it was particularly important that participants were presented with realistic alternatives (hypothetical sheep flocks) with respect to trait variation (defined in terms of two traits at-a-time) to choose between. In this respect, prior consultation with industry experts and pilot-testing of the survey proved to be very useful for specifying relevant and well-defined attributes and levels. Carson et al. (Reference Carson, Louviere, Anderson, Arabie, Bunch, Hensher, Johnson, Kuhfeld, Steinberg, Swait, Timmermans and Wiley1994) argues that a lack of sufficient variation in the levels exhibited by an attribute in actual (i.e. observed) market data is one of the main reasons for using choice experiments, as such variation can be controlled in preference-based surveys. In an animal breeding context, Edel and Dempfle (Reference Edel and Dempfle2006) commented that when using contingent valuation (a technique for eliciting how much respondents would be willing to pay for things not usually traded in markets) the description of the setting should be as realistic and familiar as possible. This was achieved in this study by including meaningful and realistic trait variations based on the experiences of Irish farmers. The initial version of the survey that was pilot-tested included an attribute for either ‘number of lambs born’ (NLB) or ‘number of lambs weaned’ (NLW). The pilot survey revealed that most participants considered NLB and NLW to be the same trait – even though they are distinctly different. Therefore, in the interests of ensuring unambiguous trait definitions, and also to limit the number of questions asked of participants, neither trait was included in the final survey.
A survey-based approach should present participants with sufficient choice tasks to ensure that their preferences are adequately captured. However, too much information (Tano et al., Reference Tano, Kamuanga, Faminow and Swallow2003) may cause participants to simplify the evaluation process by ignoring attributes they consider to be less important (Green and Srinivasan, Reference Green and Srinivasan1990; Nielsen and Amer, Reference Nielsen and Amer2007). These cognitive heuristics can lead to biased estimates of part-worth utilities whereby the most important attributes are over-stated and the least important attributes are under-stated (Orme et al., Reference Orme, Alpert and Christensen1997). Partial profile designs, in which a sub-set of the full set of attributes are presented to participants at each choice, were evaluated by Nielsen and Amer (Reference Nielsen and Amer2007) because they reduce the cognitive burden on participants. Chrzan and Elrod (Reference Chrzan and Elrod1995) and Orme et al. (Reference Orme, Alpert and Christensen1997) found that part-worth utilities estimated from partial profile designs had less variation than those obtained from full profile designs. The 1000Minds software used a partial profile design – whereby the pairs of hypothetical sheep flocks that participants were asked to choose between were defined in terms of just two traits at-a-time.
Another important aspect for the interpretation of the data concerns the nature of the choice task itself. Scarpa et al. (Reference Scarpa, Ruto, Kristjanson, Radeny, Drucker and Rege2003) and Tano et al. (Reference Tano, Kamuanga, Faminow and Swallow2003) also used a choice methodology in which participants were selected from pairs of alternatives; however, participants were either surveyed via interviews or by selecting descriptive cards. Though useful (especially in a developing country context), such preference-elicitation methods are likely to be inefficient with respect to collecting information as they are not adaptive to participants’ responses as the survey progresses. In contrast, the PAPRIKA method employed by 1000Minds fully exploits the logical property of ‘transitivity’ to eliminate all possible questions that are implicitly answered as corollaries of each question answered (Hansen and Ombler, Reference Hansen and Ombler2009). This ensures that the number of questions asked (and the burden on participants) is minimised and that each participant's answers are consistent. As with this study, Toubia et al. (Reference Toubia, Simester, Hauser and Dahan2003) customised each choice task using adaptive conjoint analysis, with the aim of reducing the number of potential choice decisions. As well as being the simplest type of measurement possible (Stevens, Reference Stevens1946), the advantage of choosing between just two alternatives at a time (hypothetical sheep flocks in this study) relative to other elicitation methods, which usually rely on scaling or ratio measurements of participants’ preferences (Sy et al., Reference Sy, Faminow, Johnson and Crow1997), is that the decision-maker is required to confront explicit trade-offs between alternatives and make choices.
Conclusion
The original motivation for this study was to ascertain whether, and to what extent, acknowledged experts and farmers from the Irish sheep industry considered aspects of trait performance, associated with trait change, other than those rationalisable strictly in terms of monetary benefits or costs (calculated using bio-economic models).
The study has demonstrated the feasibility of using a preference-based methodology – choice-experiment surveys – to assist with developing breeding objectives. The methodology can be used when traditional approaches such as profit equations and bio-economic models are not practical. It is important when the choice-experiment survey is being designed that the traits are specified in meaningful and realistic terms in the context of the production system of interest.
Acknowledgements
Funding support for this study was provided by Sheep Ireland and the Irish Cattle Breeding Federation Society Ltd from the National Development Plan, administered through the Irish Department of Agriculture, Fisheries and Food. The authors would like to thank members of the Irish sheep industry who took part in this study.