Introduction
Generally, there is a close relationship between herbivores and their host plants, influencing nearly all aspects of an herbivores’ biology, from behavior, nutrition, development and growth (Whitman, Reference Whitman, Chapman and Joern1990; Unsicker et al., Reference Unsicker, Franzke, Specht, Köhler, Linz, Renker, Stein and Weisser2010; Cease et al., Reference Cease, Elser, Ford, Hao, Kang and Harrison2012), distribution, population dynamics and avoiding natural enemies (Rominger et al., Reference Rominger, Miller and Collins2009; Franzke et al., Reference Franzke, Unsicker and Specht2010; Zhang & Fielding, Reference Zhang and Fielding2011). For herbivores, plant availability and quality are believed to be among the most influential extrinsic conditions (Pérez et al., Reference Pérez, Díaz, Vendramini, Cornelissen, Gurvich and Cabido2003; Ibanez et al., Reference Ibanez, Manneville, Miquel, Taberlet, Valentini, Aubert, Coissac, Colace, Duparc, Lavorel and Moretti2013). When making host choices, herbivorous insects have well-defined nutritional requirements in terms of carbohydrates, protein, water intake or other elements (Simpson et al., Reference Simpson, Sibly, Lee, Behmer and Raubenheimer2004; Raubenheimer & Simpson, Reference Raubenheimer and Simpson2004; Behmer, Reference Behmer2009), and consequently have developed an advanced feeding process that allow them to both taste and learn to accurately choose their diet (Powell et al., Reference Powell, Tosh and Hardie2006). When confronted with plant, they can detect different host plants and select the optimal quality and less toxic plants as their foods (Bernays & Chapman, Reference Bernays and Chapman1994; Unsicker et al., Reference Unsicker, Oswald, Kohler and Weisser2008), then showed marked preferences for certain plant species (Bernays & Chapman, Reference Bernays and Chapman1994; Pérez et al., Reference Pérez, Díaz, Vendramini, Cornelissen, Gurvich and Cabido2003).
Herbivorous insects typically have a narrow range of host plants, with 80–90% considered to be more specialized, with 10–20% classified as generalists (Schoonhoven et al., Reference Schoonhoven, van Loon and Dicke2005). Generalist species can feed on plants belonging to phytochemically unrelated families, whereas specialist species utilize only plant species within a single family or a single genus (Schoonhoven et al., Reference Schoonhoven, van Loon and Dicke2005; Ali & Agrawal, Reference Ali and Agrawal2012; Roy et al., Reference Roy, Walker, Vogel, Chattington, Larsson, Anderson, Heckel and Schlyter2016). Generalist are usually more sensitive to plant defense compounds, whereas specialist herbivores may use these same compounds as recognition cues (known as token stimuli) (Scriber, Reference Scriber2002; Gols et al., Reference Gols, Bukovinszky, van Dam, Dicke, Bullock and Harvey2008). While specialists can utilize selected plants as food and exploit such chemicals for their own defense, generalists show reduced survival or growth rate on such plants (Hopkins et al., Reference Hopkins, van Dam and van Loon2009; Ali & Agrawal, Reference Ali and Agrawal2012; Roy et al., Reference Roy, Walker, Vogel, Chattington, Larsson, Anderson, Heckel and Schlyter2016). Generally, selection of suitable hosts leads to higher fitness (Simpson et al., Reference Simpson, Sibly, Lee, Behmer and Raubenheimer2004; Powell et al., Reference Powell, Tosh and Hardie2006; Franzke et al., Reference Franzke, Unsicker and Specht2010), which may lead to pest population outbreaks (Cease et al., Reference Cease, Elser, Ford, Hao, Kang and Harrison2012). Understanding the relationships between herbivores and their host plants is not only useful for determining basic insect nutritional and general ecology, but is important for understanding species distribution (Huang et al., Reference Huang, MacNeill and Zhang2016), which in turn can aid the monitoring of pest occurrence and the selection of appropriate control management techniques for specific pest species.
In this paper, we studied the biological and ecological relationship between the grasshopper, Oedaleus asiaticus B. Bienko (Orthoptera: Acrididae: Oedipodinae) and its host plants. O. asiaticus is a grass-feeder with marked preferences for Poaceae plants, and a dominant grasshopper in North-Asian grasslands (Cease et al., Reference Cease, Elser, Ford, Hao, Kang and Harrison2012; Zhang et al., Reference Zhang, Elser, Cease, Zhang and Yu2014). Outbreaks often result in significant loss in grasses and economic disruption to farming operations (Liu et al., Reference Liu, Zhuang and Guo2006; Cease et al., Reference Cease, Hao, Kang, Elser and Harrison2010). For example, an outbreak of O. asiaticus in 1999 affected almost 6 million hectares of grassland in Inner Mongolian, with population densities of >1000 grasshoppers m−2 recorded during an outbreak in 2002 (Wang, Reference Wang2004). Previous studies of grasshoppers’ food intake also showed that O. asiaticus outbreak populations can consume 199.37 kg ha−1 of fresh forage annually when population densities reached 11.2 individuals m−2, with approximately 15% of the aboveground plant biomass lost through feeding (Liu et al., Reference Liu, Wang, Wang, Han, Wang and Hao2013).
From the routine survey of plants and grasshopper composition in Stipa (Stipa krylovii)- and Leymus (Leymus chinensis)-dominated grassland (both representative of the Eurasian steppe grassland) (Han et al., Reference Han, Zhang, Wang, Bai, Wang, Han and Li2008), we found O. asiaticus was mainly confined to the former. In this paper, we hypothesized that S. krylovii, contributes to the optimal growth performance and population distribution of the grasshopper O. asiaticus. Therefore, a series of studies were carried out over 6 years to understand further the potential drivers to these observations and confirm the hypothesis.
Materials and methods
Study site
The research site (43.968°N, 115.821°E) was located in the Xilin Gol League, Inner Mongolia, northeast China, a region representative of the Eurasian steppe grassland and characterized by Leymus-and Stipa-dominated plant communities (Han et al., Reference Han, Zhang, Wang, Bai, Wang, Han and Li2008). Vegetation at the study site is dominated by S. krylovii and L. chinensis (Trin.) Tzvelev, with the above-ground biomass of these two species accounting for more than 80% of the total community production (Huang, Reference Huang2015). Other common species found in this grassland include the perennial bunchgrass Cleistogenes squarrosa (Trin.) Keng, (Poales: Poaceae), the shrub Caragana microphylla Lam (Fabales: Fabaceae) the perennial subshrub Artemisia frigida Willd. (Asterales: Asteraceae). The leaves of those five plants are perceptibly different. Artemisia frigida has lobed gray-green leaves, which are coated in silky white hairs, C. microphylla possesses a pinnately compound leaf, and the three Poaceae plants are all leptophyllous but with distinct morphology on the leaf blade.
Rapid steppe degradation has led to reduced biodiversity, decreased productivity and, in some cases, desertification attributed especially due to livestock over-grazing (Chen & Wang, Reference Chen and Wang2000; Han et al., Reference Han, Zhang, Wang, Bai, Wang, Han and Li2008). In this partially degraded area, plants covered only 30–40% of the ground area with remainder being bare ground. Fifty-nine grasshopper species have been recorded from this area, but during June and July three species: Oedaleus asiaticus B. Bienko, Calliptamus abbreviatus Ikonn and Dasyhippus barbipes (Fischer-Waldheim) (all Orthoptera: Acrididae), comprise >80% of all grasshopper species (Guo et al., Reference Guo, Li and Gan2006). These three species overwinter as eggs, and generally hatch between late-May and late-June, reaching adulthood between early to late July (Lu et al., Reference Lu, Yu, Zhang, Zhang and Long2005; Huang et al., Reference Huang, MacNeill and Zhang2016). Oedaleus asiaticus B. Bienko feeds on Poaceae species, particularly L. chinensis, S. krylovii and C. squarrosa (Wu et al., Reference Wu, Xu, Cao, Gexigedu, Liu, He, Ererdengba and Wang2012; Zhang et al., Reference Zhang, He, Cao, Zhang, Wu, Liu and Wang2013). These three grass species are important components of the Xinli Gol grassland ecosystem, serving to provide habitats for insects and many other animals (Huang, Reference Huang2015).
Survey of plant and grasshopper composition in Stipa-dominated and Leymus-dominated grassland
We selected a Stipa- and Lemus-dominated grassland in a grazed grassland area, respectively, to carry out the composition study. For each grassland, a 1 km2 plot was delimited (~5 km apart) on mid-July 2010 and 2011. In each plot, the plants within randomly selected five 1-m2 quadrats (~50 m apart) were cut to ground level and each species in each quadrat placed separately into envelopes, dried at 90°C for 24 h, then weighed. Above-ground biomass (g m−2) of different plant species for the five samples were averaged from each plot.
Sweep-net sampling was also used to estimate the relative density of the grasshopper species in each of our two plots on mid-July, 2010 and 2011. For each plot, we started at the center, then walked 500 m in each of the four cardinal directions, and conducted a standard sample of 100 sweeps with a 40-cm diameter sweep net. We recorded all grasshoppers collected from each of the four directions, and averaged the four samples in each plot, to derive a relative grasshopper density (number of individuals per 100 sweep-nets) for each of the two plots.
Large-scale survey of plant biomass and O. asiaticus density on grazed grassland
We examined the relationship between O. asiaticus density and above-ground plant biomass composition in a grazed grassland area, in mid-July for each year from 2011 to 2014. Each year, we selected eight 1 km2 sample plots (~30 km apart). In each sample plot, the plant and grasshopper collection and processing was the same as described above. Five dried samples and four O. asiaticus relative densities were averaged for each plot, to produce eight means (one for each of the eight 1 km2 plots), for each year from 2011 to 2014.
Field cage study of O. asiaticus growth performance in Stipa-dominated and Leymus-dominated grassland
Over 4 years (July–August of 2012–15), a field study was conducted to compare O. asiaticus growth performance on Stipa- and Leymus-dominant plant communities. Near the end of June of each year, ten cages (1 × 1 × 1 m3) were constructed over either Stipa- or Leymus- plant communities (five cages per site) using iron rod frames covered with fine 1 mm2 cloth mesh. We removed spiders and other natural enemies from the field cages before adding female fourth instar O. asiaticus. The mesh covering the cages reduced wind flow and sunlight equally, therefore impacts on plant growth amongst cages and treatments were considered minimal, as was found in previous studies (e.g., Cease et al., Reference Cease, Elser, Ford, Hao, Kang and Harrison2012).
O. asiaticus were field collected from both Stipa and Leymus dominant grasslands and randomly assigned to the ten cages (16 individuals per cage). Because the gender of the early instars is difficult to identify, 4th instar female individuals were selected based on external morphology of the reproductive system. Before commencement of the field cage study, a cohort of 30 O. asiaticus 4th instar females were killed and dried at 90°C for 24 h, after which they were individually weighed (g) and a mean (4th instar body dry mass) determined to serve as the baseline data for calculating the increased body dry mass from 4th instar to adult. Once grasshoppers were assigned to the treatments, we inspected field cages every day to monitor survival and remove the dead individuals (June–July 2012–15). Once all surviving individuals became adults, they were also killed and dried at 90°C for 24 h to determine adult dry mass (mg), and the body mass increase (mg) was calculated by subtracting the 4th instar body dry mass from the adult body dry mass. Survival rate (%) from fourth instar to adult was calculated by the number of individuals that survived through to adulthood/number of initial 4th instar individuals (n = 16). Development time (days) was calculated by the formula (Li et al., Reference Li, Wang and Chen1987):
 $${\rm DT} = \displaystyle{{\sum\nolimits_{i = 1}^n {i{^\ast}N_i}} \over {N_t}} $$
where i is the number of days from 4th instar to adult; N i is the number of individuals with the development time corresponding to that value of ‘i’; N t is the number of all grasshoppers that survived through to adulthood. Growth rate (mg day−1) was calculated by body mass increase/development time (Cease et al., Reference Cease, Elser, Ford, Hao, Kang and Harrison2012).
Host plant and O. asiaticus performance
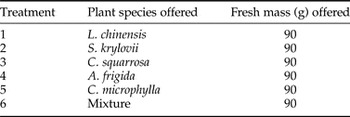
A 3 year feeding trial was conducted during June and July from 2013 to 2015 to determine how commonly occurring plant species affected the growth performance of female O. asiaticus. At the end of June of each year, the research site was prepared by removing all vegetation from a 200-m2 flat area of steppe using a tractor mounted mower. We then installed 30 gauze-covered cages (1 × 1 × 1 m3) in five rows with six cages in each row, with each cage assigned to one of six plant species treatments, either L. chinensis, S. krylovii, C. squarrosa, C. microphylla and A. frigida provided in a no-choice treatment or a mix of all five species provided in equal ratio (table 1), with a randomized block design used to assign treatments to cages. The distance between cages was 1 m with field-collected soil on the floor of each cages to a depth of 10 cm. Field collected 4th-instar O. asiaticus (the same as described above) were collected, then 16 female individuals were randomly selected and placed into each cage. Fresh cuttings of the five plant species were collected from the field daily. All cuttings were trimmed to a height of ~10 cm, and each of the five species placed into separate plastic containers, before being returned to the laboratory. Each species was then weighed using a balance (Mettler/ML104, 0.0001 g), to the required weight to achieve the desired treatments. The weighed plant material was then placed into a plastic rectangular container (20 × 10 × 2 cm3) containing sterile water. The top of the container was perforated with numerous holes, through which the stems of the grass were inserted. After adding plants, the containers were transferred to the 1-m2 cages, and imbedded into the soil so that the top of the container was flush with the soil surface. This provided a semi-natural environment for the grasshoppers. Grasshoppers were able to feed ad libitum with the vegetation replaced every 24 h. Food was changed in the early morning, to minimize disturbance to the insects, and to provide fresh food for the grasshoppers, which feed primarily during the day, and but mainly in the morning. The grasshoppers remained in their cage until all surviving individuals became adults, with the experiment running for ~25 day each year. Field cages were inspected every day, which permitted determination of development time, survival rate, increased body dry mass and growth rate from 4th instar to adult (as described above).
Design of six treatments that differed in plant species offered to the grasshoppers. Treatment 6 was the mixture of five plant species with a fresh mass ratio 1:1:1:1:1 (18 g per plant species, total 90 g).

The treatment comprising the mixture of all five plant species allowed for an attractive index to be calculated. We observed the number of individuals choosing to feed on each plants species within 1 hour of introduction and the attractive index for each plant species calculated from the number of grasshoppers choosing one plant species/total number of grasshoppers’ present (Schutz et al., Reference Schutz, Weißbecker, Klein and Hummel1997).
In 2015, we also studied the consumption and the efficiency of conversion of ingested food (ECI) by O. asiaticus. Uneaten vegetation of each plant species from each cage was removed daily, separated by species, dried at 90°C, and weighed to determine relative consumption amount per 24 h. In parallel to the six feeding treatments, we also ran a control, consisting of five cages without O. asiaticus. Each control cage received 90 g of fresh grass each morning in a 1:1:1:1:1 ratio (as the same for Treatment 6, above). Similar to the six treatments, we dried and weighed the plants from each of the controls. This allowed us to calculate the baseline 24-h water loss for each of the five plant species. We measured the plant consumption amounts every day (24 h) of the six treatments until all individuals become adults. Consumption amount for each grass species was calculated per grasshopper (C i , g/d/individual) for each instar using the formula:
 $$C_i = \displaystyle{{F_i P_i - E_i} \over S}$$
where F i was weight of the plant species at the beginning of the 24 h exposure, P i was the ratio of dry weight over wet weight of the plant species, E i was the dry weight of the plant species at the end of the 24 h feeding period. S represents the number of O. asiaticus surviving at the end of the 24 h period. At last, the sum of consumption amount (g per individual) of each plant by O. asiaticus from 4th instar to adult were calculated. And, the conversion efficiency of ingested food (ECI) of O. asiaticus for each plant, is calculated by increasing body dry mass ×100/food consumption amount (Waldbauer, Reference Waldbauer1968; Rath et al., Reference Rath, Prasad and Sinha2003).
Data analysis
We used Student's t-test to compare grasshopper density, the growth performance variables (body size, survival rate, development time and growth rate) of field cage, and One-way analysis of variance (ANOVA, Turkey's HSD) to compare plant above-ground biomass composition, in Stipa- and Leymus-dominated grassland. Full Nested ANOVA was used to verify the effects caused by the factor cage and different plant treatments, compare the growth performance variables, plant consumption and the efficiency of conversion of ingested food (ECI) by O. asiaticus. The correlation analyses of grasshopper relative density with L. chinensis (power correlation), S. krylovii (linear correlation) and overall plant above-ground biomass (linear correlation) were also conducted. Principal component analysis (PCA) was used to examine the interaction of O. asiaticus density with above-ground biomass of S. krylovii, L. chinensis, other plant species and total plant species. We used SAS version 8.0 for all analyses.
Results
Survey of plant composition and relative O. asiaticus density in Stipa-dominated and Leymus-dominated grassland
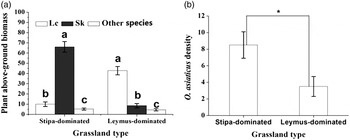
The 2010 and 2011 routine field survey found that the composition of the above-ground biomass was very different between these two grassland types (fig. 1a). For Stipa-dominated grassland, the above-ground biomass of the different plant species was in decreasing order S. krylovii (66.0 ± 5.21 g) > L. chinensis (10.0 ± 2.20 g) > Other species (C. squarrosa, A. frigida, C. microphylla and Potentilla tanacetifolia) (5.3 ± 1.02 g). By comparison, in Leymus-dominated grassland, the above-ground biomass was in decreasing order L. chinensis (42.8 ± 4.09 g) > S. krylovii (8.5 ± 2.02 g) > Other species (C. squarrosa, Artemisia frigida, Caragana microphylla) (4.5 ± 1.11 g). Overall, the predominant plant species across both grassland ecosystems were S. krylovii, L. chinensis, C. squarrosa, A. frigida and C. microphylla.
Plant above-ground biomass (g m−2) composition and O. asiaticus relative density (mean number of individuals (±SD) per 100 sweep-nets) in Stipa- and Leymus-dominated grassland. (a) The mean ± SD above-ground biomass (g m−2) composition of Leymus chinensis (Lc), Stipa krylovii (Sk) and Other species in Stipa-dominated and Leymus-dominated grassland. Bars in fig. 1a marked by different lowercase letters within the same grassland type are significantly different based on Tukey's HSD analysis at P < 0.05 (ANOVA). For Stipa-dominated grassland, ‘Other species’ comprised C. squarrosa, A. frigida, C. microphylla and P. tanacetifolia, and in Leymus-dominated grassland Other species were C. squarrosa, A. frigida, C. microphylla. (b) O. asiaticus relative density (mean number of individuals (±SD) per 100 sweep-nets) in Stipa- and Leymus-dominated grassland, *P < 0.05 in fig. 1b (t-test).

The survey targeting O. asiaticus showed that the relative density in these two plots did vary (fig. 1b). In Stipa-dominated grassland, O. asiaticus mean relative density (number of individuals per 100 net-sweeps, ±SD) was 8.5 ± 1.6, which was significantly greater (t-test, N = 8, F = 3.79, P = 0.0318) than Leymus-dominated grassland (3.5 ± 1.2). This result showed that O. asiaticus mainly distributed in Stipa-dominated grassland.
Large-scale survey of plants biomass and O. asiaticus density on grazed grassland
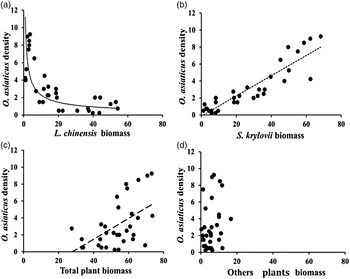
Survey results showed that O. asiaticus relative density exhibited a significant negative relationship to L. chinensis above-ground biomass (fig. 2a, power correlation: y = 10.157x −0.67, R 2 = 0.567, N = 32, F = 39.283, P < 0.001). In contrast, the relative density of O. asiaticus showed a significant positive relationship to the above-ground biomass of S. krylovii (fig. 2b, linear correlation: y = 0.1192x − 0.1375, R 2 = 0.823, F = 139.388, P < 0.001), and to total above-ground plant biomass (fig. 2c, linear correlation: y = 0.1234x − 3.4072, R 2 = 0.298, N = 32, F = 11.913, P = 0.002). There were no significant relationships between O. asiaticus and the overall biomass of the other plant species (C. squarrosa, A. frigida, C. microphylla and P. tanacetifolia) (fig. 2d).
Relationships between the relative density of O. asiaticus grasshoppers (mean number of individuals per 100 sweep-nets) and mean above-ground biomass (g m−2) of L. chinensis (a), S. krylovii (b), total plant (c) and Other plant species (C. squarrosa, A. frigida, C. microphylla and P. tanacetifolia) (d). Data combined from measurements recorded 2011–14 (N = 8 means per year).

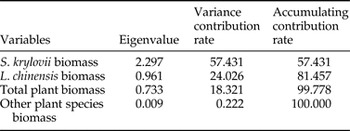
PCA of these four variables of plant above-ground biomass (table 2) showed that the eigenvalue and variance contribution rate in decreasing order was: S. krylovii biomass (eigenvalue = 2.297, variance contribution rate = 57.431) > L. chinensis biomass (0.961, 24.026) > total plant biomass (0.733, 18.3216) > other plant species biomass (0.009, 0.222).
PCA analysis result for four variables of plant above-ground biomass (g m−2).

Field cage study of O. asiaticus performance in Stipa-dominated and Leymus-dominated grassland
Results generally showed that O. asiaticus had significantly (t = 2.959–5.368, df = 4, P < 0.05) greater survival rate (fig. 3a), adult dry mass (fig. 3c), growth rate (fig. 3d) and a faster developmental time (t = 3.012–4.366, df = 4, P < 0.05) (fig. 3b), in Stipa-dominated grassland compared with Leymus-dominated grassland for 2012–2015, showing that O. asiaticus has better growth performance in Stipa-dominated grassland.
O. asiaticus mean (±SD) survival rate (%) (a), development time (days) (b), adult body dry mass (mg) (c) and growth rate (mg day−1) (d), in Stipa-dominated and Leymus-dominated grassland habitats, respectively. *P < 0.05 and **P < 0.01 (t-test) within each year indicates that the values are significantly different.

Host plant and O. asiaticus performance
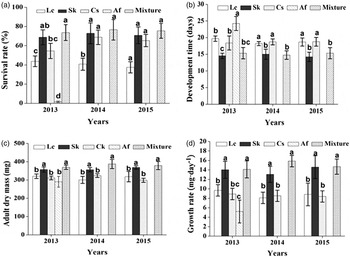
O. asiaticus had a significantly higher (ANOVA, P < 0.05) survival rate (fig. 4a), adult body dry mass (fig. 4c), growth rate (fig. 4d) and a faster (P < 0.05) developmental time (fig. 4b) when presented with only S. krylovii or when present in the mixture treatment. In comparison, the performance variables were significantly lower (P < 0.05) when O. asiaticus was caged with the other plant species, which suggesting that O. asiaticus has a good performance when feeding S. krylovii, with an approximate equal with all plants mixture. There was no significant cage effect (P > 0.05) on the measured growth performance variables.
O. asiaticus mean (±SD) survival rate (%) from 4th instar to adults (a), development time (days) (b), adult dry mass (mg) (c) and growth rate (mg day−1) (d) when presented with L. chinensis (Lc), S. krylovii (Sk), C. squarrosa (Cs), A. frigida (Af), C. microphylla (Cm) in a no-choice or all five plant species (Mixture) environment. Significant differences between different plants within each year are indicated by lower case letters (ANOVA, P < 0.05).

We also found that no O. asiaticus survived to adults when confined only on C. microphylla, and in 2013 only a few O. asiaticus were able to survive to adults when confined on A. frigida.
Attractive index of different plant species to O. asiaticus
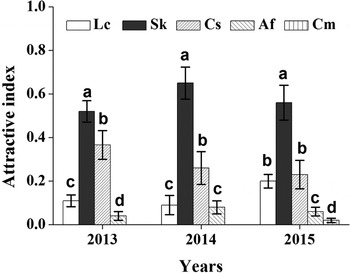
Results of the choice tests (fig. 5) whereby O. asiaticus was provided with five potential host species, showed the attractive index (mean ± SD) in decreasing order was: S. krylovii (0.52 ± 0.05, 0.65 ± 0.07 and 0.56 ± 0.08) (2013, 2014 and 2015 respectively) > C. squarrosa (0.37 ± 0.07, 0.26 ± 0.07, 0.23 ± 0.06) > L. chinensis (0.11 ± 0.03, 0.09 ± 0.04, 0.2 ± 0.03) > A. frigida (0.04 ± 0.02, 0.08 ± 0.03, 0.06 ± 0.02) > C. microphylla (0, 0, 0.02 ± 0.01).
Attractive index (means ± SD) of L. chinensis (Lc), S. krylovii (Sk), C. squarrosa (Cs), Artemisia frigida (Af), Caragana microphylla (Cm) to O. asiaticus in the feeding trial from 2013–15. Significant differences between different plant species within each year are indicated by lower case letters (ANOVA, P < 0.05).

Plant consumption and efficiency of conversion of ingested food (ECI) of different plants by O. asiaticus
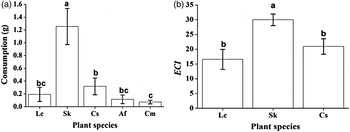
The 2015 experiment showed that the mean consumption amount (g per individual ± SD) for individuals developing from 4th instar through to maturity was highest (P < 0.05) for S. krylovii (1.25 ± 0.28), followed by C. squarrosa (0.32 ± 0.13) and L. chinensis (0.19 ± 0.11), with minimal feeding observed on A. frigida (0.12 ± 0.07) and C. microphylla (0.07 ± 0.03) when presented as part of the plant mix (fig. 6a). In cages were only A. frigida or C. microphylla were provided, no O. asiaticus survived to adulthood (fig. 4a), therefore the conversion efficiency index (ECI) was only calculated for L. chinensis, S. krylovii and C. squarrosa. Results showed that the mean (±SD) percentage ECI for S. krylovii, C. squarrosa and L. chinensis was 30.0 ± 3.0 (P < 0.05), 20.9 ± 2.6 and 16.6 ± 2.4, respectively (fig. 6b).
Plant consumption (mean g dry mass/individual ± SD) for L. chinensis (Lc), S. krylovii (Sk), C. squarrosa (Cs), A. frigida(Af) and C. microphylla (Cm) by O. asiaticus from 4th instar to adults (a), and food conversion efficiency of ingested food (ECI) for L. chinensis, S. krylovii and C. squarrosa (b). Plant consumption was measured from the treatment of all plants mixture in 2015. Significant differences between different plant species are indicated by lower case letters (ANOVA, P < 0.05).

Discussion
Previous studies have shown that some plant species have strong attraction or are indispensable to specific herbivore species, and may contribute to or even accelerate pest plague outbreaks (Schutz et al., Reference Schutz, Weißbecker, Klein and Hummel1997; Scriber, Reference Scriber2002; Powell et al., Reference Powell, Tosh and Hardie2006). For insect pest species, understanding the relationship between herbivore and those plants is helpful for the monitoring, early warning and improving management strategies (Cease et al., Reference Cease, Elser, Ford, Hao, Kang and Harrison2012; Huang, Reference Huang2015). Grasshoppers are important grassland pests, with outbreaks causing massive agricultural damage, leading to significant economic losses (Liu et al., Reference Liu, Wang, Wang, Han, Wang and Hao2013) with the composition of plant species in the grassland influencing population dynamics and spatial distribution of insects (Unsicker et al., Reference Unsicker, Franzke, Specht, Köhler, Linz, Renker, Stein and Weisser2010; Masloski et al., Reference Masloski, Greenwood, Reiskind and Payton2014). In order to control these pests, it is essential to be able to predict their spatial distribution and understand the factors that lead to outbreaks. Our research started from the observation that O. asiaticus was predominately distributed in Stipa-dominated grassland, with a lower distribution in Leymus-dominated grassland, a relationship also reported by other researchers (e.g., Cease et al., Reference Cease, Elser, Ford, Hao, Kang and Harrison2012). Both redundancy analysis (Wu et al., Reference Wu, Xu, Cao, Gexigedu, Liu, He, Ererdengba and Wang2012) and the projection pursuit model (Huang, Reference Huang2015), demonstrated that the presence of S. krylovii significantly affected the density of O. asiaticus. Based on our research that focused on plant associations and grasshopper growth performance, our hypothesizes that S. krylovii was a driver to the distribution of O. asiaticus was confirmed. Firstly, 4 years of extensive monitoring showed that the O. asiaticus density was positively related with S. krylovii above-ground biomass. Secondly, a 4 year field cage study indicated that O. asiaticus growth performance was higher in Stipa-dominated grassland compared with Leymus-dominated grassland. Finally, a 3 year cage feeding trial showed that O. asiaticus has a strong behavioral attraction to S. krylovii, with better growth and survival when compared with other plant species found in the grassland ecosystem. When the different plant species were presented individually, consumption efficiency (ECI) was highest when O. asiaticus was provided with S. krylovii. Overall, S. krylovii (Pooideae), contributes to optimal growth performance and population distribution of the grasshopper O. asiaticus.
Herbivores normally need adequate food resources to support their development and reproduction (Powell et al., Reference Powell, Tosh and Hardie2006). When food resources decrease and become scarce, their population dynamics would also be negatively affected for food shortage (Scriber, Reference Scriber2002). So, generally, there is a positive relationship between herbivores and plant above-ground biomass, especially in grazing degraded grassland of limited resources (Zhang & Fielding, Reference Zhang and Fielding2011; Liu et al., Reference Liu, Wang, Wang, Han, Wang and Hao2013). This was also proven by the positive relationship between total above-ground plant biomass and O. asiaticus density in our study. We also found that the O. asiaticus density was negatively related to L. chinensis above-ground biomass, and Leymus-dominated grassland generally impacts negatively on O. asiaticus growth performance compared with Stipa-dominated grassland. There may be two reasons to explain. Firstly, the PCA indicated that S. krylovii biomass was the main factor influencing O. asiaticus density compared to other biomass variables, with a significant negative correlation to L. chinensis biomass (correlation coefficient r = −0.824, P < 0.01). So, the decreasing O. asiaticus density was mainly resulted from the decreasing preferred food S. krylovii biomass. Another potential mechanism for this result could be a high nitrogen content in L. chinensis that has been shown to be detrimental to O. asiaticus growth and occurrence (Cease et al., Reference Cease, Elser, Ford, Hao, Kang and Harrison2012).
Although biological and ecological evidence support a close relationship between S. krylovii and O. asiaticus, it does not preclude O. asiaticus from existing in grasslands where S. krylovii was absent or present in low densities. In these grasslands, O. asiaticus could survive by feeding other host grasses such as C. squarrosa (Liu et al., Reference Liu, Wang, Wang, Han, Wang and Hao2013; Zhang et al., Reference Zhang, He, Cao, Zhang, Wu, Liu and Wang2013), albeit at lower population densities when compared with S. krylovii dominant grasslands. Previous research has also shown that C. squarrosa also can be an important host plant for O. asiaticus survival and development (Zhang et al., Reference Zhang, He, Cao, Zhang, Wu, Liu and Wang2013; Huang, Reference Huang2015).
The reasons underpinning the buildup of O. asiaticus in S. krylovii dominant habitats may relate to the presence of important key nutrients (e.g., vitamins, fatty acids or appropriate proportion of C/N), secondary metabolites or other substances (Raymond et al., Reference Raymond, David and Zhong2004; Rominger et al., Reference Rominger, Miller and Collins2009) critical for O. asiaticus development or reproduction. Furthermore, the micro-climate variables in different habitats, such as humidity, light, and temperature also can influence insect growth performance (Stige et al., Reference Stige, Chan, Zhang, Frank and Stenseth2007). Those variables maybe all more favourable for O. asiaticus growth in S. krylovii dominated grassland compared to Leymus-dominated grassland. Research to understand the role of micro-climate variables in relation to O. asiaticus growth performance in these two grassland types would appear to be worthwhile.
S. krylovii is one of the iconic species found in the Eurasian steppe grassland, with a wide geographic distribution that includes northern China, Kazakhstan, Mongolia and Siberia (Chen & Wang, Reference Chen and Wang2000; Han et al., Reference Han, Zhang, Wang, Bai, Wang, Han and Li2008). Due to the close relationship between S. krylovii and O. asiaticus in this study, those areas of Stipa-dominated grasslands, represent regions for potential expansion of O. asiaticus range particularly under the background of climate change which may allow for the buildup of plague populations (Stige et al., Reference Stige, Chan, Zhang, Frank and Stenseth2007). Thus, O. asiaticus monitoring and control should be strengthened in those regions. Where populations of O. asiaticus are reaching economically damaging levels, an application of entomopathogenic organisms, such as the parasite Nosema locustae in combination with the fungus Metarhizium anisopliae (Lomer & Prior, Reference Lomer and Prior2001), can provide effective biological control.
As such, this study is useful for developing guidelines for the monitoring of O. asiaticus population dynamics against the background of vegetation succession and changing plant communities in response to different interference factors, such as grazing, fire, climate change and/or other human activities. For example, O. asiaticus density could increase and reach outbreak populations where Leymus (or other plant species) – dominated grassland undergoes a shift towards Stipa dominance, driven by variables such as grazing pressure that change plant community composition (Zhu et al., Reference Zhu, Wang, Wang, Bai, Fang and Liu2012). Overgrazing by sheep has been shown to decrease L. chinensis biomass, and increase the abundance of S. krylovii (Zhu et al., Reference Zhu, Wang, Wang, Bai, Fang and Liu2012; Liu et al., Reference Liu, Wang, Wang, Han, Wang and Hao2013).
The insights into the relationship between O. asiaticus and its host plants, provide an opportunity to devise strategies to improve livestock and grasshopper management that reduce the potential occurrence of plant community shifts towards S. krylovii dominance. This may be through interventions such as improved livestock grazing management, periods of fallow to allow habitat recovery, or conservation strips to provide refuges for natural enemies of O. asiaticus. Future research could also look at plant biochemistry, to better understand what nutrients or secondary metabolites and what micro-climate of different grassland types are critical for development and reproduction of O. asiaticus.
Acknowledgements
This study was supported by the National Natural Science Foundation of China, 31471823, the Earmarked Fund for China Agriculture Research System, CARS-35-07, and the Innovation Project of Chinese Academy of Agricultural Science.