





Introduction
Bipolar disorders (BD) are severe lifelong mental illnesses, ranking among the most disabling conditions worldwide (James et al., Reference James, Abate, Abate, Abay, Abbafati, Abbasi, Abbastabar, Abd-Allah, Abdela, Abdelalim, Abdollahpour, Abdulkader, Abebe, Abera, Abil, Abraha, Abu-Raddad, Abu-Rmeileh, Accrombessi and Murray2018; Young & Grunze, Reference Young and Grunze2013). Yet, there are significant clinical differences between individuals with BD in their symptoms, comorbid conditions, clinical course, treatment response, and the impact of illness on their functioning. This clinical heterogeneity likely reflects neurobiological differences (Angelescu et al., Reference Angelescu, Brugger, Borgan, Kaar and Howes2021). Indeed, some individuals with BD show marked brain imaging alterations, whereas others with the same diagnosis appear similar to healthy controls (Hajek, Kopecek, Höschl, & Alda, Reference Hajek, Kopecek, Höschl and Alda2012). Consequently, factors other than diagnosis must contribute to variations in brain structure among people with the same diagnosis. Shifting our focus from describing average illness-related patterns of brain changes to understanding individual factors contributing to neurobiological heterogeneity is a key step toward individualized medicine. Here, we focused on heterogeneity in brain white matter alterations in BD, which are under-researched.
White matter microstructure can be studied using diffusion tensor imaging (DTI; Alexander et al., Reference Alexander, Lee, Lazar and Field2007). This method generates different diffusivity measures, including fractional anisotropy (FA), mean, axial, and radial diffusivity (MD, AD, RD). FA focuses on the directional coherence of diffusion of water in brain tissue, while MD captures the rate of diffusion. These primary measures are composites of AD and RD, which track the rate of diffusion parallel and perpendicular to white matter bundles. These DTI metrics have been used to study alterations in brain white matter in various psychiatric illnesses (Koshiyama et al., Reference Koshiyama, Fukunaga, Okada, Morita, Nemoto, Usui, Yamamori, Yasuda, Fujimoto, Kudo, Azechi, Watanabe, Hashimoto, Narita, Kusumi, Ohi, Shimada, Kataoka, Yamamoto and Hashimoto2019).
In prior diffusion magnetic resonance imaging (MRI) studies, BD, medications, age, obesity, and sex have been associated with white matter indices in multiple overlapping tracts, including the genu and body of the corpus callosum and the cingulate gyrus (Behler, Kassubek, & Müller, Reference Behler, Kassubek and Müller2021; Cosgrove, Mazure, & Staley, Reference Cosgrove, Mazure and Staley2007; Dietze, McWhinney, Radua, & Hajek, Reference Dietze, McWhinney, Radua and Hajek2023; Dietze et al., Reference Dietze, McWhinney, Favre, Abé, Alexander, Barkhau, Benedetti, Berk, Bøen, Boye, Brosch, Bülow, Calderoni, Caligiuri, Canales-Rodríguez, Cannon, Caseras, Chaim-Avancini, Ching and Van Rheenen2024; García-García et al., Reference García-García, Michaud, Dadar, Zeighami, Neseliler, Collins, Evans and Dagher2019; Ge et al., Reference Ge, Grossman, Babb, Rabin, Mannon and Kolson2002; Gennatas et al., Reference Gennatas, Avants, Wolf, Satterthwaite, Ruparel, Ciric, Hakonarson, Gur and Gur2017; Inano et al., Reference Inano, Takao, Hayashi, Abe and Ohtomo2011; Kochunov et al., Reference Kochunov, Williamson, Lancaster, Fox, Cornell, Blangero and Glahn2010; Westlye et al., Reference Westlye, Walhovd, Dale, Bjørnerud, Due-Tønnessen, Engvig, Grydeland, Tamnes, Ostby and Fjell2010). Many of these effects are in the same direction as those of BD on the brain, where FA is lower, and MD and RD are higher (Barysheva et al., Reference Barysheva, Jahanshad, Foland-Ross, Altshuler and Thompson2013). If we ignore the impact of these additional factors, we may exaggerate the statistical effects of BD on brain white matter.We have previously shown that BD to white matter associations may be inflated by the absence of controlling for body mass index (BMI) and medications (Dietze et al., Reference Dietze, McWhinney, Favre, Abé, Alexander, Barkhau, Benedetti, Berk, Bøen, Boye, Brosch, Bülow, Calderoni, Caligiuri, Canales-Rodríguez, Cannon, Caseras, Chaim-Avancini, Ching and Van Rheenen2024). In addition, medications such as lithium may act in the opposite direction to many of the other associations and may decrease the extent of BD versus control differences. Unless we understand the unique contribution of these extra-diagnostic factors, we may be unable to correctly interpret the brain imaging findings.
Previous studies of gray matter brain alterations in BD (McWhinney et al., Reference McWhinney, Abé, Alda, Benedetti, Bøen, del Mar Bonnin, Borgers, Brosch, Canales-Rodríguez, Cannon, Dannlowski, Diaz-Zuluaga, Dietze, Elvsåshagen, Eyler, Fullerton, Goikolea, Goltermann, Grotegerd and Hajek2021a; McWhinney et al., Reference McWhinney, Abé, Alda, Benedetti, Bøen, C. del M., Borgers, Brosch, Canales-Rodríguez, Cannon, Dannlowski, Diaz-Zuluaga, Dietze, Elvsåshagen, Eyler, Fullerton, Goikolea, Goltermann and Grotegerd2023) and white matter (Favre et al., Reference Favre, Pauling, Stout, Hozer, Sarrazin, Abé, Alda, Alloza, Alonso-Lana, Andreassen, Baune, Benedetti, Busatto, Canales-Rodríguez, Caseras, Chaim-Avancini, Ching, Dannlowski, Deppe and Houenou2019) have investigated differences via a region of interest (ROI) analysis – one region or tract at a time. However, univariate studies ignore the overall network architecture of the brain and reduce statistical power because they necessitate control for multiple comparisons (Lindquist & Mejia, Reference Lindquist and Mejia2015). These methods are sensitive to large, localized alterations not characteristic of complex severe mental illnesses (SMIs), where abnormalities may be distributed or diffuse (Cauda et al., Reference Cauda, Nani, Manuello, Premi, Palermo, Tatu, Duca, Fox and Costa2018). Multivariate modeling allows us to consider a broader overall network of alterations and generally yields more replicable findings when applied to large, ecologically valid study samples (Marek et al., Reference Marek, Tervo-Clemmens, Calabro, Montez, Kay, Hatoum, Donohue, Foran, Miller, Hendrickson, Malone, Kandala, Feczko, Miranda-Dominguez, Graham, Earl, Perrone, Cordova, Doyle and Dosenbach2022). Principal component analysis (PCA) is one such technique that reduces the dimensionality of variables (Comrey & Lee, Reference Comrey and Lee2013), offering insight into the patterns of global white matter alterations not limited to a single tract.
Here, for the first time to our knowledge, we used PCA to identify patterns of alterations across white matter tracts in FA, MD, AD, and RD, and relate them to clinical and demographic variables. We used a multivariate technique that accounted for the network architecture of the brain to focus on small but distributed alterations, which may better characterize complex disorders. We compiled and analyzed data from the Enhancing NeuroImaging Genetics through Meta-Analysis Bipolar Disorder Working Group (ENIGMA-BD), as large datasets are needed for the application of multivariate techniques and the study of multiple predictors. To parse out the heterogeneity, we focused on variables beyond just the diagnosis that are known to contribute to the observed variations in brain structure and quantified their unique contribution to white matter alterations.
Materials and methods
Participating sites
The ENIGMA-BD working group members contributed independently collected brain imaging and clinical data from 16 research sites across six continents and 15 countries. We analyzed individual tract-level FA, MD, AD, and RD values from MRI-derived DTI data, clinical information including medications prescribed at the time of scanning, and BMI (see Table 1 and Supplementary Table S1).
Summary of demographic, diagnostic, and treatment information of sample

Table 1. Long description
The table consists of four columns: Variable, B D (Bipolar Disorders), C N (Controls), and Group Difference.
Key demographic data:
- Sample size: B D = 910, C N = 1256.
- Age (years), mean (S D): B D = 41.70 (13.43), C N = 34.99 (12.59). Group difference chi-squared = 132.79, p < 0.001.
- Sex, women (%): B D = 548 (60.2), C N = 742 (59.1). Group difference chi-squared = 0.286, p = 0.593.
- B M I (kg/m super 2), mean (S D): B D = 26.49 (5.26), C N = 24.07 (3.99). Group difference chi-squared = 142.65, p < 0.001.
- B M I by category: Normal B D = 44.8%, C N = 67.4%; Overweight B D = 32.7%, C N = 24.5%; Obese B D = 22.4%, C N = 8.1%. Group difference chi-squared = 135.57, p < 0.001.
Clinical data for the B D group only:
- Full diagnosis: B D I = 72.5%, B D I I = 25.1%, B D N O S = 2.4%.
- Medications: Lithium = 43.8%, Antiepileptics = 43.3%, Antipsychotics = 43.1% (Gen 1 = 8.6%, Gen 2 = 39.3%), Antidepressants = 39.6%.
- Mood state: Depressed = 41.2%, Euthymic = 51.0%, Hypomanic = 0.7%, Manic = 5.6%, Mixed = 1.3%.
- Age of onset: 26.15 years (S D 10.39).
- History of psychosis: 47.7%.
- Duration of illness: 15.83 years (S D 11.67).
Note: BMI, body mass index; BD, bipolar disorders; CN, controlsn; Gen1, first generation; Gen2, second generation; SD, standard deviation. Significance is indicated by an asterisk (p < .0.05, *)
Standard diagnostic instruments were used in all studies, including SCID (N = 10 studies), MINI (N = 3 studies), and DIGS (N = 2 studies); see Supplementary Table S2. Most studies included bipolar I (BDI) and bipolar II (BDII), while three studies also included BD not otherwise specified (BD-NOS; N = 3). Most participants with BD at the time of scanning were euthymic (51.1%), some were depressed (41.3%), manic (5.7%), hypomanic (0.7%), or in a mixed state (1.2%). Substance abuse was an exclusion criterion in most studies; for all other exclusion criteria, see Supplementary Table S3. All participating research sites obtained approval from local ethics committees, and all participants gave informed written consent. All aspects of this work comply with the ethical standards of the relevant national and institutional committees on human experimentation and with the Helsinki Declaration of 1975, revised in 2008.
MRI acquisition and image processing
Tract-level FA, MD, AD, and RD values for each participant were acquired from each site (see Supplementary Table S4 for detailed acquisition parameters). Image preprocessing (e.g. eddy current and echo-planar distortion correction, and tensor fitting) was performed at the individual site, or research sites provided raw MRI data that were processed by our collaborators at the NeuroSpin Institute (Favre et al., Reference Favre, Pauling, Stout, Hozer, Sarrazin, Abé, Alda, Alloza, Alonso-Lana, Andreassen, Baune, Benedetti, Busatto, Canales-Rodríguez, Caseras, Chaim-Avancini, Ching, Dannlowski, Deppe and Houenou2019), or by us using the same analytical protocols and quality control assessments as recommended on the ENIGMA-DTI website: https://enigma.ini.usc.edu/protocols/dti-protocols/ as well as on GitHub: https://github.com/ENIGMA-git#enigma-dti-imaging. ENIGMA-DTI protocols are openly available online for standardization across the ENIGMA consortium to foster critical feedback, replication, and reproducibility. These protocols have been widely applied in large-scale ENIGMA studies in BD, schizophrenia, major depression, OCD, PTSD, epilepsy, and Parkinson’s disease (Dennis et al., Reference Dennis, Disner, Fani, Salminen, Logue, Clarke, Haswell, Averill, Baugh, Bomyea, Bruce, Cha, Choi, Davenport, Densmore, du Plessis, Forster, Frijling, Gonenc and Morey2021; Favre et al., Reference Favre, Pauling, Stout, Hozer, Sarrazin, Abé, Alda, Alloza, Alonso-Lana, Andreassen, Baune, Benedetti, Busatto, Canales-Rodríguez, Caseras, Chaim-Avancini, Ching, Dannlowski, Deppe and Houenou2019; Hatton et al., Reference Hatton, Huynh, Bonilha, Abela, Alhusaini, Altmann, Alvim, Balachandra, Bartolini, Bender, Bernasconi, Bernasconi, Bernhardt, Bargallo, Caldairou, Caligiuri, Carr, Cavalleri, Cendes and McDonald2020; Kelly et al., Reference Kelly, Jahanshad, Zalesky, Kochunov, Agartz, Alloza, Andreassen, Arango, Banaj, Bouix, Bousman, Brouwer, Bruggemann, Bustillo, Cahn, Calhoun, Cannon, Carr, Catts and Donohoe2018; Owens-Walton et al., Reference Owens-Walton, Nir, Al-Bachari, Ambrogi, Anderson, Aventurato, Cendes, Chen, Ciullo, Cook, van Heese, Vecchio, Villalón-Reina, Vriend, Wang, Wu, Yasuda, Thompson, Jahanshad and van der Werf2024; Piras et al., Reference Piras, Piras, Abe, Agarwal, Anticevic, Ameis, Arnold, Banaj, Bargalló, Batistuzzo, Benedetti, Beucke, Boedhoe, Bollettini, Brem, Calvo, Cho, Ciullo, Dallaspezia and Spalletta2021; Thompson et al., Reference Thompson, Jahanshad, Ching, Salminen, Thomopoulos, Bright, Baune, Bertolín, Bralten, Bruin, Bülow, Chen, Chye, Dannlowski, de Kovel, Donohoe, Eyler, Faraone, Favre and Zelman2020; van Velzen et al., Reference van Velzen, Kelly, Isaev, Aleman, Aftanas, Bauer, Baune, Brak, Carballedo, Connolly, Couvy-Duchesne, Cullen, Danilenko, Dannlowski, Enneking, Filimonova, Förster, Frodl, Gotlib and Schmaal2019).
As per the ENIGMA-DTI protocol, image analysis including tract-based spatial statistics (TBSS) was performed by each site, and FA, MD, AD, and RD were extracted for each participant across 22 ROIs (see full description in Supplementary Table S5). The Johns Hopkins University (JHU) white matter parcellation atlas (Mori et al., Reference Mori, Oishi, Jiang, Jiang, Li, Akhter, Hua, Faria, Mahmood, Woods, Toga, Pike, Neto, Evans, Zhang, Huang, Miller, van Zijl and Mazziotta2008) was used to segment white matter ROIs from the ENIGMA template in MNI (Montreal Neurological Institute) space.
Principal component analysis
All preprocessing steps including the removal of outliers is done by each individual site. The ENIGMA standard is to remove outliers beyond three standard deviations. Each tract was zero-centered with a standard deviation of 1.0, and missing values were imputed for each of FA, MD, AD, and RD using the missForest algorithm (Stekhoven & Bühlmann, Reference Stekhoven and Bühlmann2012). Each tract was missing on average 6.7% of its values due to outliers or segmentation fault (minimum missing 0.0% in CGC, maximum 17.3% in IC). PCA was used to acquire component loadings and scores for each principal component of FA, MD, AD, and RD separately (i.e. four separate PCAs). There were 22 white matter tracts, meaning each diffusivity measure included 22 principal components. Component loadings represent relative contributions of tracts to each component. The proportion of variance explained was calculated for each principal component. Further analyses focused on principal components explaining more than 10% of the variance in each measure; see the supplement for additional information. The first principal component (PC1) score for each participant was taken as our dependent variable, indexing the whole-brain white matter covariance patterns across individuals.
Statistical modeling
Our main statistical focus was on the primary diffusion metrics FA and MD assessed using PCA. Diffusion directions AD and RD were included to better interpret the FA and MD results. We explored, in the clinical sample, whether clinical variables could affect results among patients. To provide a comparison with the PCA results, we included the standard exploratory way of analyzing regional differences through ROI analyses.
We fitted linear mixed regression models (package nlme version 3.1-152 in R version 4.1.1) to test for associations between participants’ component score from the multivariate PCA analyses (representing white matter brain alterations as the dependent variable; see Supplementary Figure S1) or each ROI using univariate outcome mixed-effect modeling, with BMI, age, sex, and group (BD or healthy control) as the predictors. We tested for a BMI by group interaction and included it if significant. We tested a second model among participants with BD, including predictors BMI, age, sex, diagnosis (BDI or BDII), age of onset, history of psychosis, and medications prescribed at the time of scanning (coded yes or no for each medication class, as per previous ENIGMA-BD analyses; McWhinney et al., Reference McWhinney, Abé, Alda, Benedetti, Bøen, del Mar Bonnin, Borgers, Brosch, Canales-Rodríguez, Cannon, Dannlowski, Diaz-Zuluaga, Dietze, Elvsåshagen, Eyler, Fullerton, Goikolea, Goltermann, Grotegerd and Hajek2021b). To provide direct comparison with the structural PCA results from our previous ENIGMA-BD study (McWhinney et al., Reference McWhinney, Hlinka, Bakstein, Dietze, Corkum, Abé, Alda, Alexander, Benedetti, Berk, Bøen, Bonnekoh, Boye, Brosch, Canales-Rodríguez, Cannon, Dannlowski, Demro, Diaz-Zuluaga and Hajek2024), we report the results of analyses which used the first principal component (PC1) as dependent variables with confidence intervals and nominal p-values. The exploratory ROI results are reported with FDR-adjusted p-values. Medications prescribed included antiepileptics, antidepressants, first- or second-generation antipsychotics combined, or lithium. Duration of illness at the time of scanning was calculated by subtracting age from age of onset of diagnosis. All models included research site as a random effect. Tracts with separate estimates for each hemisphere additionally included fixed and random effects for hemisphere (left or right). We checked the normality of residuals using QQ plots and assessed multicollinearity by testing the variance inflation factor. See Supplementary Information for a list of all the statistical models in this study.
We also wanted to check whether the regional loadings across white matter tracts correlated between measures. A Pearson correlation between the participants’ component scores for the first component of each diffusivity measure (FA, MD, AD, and RD) was run to determine the relationship between each diffusivity measure. Additionally, we compared the Spearman rank-order correlation coefficient between tracts from the first PC for each measure to determine overlap between measures in regional patterns.
Results
Description of the sample
We analyzed individual-subject data from 2166 individuals, including 910 with BD and 1256 controls. Participants with BD were older and had higher BMI than controls (see Table 1 and Supplementary Figure S2). There was a comparable proportion of women in each group. Each research cohort is detailed in Supplementary Table S1.
Patterns of brain structure uncovered by PCA
The first principal component accounted for 38.9% of the variance in FA, 48.9% in MD, 32.7% in AD, and 45.5% in RD (see Figure 1). All other components, including the second component for FA, MD, AD, and RD, accounted for less than 10% of the variance for each measure; see Supplementary Table S6.
PCA results with variance explained by each component in scree plots (left), and distribution of the first two components (right) for (a) PC1 FA; (b) PC1 MD; (c) PC1 AD; and (d) PC1 RD. Note: PC1 represents the first principal component.

Figure 1. Long description
A four-panel multi-plot labeled A through D. Each panel contains a scree plot on the left and a scatter plot on the right.
Panel A (P C 1 F A):
- Scree plot: The x-axis shows Dimensions 1 to 10. The y-axis shows Percentage of explained variances from 0 to 40. Dimension 1 shows a sharp peak at nearly 40 percent, followed by an asymptotic decrease toward 0.
- Scatter plot: The x-axis is P C 1 (38.85 percent) and the y-axis is P C 2 (6.92 percent). Data points form a dense horizontal oval cluster centered at 0, 0.
Panel B (P C 1 M D):
- Scree plot: Dimension 1 explains nearly 50 percent of variance, with a steep drop-off for subsequent dimensions.
- Scatter plot: The x-axis is P C 1 (48.92 percent) and the y-axis is P C 2 (6.93 percent). Points are concentrated in a tight circular cluster at the origin with a few outliers to the right.
Panel C (P C 1 A D):
- Scree plot: Dimension 1 explains approximately 33 percent of variance.
- Scatter plot: The x-axis is P C 1 (32.66 percent) and the y-axis is P C 2 (6.21 percent). The cluster is vertically elongated along the P C 2 axis.
Panel D (P C 1 R D):
- Scree plot: Dimension 1 explains approximately 45 percent of variance.
- Scatter plot: The x-axis is P C 1 (45.51 percent) and the y-axis is P C 2 (7.41 percent). The data forms a dense, roughly circular distribution around the origin.
All white matter tract loadings were in the same direction within each measure for PC1 (see Supplementary Figure S3). The white matter tracts with the highest loadings across PC1 FA, MD, AD, and RD were some of the largest white matter tracts, including the superior longitudinal fasciculus, superior and posterior corona radiata, and internal capsule (see Figure 2, Supplementary Figure S3 and Supplementary Table S7 for factor loadings per diffusion measure for each tract).
Exploded view of glass brains of factor loadings of the first principal component for (a) fractional anisotropy, (b) mean diffusivity, (c) axial diffusivity, and (d) radial diffusivity. Gradient of blue to green represents low to high factor loadings.

Figure 2. Long description
A four-panel visualization labeled A, B, C, and D. Each panel features a translucent white 3D brain model on the left with internal structures highlighted in a blue-to-green gradient. Lines extend from the brain to individual anatomical segments exploded to the right.
* Panel A (F A): Shows high green loadings in segments like S C R, S L F, and A C R, while lower blue loadings appear in P L I C and I F O.
* Panel B (M D): Displays a similar distribution to A but with slightly more muted green tones in the S C C and B C C regions.
* Panel C (A D): Features darker blue tones in the G C C and P L I C segments, indicating lower factor loadings compared to panels A and B.
* Panel D (R D): Shows a mix of mid-range green and blue, with the C G C and S L F segments appearing in a medium green shade.
The exploded segments in each panel are labeled with initialisms: S C R, S L F, C G C, S C C, P C R, B C C, S F O, A L I C, F X, G C C, P L I C, R L I C, A C R, P T R, E C, I F O, F X S T, U N C, S S, C S T, and C G H.
A vertical color scale on the far right ranges from 0.00 (dark blue) to 0.16 (bright green), with 0.04, 0.08, and 0.12 marked as intermediate points.
Associations between diffusivity measures
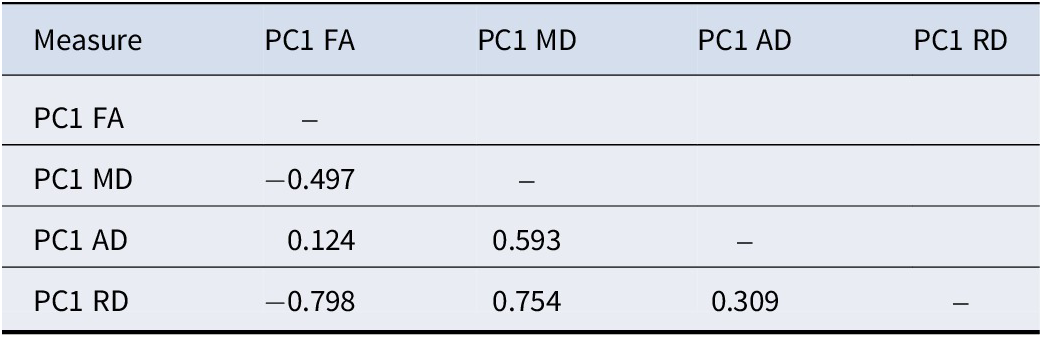
The PC1 scores (one score per participant) for primary diffusivity measures FA and MD were significantly, but not highly correlated (r = −.497, p < .001). The strongest association was between PC1 FA and PC1 RD, (r = −.798, p < .001), while the weakest was between PC1 FA and PC1 AD (r = .124, p < .001). See Table 2 for a matrix table outlining the correlations. The regional patterns contributing to PC1 were strongly correlated/overlapping between the different measures (see Supplementary Table S8).
Correlations between the first principal component for each diffusivity measure

Table 2. Long description
The table consists of five columns and five rows. The column headers from left to right are: Measure, P C 1 F A, P C 1 M D, P C 1 A D, and P C 1 R D.
Row 1: Measure is P C 1 F A. The correlation with itself is marked with a dash.
Row 2: Measure is P C 1 M D. Its correlation with P C 1 F A is minus 0.497.
Row 3: Measure is P C 1 A D. Its correlation with P C 1 F A is 0.124 and with P C 1 M D is 0.593.
Row 4: Measure is P C 1 R D. Its correlation with P C 1 F A is minus 0.798, with P C 1 M D is 0.754, and with P C 1 A D is 0.309.
Initialisms used: F A stands for fractional anisotropy, M D stands for mean diffusivity, A D stands for axial diffusivity, R D stands for radial diffusivity, and P C 1 stands for the first principal component.
Note: AD, axial diffusivity; FA, fractional anisotropy; MD, mean diffusivity; PC1, first principal component; RD, radial diffusivity. Color coding indicates direction and strength of association.
Associations between PCA and system and clinical level variables
Higher BMI was associated with lower PC1 FA and greater PC1 RD (see Table 2; Supplementary Tables S9 and S10; Supplementary Figures S4–S7). In contrast, diagnosis of BD was associated with greater PC1 MD, and a trend for greater PC1 AD (p = 0.070; see Table 3; Supplementary Tables S11 and S12; Supplementary Figures S4–S7). Older age and female sex were negatively associated with lower PC1 FA, lower PC1 AD, and greater PC1 RD (see Table 3; Supplementary Tables S9, S10, and S12; Supplementary Figures S4–S7). There were no diagnostic group-by-BMI interactions that significantly predicted PC1 for any measure. Additionally, in the BD group only, prescription of antiepileptics was associated with lower PC1 FA, higher PC1 MD, and higher PC1 RD (see Table 3; Supplementary Tables S9–S11). There was no association between antipsychotics or lithium and any of the measures (see Table 3).
Standardized estimates and confidence intervals for associations between system-level and clinical variables and first principal component, and number of FDR-adjusted significant regions of interest for each diffusivity measure

Table 3. Long description
The table is organized into nine columns. The first column lists variables, followed by pairs of columns for P C 1 and R O I for four diffusivity measures: F A, M D, A D, and R D. Asterisks indicate significance at p less than 0.05.
Full sample section:
* Group (B D): M D P C 1 is 0.28 [0.19, 0.37] with 14 significant R O I s.
* B M I: F A P C 1 is -0.07 [-0.11, -0.03] with 10 R O I s; R D P C 1 is 0.05 [0.01, 0.09] with 2 R O I s.
* Sex (F): F A P C 1 is -0.29 [-0.38, -0.21] with 16 R O I s; A D P C 1 is -0.20 [-0.29, -0.12] with 14 R O I s; R D P C 1 is 0.17 [0.08, 0.25] with 14 R O I s.
* Age: F A P C 1 is -0.31 [-0.35, -0.26] with 19 R O I s; M D P C 1 is 0.07 [0.03, 0.11] with 19 R O I s; A D P C 1 is -0.21 [-0.26, -0.17] with 17 R O I s; R D P C 1 is 0.20 [0.16, 0.24] with 20 R O I s.
Patient sample section:
* Sex (F): F A P C 1 is -0.29 [-0.46, -0.11] with 11 R O I s; A D P C 1 is -0.31 [-0.49, -0.13] with 7 R O I s.
* Age: F A P C 1 is -0.28 [-0.39, -0.18] with 16 R O I s; M D P C 1 is 0.17 [0.06, 0.29] with 11 R O I s; A D P C 1 is -0.07 [-0.17, 0.04] with 4 R O I s; R D P C 1 is 0.19 [0.12, 0.27] with 18 R O I s.
* Antiepileptic: F A P C 1 is -0.35 [-0.53, -0.18] with 10 R O I s; M D P C 1 is 0.22 [0.02, 0.41] with 4 R O I s; R D P C 1 is 0.24 [0.12, 0.37] with 9 R O I s.
Other variables including Diagnosis B D I I, Lithium, Antipsychotic, Antidepressant, Age of onset, and Psychosis show no significant P C 1 associations.
Note: AD, axial diffusivity; BD, bipolar disorders; BMI, body mass index; F, female; FA, fractional anisotropy; MD, mean diffusivity; PC1, first principal component; RD, radial diffusivity. Significance is indicated by an asterisk (p < .0.05, *)
Comparative analyses
To better understand the PCA, we compared the PCA results to regional analyses of individual white matter tracts (see Supplementary Figures S8–S11; Supplementary Tables S13 and S14). There was general agreement between PCA and ROI analyses, such that when we saw an association between a predictor and PC1, the same predictor was also associated with many ROIs. This was true for the association between MD and BD, as well as FA and BMI. Similarly, when there was no association between a predictor and PC1, there were few ROIs associated with that predictor, which was the case for MD with BMI. There was a discrepancy between PCA and ROI analyses for diagnosis of BD and FA. Specifically, while we did not see an association between PC1 FA and BD, BD was associated with 9 out of 22 ROIs (see Table 3). This discrepancy was likely explained by the fact that white matter tracts associated with BD were different tracts than those contributing to PC1, where a Spearman’s rank-order correlation between the PC1 loadings across tracts and ROIs ranked based on strength of association with BD was not significant (r = −0.04, p = 0.852).
Discussion
We conducted PCA on four white matter diffusivity measures FA, MD, AD, and RD across participants with BD and healthy controls in a mega-analysis of 2 166 participants from 16 international research sites. The first PC explained a significant proportion of variance in each measure across tracts (32.7% to 48.9%). The regions that contributed most to PC1 across all measures included some of the largest white matter tracts, such as the superior longitudinal fasciculus, superior and posterior corona radiata, and internal capsule. Importantly, the primary diffusivity measures, FA and MD, were significantly, but not highly correlated, indicating that these measures are complementary. In line with this, different extra-diagnostic variables were linked with PC1 of different diffusivity measures. Age was associated with PC1 for all four diffusivity measures, while antipsychotic medications and sex were linked with three measures (FA, MD, RD), followed by obesity (FA, RD), while diagnosis of BD was only associated with MD.
Obesity-related FA white matter abnormalities are well documented in the general population, but fewer studies have investigated additional measures like MD, AD, and RD (Dietze, McWhinney, Radua, & Hajek, Reference Dietze, McWhinney, Radua and Hajek2023). Obesity is associated with lower FA in individual white matter tracts in both the general population and BD (Dietze, McWhinney, Radua, & Hajek, Reference Dietze, McWhinney, Radua and Hajek2023; Dietze et al., Reference Dietze, McWhinney, Favre, Abé, Alexander, Barkhau, Benedetti, Berk, Bøen, Boye, Brosch, Bülow, Calderoni, Caligiuri, Canales-Rodríguez, Cannon, Caseras, Chaim-Avancini, Ching and Van Rheenen2024), which aligns with our association between BMI and PC1 FA and the association between BMI and FA in 10 tracts. Lower FA in obesity was related to higher RD, in keeping with other studies showing FA and RD changes in obesity (Stephanie Kullmann et al., Reference Kullmann, Callaghan, Heni, Weiskopf, Scheffler, Häring, Fritsche, Veit and Preissl2016; Mazza et al., Reference Mazza, Poletti, Bollettini, Locatelli, Falini, Colombo and Benedetti2017; Mueller et al., Reference Mueller, Anwander, Möller, Horstmann, Lepsien, Busse, Mohammadi, Schroeter, Stumvoll, Villringer and Pleger2011; Papageorgiou et al., Reference Papageorgiou, Astrakas, Xydis, Alexiou, Bargiotas, Tzarouchi, Zikou, Kiortsis and Argyropoulou2017; Xu et al., Reference Xu, Li, Lin, Sinha and Potenza2013). Previous findings regarding MD in obesity are inconsistent, with some studies reporting lower MD (Karlsson et al., Reference Karlsson, Tuulari, Hirvonen, Lepomäki, Parkkola, Hiltunen, Virtanen, Nuutila and Nummenmaa2013; Kullmann et al., Reference Kullmann, Callaghan, Heni, Weiskopf, Scheffler, Häring, Fritsche, Veit and Preissl2016), some reporting higher MD (Figley et al., Reference Figley, Asem, Levenbaum and Courtney2016; Kullmann et al., Reference Kullmann, Callaghan, Heni, Weiskopf, Scheffler, Häring, Fritsche, Veit and Preissl2016; Shott et al., Reference Shott, Cornier, Mittal, Pryor, Orr, Brown and Frank2015; Xu et al., Reference Xu, Li, Lin, Sinha and Potenza2013), and others finding no significant obesity-related MD differences (Cárdenas et al., Reference Cárdenas, Madinabeitia, Vera, de Teresa, Alarcón, Jiménez and Catena2020; Ottino-González et al., Reference Ottino-González, Jurado, García-García, Segura, Marqués-Iturria, Sender-Palacios, Tor, Prats-Soteras, Caldú, Junqué, Pasternak and Garolera2018; Papageorgiou et al., Reference Papageorgiou, Astrakas, Xydis, Alexiou, Bargiotas, Tzarouchi, Zikou, Kiortsis and Argyropoulou2017; Samara et al., Reference Samara, Murphy, Strain, Rutlin, Sun, Neyman, Sreevalsan, Shimony, Ances, Song, Hershey and Eisenstein2020; van Bloemendaal et al., Reference van Bloemendaal, Ijzerman, ten Kulve, Barkhof, Diamant, Veltman and van Duinkerken2016), all with different white matter tracts. Inconsistency in the direction and location of MD alterations in obesity might explain why we did not see an association between PC1 MD and BMI, and why we saw MD in only a single tract (fornix) was associated with obesity in ROI analysis. The fornix has been implicated in obesity in previous literature (Kullmann et al., Reference Kullmann, Schweizer, Veit, Fritsche and Preissl2015; Metzler-Baddeley et al., Reference Metzler-Baddeley, Baddeley, Jones, Aggleton and O’Sullivan2013; Xu et al., Reference Xu, Li, Lin, Sinha and Potenza2013), but this effect may be inflated due to small sample sizes (Dietze et al., Reference Dietze, McWhinney, Radua and Hajek2023) and may disappear when accounting for vascular/inflammatory risk factors and blood markers (Bettcher et al., Reference Bettcher, Walsh, Watson, Miller, Green, Patel, Miller, Neuhaus, Yaffe and Kramer2013). Therefore, obesity is associated with FA but not with a consistent and diffuse pattern of MD changes.
We found that BD was only associated with higher PC1 MD. This finding was replicated in our ROI analysis, where 14 out of 22 white matter tracts showed higher MD in BD. Our results support previous literature citing a widespread association between MD and BD (Barysheva et al., Reference Barysheva, Jahanshad, Foland-Ross, Altshuler and Thompson2013; Canales-Rodríguez et al., Reference Canales-Rodríguez, Verdolini, Alonso-Lana, Torres, Panicalli, Argila-Plaza, Rodriguez-Cano, Montoro, Garcia-Ruiz, Jimenez, Varo, Lluch, del Mar Bonnin, Maluf, Pujol, Guarner, Sarró, Vieta, Vilella and Pomarol-Clotet2023; Macritchie et al., Reference Macritchie, Lloyd, Bastin, Vasudev, Gallagher, Eyre, Marshall, Wardlaw, Ferrier, Moore and Young2010). This finding suggests researchers should not selectively use FA when analyzing DTI data in BD. We did not see an association between PC1 FA and BD. This is in clear contrast with many studies documenting FA changes in BD (Barysheva et al., Reference Barysheva, Jahanshad, Foland-Ross, Altshuler and Thompson2013; Koshiyama et al., Reference Koshiyama, Fukunaga, Okada, Morita, Nemoto, Usui, Yamamori, Yasuda, Fujimoto, Kudo, Azechi, Watanabe, Hashimoto, Narita, Kusumi, Ohi, Shimada, Kataoka, Yamamoto and Hashimoto2019; Podwalski et al., Reference Podwalski, Szczygieł, Tyburski, Sagan, Misiak and Samochowiec2021). There are several potential explanations for this discrepancy. The PCA represents the network architecture of the brain as a connected network, whereas ROI results represent individual tract findings without accounting for the larger connected nature of the brain. As such, these are complementary approaches, and their combination provides better interpretation than one or the other alone. Perhaps the number of regions associated with BD is too small to demonstrate change in PCA. This is not supported by our regional analyses, where BD was associated with lower FA in 9 out of 22 tracts, consistent with other studies (Favre et al., Reference Favre, Pauling, Stout, Hozer, Sarrazin, Abé, Alda, Alloza, Alonso-Lana, Andreassen, Baune, Benedetti, Busatto, Canales-Rodríguez, Caseras, Chaim-Avancini, Ching, Dannlowski, Deppe and Houenou2019; Mazza et al., Reference Mazza, Poletti, Bollettini, Locatelli, Falini, Colombo and Benedetti2017). Alternatively, perhaps tracts associated with BD are different from tracts constituting the correlated pattern of tracts as captured by PCA. Indeed, tracts with lower FA associated with BD in the ROI analysis were not related to the loadings of PC1 FA. These findings suggest BD is associated with FA in a range of white matter tracts, but these changes span across tracts which are not closely related and thus do not show as abnormal PC1 FA.
We also observed associations between antiepileptics and PC1 FA, MD, and RD, as well as across many regions in ROI analyses. In contrast, we did not see associations between PC1 for any diffusivity measure and antipsychotics or lithium. In the ROI analysis, we found prescription of lithium was associated with higher FA in three white matter tracts, and antipsychotics with lower FA in one tract, which did not survive FDR-adjustment. The association with antiepileptics but not antipsychotics is in accordance with the largest previous study of white matter microstructure from ENIGMA-BD (Favre et al., Reference Favre, Pauling, Stout, Hozer, Sarrazin, Abé, Alda, Alloza, Alonso-Lana, Andreassen, Baune, Benedetti, Busatto, Canales-Rodríguez, Caseras, Chaim-Avancini, Ching, Dannlowski, Deppe and Houenou2019). In this prior study, there is a discrepancy regarding lithium effects, which was associated with higher FA in 11 tracts (Favre et al., Reference Favre, Pauling, Stout, Hozer, Sarrazin, Abé, Alda, Alloza, Alonso-Lana, Andreassen, Baune, Benedetti, Busatto, Canales-Rodríguez, Caseras, Chaim-Avancini, Ching, Dannlowski, Deppe and Houenou2019). This discrepancy is likely related to differences in sample size and statistical power, where the Favre et al. study had a much larger sample size, with 824 individuals with BD prescribed lithium. In our study, 398 individuals with BD were prescribed lithium. Our results are in line with findings from a large COCORO consortium study, which also did not show links between antipsychotics or lithium and any diffusivity measures (Koshiyama et al., Reference Koshiyama, Fukunaga, Okada, Morita, Nemoto, Usui, Yamamori, Yasuda, Fujimoto, Kudo, Azechi, Watanabe, Hashimoto, Narita, Kusumi, Ohi, Shimada, Kataoka, Yamamoto and Hashimoto2019). While this suggests antiepileptics affect diffusivity measures, effects of antipsychotics or lithium are much smaller, requiring larger sample sizes to become significant (De Prisco & Vieta, Reference De Prisco and Vieta2024). Any effects of lithium or antipsychotics may also be regional and thus not captured by PCA.
Our study replicates previous associations between age, sex, and diffusivity measures. We found age-related alterations in white matter microstructure with lower PC1 FA and AD, and higher PC1 MD and RD in older age. This finding is in line with a much-replicated previously reported pattern (Behler, Kassubek, & Müller, Reference Behler, Kassubek and Müller2021; Inano et al., Reference Inano, Takao, Hayashi, Abe and Ohtomo2011; Matijevic & Ryan, Reference Matijevic and Ryan2021). Our study exhibited patterns of sexual dimorphism, with lower FA and AD, and higher RD in females, while both sexes showed comparable MD, consistent with other studies (Hsu et al., Reference Hsu, Leemans, Bai, Lee, Tsai, Chiu and Chen2008; Inano et al., Reference Inano, Takao, Hayashi, Abe and Ohtomo2011).
Our findings suggest that DTI metrics offer complementary information, supported by our correlation analysis where FA and MD were only moderately negatively correlated. We cannot compare this with existing literature, which has looked at correlations between diffusivity measures in only a regionally specific manner (Chen, Li, & Hindmarsh, Reference Chen, Li and Hindmarsh2001; Pfefferbaum, Adalsteinsson, & Sullivan, Reference Pfefferbaum, Adalsteinsson and Sullivan2005). Regional dependencies in FA and MD emphasize the importance of summarizing diffusivity measures with multivariate techniques. As our analysis was not dependent on specific regions, it provides a better approximation of associations between predictors and general white matter alterations. Due to differing patterns of associations between specific diffusivity measures and specific variables, researchers should use the full palette of these measures and not just one.
Diffusivity measures should be interpreted with caution. Generally, lower FA is associated with higher MD and RD (Alexander et al., Reference Alexander, Lee, Lazar and Field2007; Huston & Field, Reference Huston and Field2013; Podwalski et al., Reference Podwalski, Szczygieł, Tyburski, Sagan, Misiak and Samochowiec2021), which is in keeping with our results. However, lower FA can be interpreted in several ways, including lower white matter fiber density, loss of axonal structural organization, or accumulation of obstacles to diffusion due to membrane damage (Beaulieu & Allen, Reference Beaulieu and Allen1994). Typically, AD is more sensitive to axonal damage and loss, whereas RD has been associated with demyelination (Harsan et al., Reference Harsan, Poulet, Guignard, Steibel, Parizel, De Sousa, Boehm, Grucker and Ghandour2006; Song et al., Reference Song, Sun, Ramsbottom, Chang, Russell and Cross2002, Reference Song, Yoshino, Le, Lin, Sun, Cross and Armstrong2005; Tyszka et al., Reference Tyszka, Readhead, Bearer, Pautler and Jacobs2006; Winklewski et al., Reference Winklewski, Sabisz, Naumczyk, Jodzio, Szurowska and Szarmach2018). We found lower FA and higher RD in obesity, suggesting possible demyelination. Mechanisms of demyelination in obesity may include systemic inflammation (Stȩpień et al., Reference Stȩpień, Stȩpień, Wlazeł, Paradowski, Banach and Rysz2014), activation of microglia (Baufeld et al., Reference Baufeld, Osterloh, Prokop, Miller and Heppner2016; De Souza et al., Reference De Souza, Araujo, Bordin, Ashimine, Zollner, Boschero, Saad and Velloso2005), oxidative stress (Ottino-González et al., Reference Ottino-González, Jurado, García-García, Segura, Marqués-Iturria, Sender-Palacios, Tor, Prats-Soteras, Caldú, Junqué, Pasternak and Garolera2018), and microvascular, insulin, or glucose changes (Cox et al., Reference Cox, Lyall, Ritchie, Bastin, Harris, Buchanan, Fawns-Ritchie, Liewald, Gale, Wardlaw, McIntosh, Tucker-Drob, Pell, Alloza, Neilson, Whalley, de Nooij, Barbu, Lawrie and Deary2019; Hajek et al., Reference Hajek, Calkin, Blagdon, Slaney, Uher and Alda2014; Van Gaal, Mertens, & De Block, Reference Van Gaal, Mertens and De Block2006; Williams et al., Reference Williams, An, Beason-Held, Huo, Ferrucci, Landman and Resnick2019). For BD, we found higher MD with a trend in AD, which is a pattern indicative of axonal loss. This could be related to the mechanisms of inflammation (Benedetti et al., Reference Benedetti, Aggio, Pratesi, Greco and Furlan2020), excitotoxicity (Rao, Harry, Rapoport, & Kim, Reference Rao, Harry, Rapoport and Kim2009), oxidative stress (Andreazza et al., Reference Andreazza, Kauer-Sant’Anna, Frey, Bond, Kapczinski, Young and Yatham2008; Scaini et al., Reference Scaini, Rezin, Carvalho, Streck, Berk and Quevedo2016), and mitochondrial dysfunction (Stork & Renshaw, Reference Stork and Renshaw2005).
The results of this study have both research and clinical implications. It is important for researchers to be mindful that diffusivity measures are not one-size-fits-all. Different clinical or anthropometric measures may be linked with different diffusivity indices. The absence of an association between MD and BMI does not mean BMI is not associated with white matter alterations, as it is widely associated with FA. Additionally, the effect of BD might have been amplified in previous studies not adjusting for other factors like BMI or prescribed medications (Dietze et al., Reference Dietze, McWhinney, Favre, Abé, Alexander, Barkhau, Benedetti, Berk, Bøen, Boye, Brosch, Bülow, Calderoni, Caligiuri, Canales-Rodríguez, Cannon, Caseras, Chaim-Avancini, Ching and Van Rheenen2024). To obtain an accurate assessment of the effect of BD on brain correlates, future studies need to properly account for additional factors, which affect brain structure and are frequent in BD. Also, for complex disorders associated with network alterations, multivariate analyses, such as PCA, may complement ROI analyses, which treat each region independently. Clinicians should be mindful that other factors, including modifiable ones, such as obesity, may be impacting the brain structure of their patients and could impact clinical outcomes, although this will require future research. In addition, prescription of antiepileptic medications was negatively associated with most diffusivity measures in many regions; thus, it is important for clinicians to be aware of brain alterations associated with medications.
In a large multisite legacy study, we are limited to compiling data available across sites. Depth of phenotyping is therefore necessarily limited and thus we could not include and analyze additional metabolic, blood-based biomarkers, and details about comorbidities such as hypertension and diabetes. Medication information such as dosage, history of medications, and date of prescription was not available. As these datasets were independently collected and we did not have access to raw whole-brain data, we could not use advanced DTI models or whole-brain analyses, which could better help understand these white matter abnormalities in BD. Sharing raw whole-brain data is challenging due to ethics, but sharing DTI-derived features is much easier.
A strength of this study is the large sample size. Furthermore, the international, multisite nature of the ENIGMA data ensures generalizability and sufficient range of the additional variables. Our study benefited from including multiple diffusivity measures of FA, MD, AD, and RD. Although FA has been widely analyzed in psychiatric mood disorders (Favre et al., Reference Favre, Pauling, Stout, Hozer, Sarrazin, Abé, Alda, Alloza, Alonso-Lana, Andreassen, Baune, Benedetti, Busatto, Canales-Rodríguez, Caseras, Chaim-Avancini, Ching, Dannlowski, Deppe and Houenou2019; Kelly et al., Reference Kelly, Jahanshad, Zalesky, Kochunov, Agartz, Alloza, Andreassen, Arango, Banaj, Bouix, Bousman, Brouwer, Bruggemann, Bustillo, Cahn, Calhoun, Cannon, Carr, Catts and Donohoe2018; van Velzen et al., Reference van Velzen, Kelly, Isaev, Aleman, Aftanas, Bauer, Baune, Brak, Carballedo, Connolly, Couvy-Duchesne, Cullen, Danilenko, Dannlowski, Enneking, Filimonova, Förster, Frodl, Gotlib and Schmaal2019), this is the first time MD, AD, and RD have been comprehensively analyzed in a large BD sample. This is also the first time, to our knowledge, that PCA has been applied to all four of FA, MD, AD, and RD measures in a large sample of BD participants.
To conclude, we found that FA, MD, AD, and RD, when analyzed across tracts by PCA, show unique associations with specific demographic and clinical predictors. The inclusion of PCA as a method of analysis can provide complementary insights into brain structure compared with ROI analyses. Obesity was associated with lower FA and higher RD. The presence of BD was only associated with higher MD, which contrasts with prior mass-univariate studies. Treatment with antiepileptics may inflate the statistical effects of BD on white matter. By using all diffusivity measures and accounting for additional clinical factors, we can gain new insights into brain correlates of SMI. Future research should investigate histological underpinnings of these white matter abnormalities in BD using animal models or post-mortem human studies.
Supplementary material
The supplementary material for this article can be found at http://doi.org/10.1017/S0033291726105522.
Acknowledgments
We would like to acknowledge the late Professor Dan J. Stein for his longstanding leadership and collaboration within ENIGMA-Bipolar Working Group and for his invaluable contributions to psychiatry, neuroscience, and mental health research. His intellectual generosity, mentorship, and unwavering support shaped this work and the broader field in lasting ways. His scientific legacy and his kindness to colleagues continue to inspire us.
Data availability statement
Data are available upon request, but are not made public due to ethics board approval.
Code availability
All analyses were conducted in R version 4.1.1. Code is available upon request.
Author contribution
The authors made the following contributions. Conceptualization: L.M.F.D., T.H., S.R.M., P.M.T., P.F., J.H.; Formal Analysis: L.M.F.D., T.H., S.R.M., P.M.T., P.F., J.H.; Data curation: L.M.F.D., T.H., S.R.M., P.M.T., P.F., J.H.; Writing - review & editing: L.M.F.D., T.H., S.R.M., P.M.T., P.F., J.H.; Final approval: L.M.F.D., T.H., S.R.M., P.M.T., P.F., J.H.
Funding statement
We gratefully acknowledge the following contributions and research funding sources that made this study possible: UD with MNC and FOR2107-Muenster was supported by the German Research Foundation (DFG, grant FOR2107 DA1151/5-1, DA1151/5-2, DA1151/9-1, DA1151/10-1, DA1151/11-1; DA1151/21-1 to UD; SFB/TRR 393, project grant no 521379614) and the Interdisciplinary Center for Clinical Research (IZKF) of the medical faculty of Münster (grant Dan3/016/26). T.K. with FOR2107-Marburg was funded in part by the consortia grants from the German Research Foundation (DFG) FOR 2107 and SFB/TRR 393 to T.K., Marburg, Germany.
The San Raffaele site was supported by the Italian Ministry of Health RF-2011-02350980 project. M.L. at KI was funded by the St. Göran study, which was supported by grants from the Swedish Research Council (2022-01643), the Swedish foundation for Strategic Research (KF10-0039), Hjärnfonden/the Swedish Brain foundation (FO2022-0217), and the Swedish Government under the LUA/ALF agreement (ALF 20200036, ALFGBG-965444), and wishes to thank the staff at the Bipolar Clinics at Sahlgrenska University Hospital in Gothenburg, Sweden, and the Affective disorder unit at Northern Stockholm Psychiatry, Sweden, including the study coordinator Martina Wennberg, study nurses Lena Lundberg, Benita Gezelius, Annika, Blom and Therese Turesson, and data manager Mattias Kardell, and finally thank Rouslan Sitnikov for help with the MRI protocol. P.M., with the UNSW cohort, was supported by Australian NHMRC Investigator Grant (1177991); Australian NHMRC Partnership Project Grant (1195643); Australian NHMRC Centre of Research Excellence (2015747); and the Lansdowne Foundation; Good Talk charity.
K.S., with IMHBD Singapore, was supported by a research grant from the Singapore Bioimaging Consortium (RP C009/06) awarded to KS. EV and EPC contributed to the IDIBAPS (Clinic) and Barcelona (FIGMAG/Clinic) studies. MRI acquisition was supported by the Spanish Ministry of Science and Innovation; Instituto de Salud Carlos III (PI15/00283, PI19/00394 and PI22/00261), integrated into the Plan Nacional de I + D + I and co-financed by ERDF Funds from the European Commission (‘A Way of Making Europe’); CIBERSAM; and the CERCA Program/Generalitat de Catalunya, as well as the Secretaria d’Universitats i Recerca del Departament d’Economia I Coneixement and Departament de Salut (SLT002/16/00331, SLT006/17/00357, 2017SGR1365, 2021 SGR 01128).
The University of Barcelona – Hospital Clinic site thanks the support of the Spanish Ministry of Science and Innovation (PI21/00787), integrated into the Plan Nacional de I + D + I and co-financed by the Instituto de Salud Carlos III – Subdirección General de Evaluación and the Fondo Europeo de Desarrollo Regional (FEDER); the Secretaria d’Universitats i Recerca del Departament d’Economia i Coneixement (2021-SGR-01358); CERCA Program, Generalitat de Catalunya; La Marató-TV3 Foundation grants 202234-30; the European Union Horizon 2020 research and innovation program (H2020-EU.3.1.1. – Understanding health, wellbeing and disease; H2020-EU.3.1.3. Treating and managing disease, Grant 945151; HORIZON.2.1.1 –Health throughout the Life Course, Grant 101057454; and EIT Health, EDIT-B project).
T.V.R. at COGSBD in Melbourne was supported by an Al and Val Rosenstrauss Fellowship from the Rebecca L. Cooper Medical Research Foundation. Other co-authors from his team may have different affiliations. The authors acknowledge the facilities and scientific assistance of the National Imaging Facility, a National Collaborative Research Infrastructure Strategy (NCRIS) capability, at the Swinburne Neuroimaging Facility, Swinburne University of Technology.
B.G. from the University of Toronto CYBD received research grants from Brain Canada, the Canadian Institutes of Health Research, and the Heart and Stroke Foundation. He also acknowledges his position as RBC Investments Chair in Children’s Mental Health and Developmental Psychopathology at CAMH, a joint Hospital-University Chair between the University of Toronto, CAMH, and the CAMH Foundation.
C.P. in Geneva received support from the Swiss National Science Foundation: Grant Number 51NF40-158776 and Grant Number 32003B_156914. F.H., with UCT CIAM, was supported by the University Research Committee, University of Cape Town, and South African funding bodies National Research Foundation and Medical Research Council. B.C.M.H. is supported by a ZonMw Postdoc Fellowship (Netherlands Organization for Health Research and Development; Grant 636320010) and by the European Union H2020 EU.3.1.1 Grant 754740 MOODSTRATIFICATION. T.E. was supported by the South-Eastern Norway Regional Health Authority (#2021041).
J.C.S. in Texas was partially supported by NIMH (1R01MH085667-01A1), John S. Dunn Foundation (Houston, Texas), and Pat Rutherford Chair in Psychiatry (UTHealth Houston). M.P. in Grenoble was supported by the Grenoble MRI facility IRMaGe, which is partly funded by the French program ‘Investissement d’Avenir’ run by the ‘Agence Nationale pour la Recherche’; grant ‘Infrastructure d’avenir en Biologie Santé – ANR-11-INBS-0006’. M.B. at Deakin is supported by a National Health and Medical Research Council (NHMRC) Senior Principal Research Fellowship and a Leadership 3 Investigator grant (1156072 and 2017131). DMC and CM at NUIG in Galway are supported by the Health Research Board (HRA-POR-324) awarded to Prof Dara M. Cannon.
O.A. was supported by the Research Council of Norway (#324499, #326813, #324252), NordForsk (#164218), KG Jebsen Stiftelsen, and NIH 1R01MH129742 - 01. C.C. with the ENIGMA consortium received funding from the National Institutes of Health (NIH) Consortium grant U54 EB020403, supported by a cross-NIH alliance that funds Big Data to Knowledge Centers of Excellence (BD2K); R01 MH129742-01; R01 MH116147. M.P. acknowledges grant funding relevant to the study: R37MH1000401, The Pittsburgh Foundation, The Baszucki Brain Research Fund.
The Paris site was funded by the French Agence Nationale Pour la Recherche (Labex BioPsy and ANR-DFG FUNDO projects) and by Fondation pour la Recherche Biomédicale (Bioinformatique pour la biologie). T.H. in Halifax was supported by the Canadian Institutes of Health Research grants #142255,180449, 186254, Nova Scotia Health Research Foundation, Dalhousie Clinical Research Scholarship to T.H., Ministry of Health of the Czech Republic, project no. NW25-04-00081, Brain & Behavior Research Foundation (formerly NARSAD); 2007 Young Investigator and 2015 Independent Investigator Awards to TH. P.T., C.R.K.C., L.N., N.J., and S.I.T. were supported by the ENIGMA Bipolar Initiative (R01MH129742; to P.T. and O.A.), and by NIMH grant R01MH131806.
Competing interests
The Texas cohort (J.S.) has received speaking/consulting and/or research grants from: Alkermes (Advisory Board), Boehringer Ingelheim Compass Pathways (Research Grant), Johnson & Johnson (Consultant), LivaNova (Consultant), Relmada (Research Grant), Sunovion (Research Grant), Mind Med (Research Grant). Their work was also partially supported by NIMH (1R01MH085667-01A1), John S. Dunn Foundation (Houston, Texas), and Pat Rutherford Chair in Psychiatry (UTHealth Houston). TE is a consultant to BrainWaveBank and Sunovion and received speaker’s honoraria from Lundbeck and Janssen-Cilag. O.A. is a consultant to Cortechs.ai and Precision Health AS, and received speakers’s honoraria from Janssen, Lundbeck, Otsuka, Lilly.
E.V. has received grants and served as consultant, advisor or CME speaker for the following entities: AB-Biotics, AbbVie, Adamed, Alcediag, Angelini, Biogen, Beckley-Psytech, Biohaven, Boerhinger Ingelheim, Celon Pharma, Compass, Dainippon Sumitomo Pharma, Esteve, Ethypharm, Ferrer, Gedeon Richter, GH Research, GlaxoSmithKline, HMNC, Idorsia, Johnson & Johnson, Lundbeck, Luye Pharma, Medincell, Merck, Newron, Novartis, Orion Corporation, Organon, Otsuka, Roche, Rovi, Sage, Sanofi-Aventis, Sunovion, Takeda, Teva, and Viatris, outside the submitted work.
All other authors report no biomedical financial interests or potential conflicts of interest.




 Open access

