Introduction
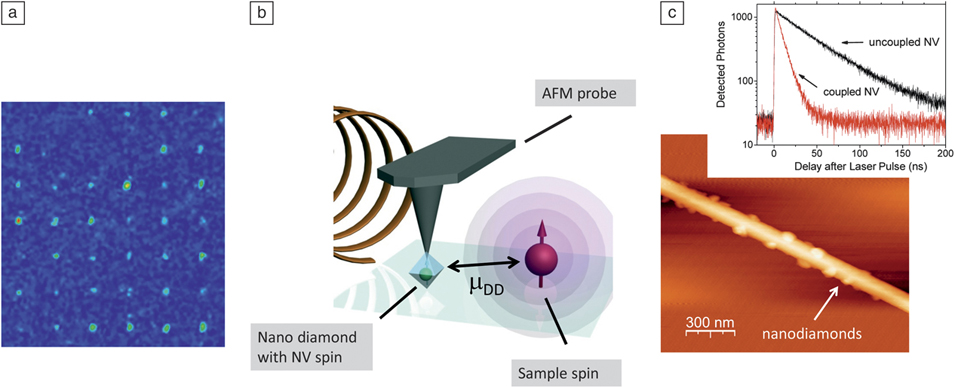
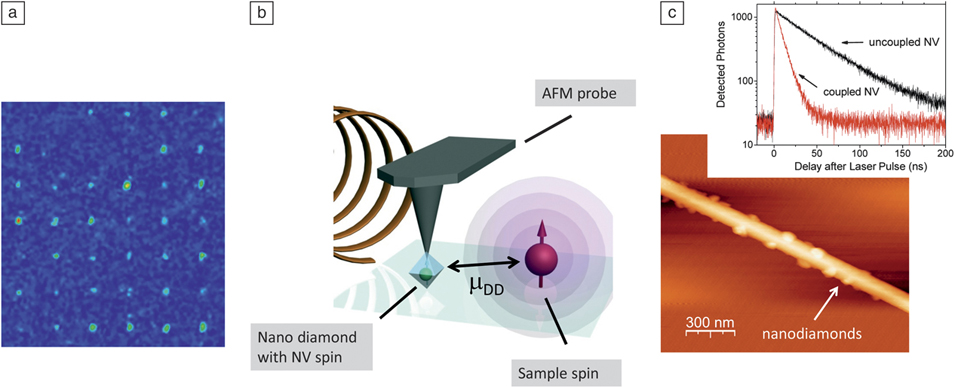
The precise positioning of defects near semiconductor surfaces is a prerequisite for nanoscale magnetometry (where individual defects are used as atomic-sized magnetic sensors, see Figure 1 a), coupling to photonic/plasmonic devices, and for deterministic positioning of qubits to build scalable quantum processors. The first two applications intrinsically require that defects be located near the surface due to physical constraints. In the first, magnetic imaging resolution depends on the sensor-sample distance (in the near field limit) since the magnetic field from single spins decreases as the inverse cube of the separation (Figure 1b). In the second application, efficient optical coupling to plasmonic structures requires that the emitter be located at a distance substantially below the wavelength of light (Figure 1c).Reference Kolesov, Grotz, Balasubramanian, Stöhr, Nicolet, Hemmer, Jelezko and Wrachtrup 1 For the creation of scalable arrays, the restriction to near-surface defects is not a hard limit; however, to date, the most exciting results for controlled implantation and sensing have been obtained with shallow defects.Reference Gaebel, Domhan, Popa, Wittmann, Neumann, Jelezko, Rabeau, Stavrias, Greentree, Prawer, Meijer, Twamley, Hemmer and Wrachtrup 2 – Reference Steinert, Dolde, Neumann, Aird, Naydenov, Balasubramanian, Jelezko and Wrachtrup 6
Nitrogen-vacancy (NV) color centers are particularly interesting in this context owing to the availability of optical readoutReference Jelezko, Gaebel, Popa, Domhan, Gruber and Wrachtrup 7 , Reference Jelezko and Wrachtrup 8 of their spin states and the ability to engineer them close to the diamond surface. Such shallow NV centers are of crucial importance for building multi-qubit systems and sensing applications. Their spin transitions are sensitive to magnetic field fluctuations, and monitoring their energy shiftsReference Taylor, Cappellaro, Childress, Jiang, Budker, Hemmer, Yacoby, Walsworth and Lukin 9 , Reference Degen 10 or dephasingReference Cole and Hollenberg 11 are promising tools for sensing electric and magnetic fields at the nanoscale. This article reviews recent work on the creation of NV centers near the diamond surface and related progress in sensing applications.
(a) Confocal image of an implanted array of nitrogen-vacancy (NV) centers. Distance between centers is 10 μm. Adapted from Reference Reference Meijer, Burchard, Domhan, Wittmann, Gaebel, Popa, Jelezko and Wrachtrup13. (b) NV scanning nanomagnetometer consisting of an AFM tip with attached nanodiamond. The sensitivity limit enables imaging of single spins. (c) Coupling between a NV center and a plasmonic structure. Adapted from Reference Reference Kolesov, Grotz, Balasubramanian, Stöhr, Nicolet, Hemmer, Jelezko and Wrachtrup1.
Positioning of NV centers near the surface
There are currently three avenues for achieving near-surface NV centers: incorporation of a thin layer of NVs into the diamond at the very end of the chemical vapor deposition (CVD) growth process (delta-doping), implantation of nitrogen ions or molecules with low energies, and utilization of small nanodiamonds (see the Introduction article in this issue). Each method has its own advantages and disadvantages. For instance, “as-grown” NV centers created through delta-doping have been shown to possess superior qualities to those created through the damaging implantation processes.Reference Ohno, Heremans, Bassett, Myers, Toyli, Bleszynski Jayich, Palmstrøm and Awschalom 12 Here, the defect layer thickness and depth can be remarkably well controlled, and the defect concentration varied over a wide range. However delta-doping only provides control over the NV position in a single dimension; for creation of two-dimensional arrays, implantation using either a focused spotReference Meijer, Burchard, Domhan, Wittmann, Gaebel, Popa, Jelezko and Wrachtrup 13 or a maskReference Pezzagna, Rogalla, Becker, Jakobi, Dolde, Naydenov, Wrachtrup, Jelezko, Trautmann and Meijer 5 is employed ( Figure 2 a). Alternatively, the diamond substrate can be post-processed to create patterned diamond structures such as nanopillars containing emitters (see the article by Loncar and Faraon in this issue).Reference Babinec, Hausmann, Khan, Zhang, Maze, Hemmer and Lončar 14 – Reference Hausmann, Babinec, Choy, Hodges, Hong, Bulu, Yacoby, Lukin and Lončar 16
(a) Scanning electron microscope image of an implantation mask (mica), manufactured by focused ion beam milling. Adapted from Reference Reference Pezzagna, Rogalla, Becker, Jakobi, Dolde, Naydenov, Wrachtrup, Jelezko, Trautmann and Meijer5. (b) Transmission electron microscope image of a nanodiamond. Adapted from Reference Reference Boudou, Curmi, Jelezko, Wrachtrup, Aubert, Sennour, Balasubramanian, Reuter, Thorel and Gaffet59.

Ion implantation, where nitrogen ions of desired energy are shot at a diamond target, provides precise three-dimensional control over the NV position.Reference Meijer, Burchard, Domhan, Wittmann, Gaebel, Popa, Jelezko and Wrachtrup 13 , Reference Rabeau, Reichart, Tamanyan, Jamieson, Prawer, Jelezko, Gaebel, Popa, Domhan and Wrachtrup 17 The stopping range of implanted nitrogen can be reliably controlled by appropriate choice of ion energy, allowing creation of NV centers with nanometer separation from the diamond surface.Reference Pezzagna, Rogalla, Becker, Jakobi, Dolde, Naydenov, Wrachtrup, Jelezko, Trautmann and Meijer 5 , Reference Meijer, Burchard, Domhan, Wittmann, Gaebel, Popa, Jelezko and Wrachtrup 13 , Reference Rabeau, Reichart, Tamanyan, Jamieson, Prawer, Jelezko, Gaebel, Popa, Domhan and Wrachtrup 17 For example, distances approaching one nanometer from the surface have been achieved using 0.75 keV implantation energy. Recent work has demonstrated implantation into high purity diamond with relatively high yield by post-implantation of carbon, which generated additional vacancies and allowed saturation of implanted nitrogen with vacancies. Optimization of annealing conditions has also increased the coherence time of implanted NVs, which is crucial for magnetometry applications.Reference Naydenov, Reinhard, Lämmle, Richter, Kalish, D’Haenens-Johansson, Newton, Jelezko and Wrachtrup 18 Furthermore, deterministic implantation is possible when combining traditional ion optics with an ion source based on single trapped ions.Reference Meijer, Pezzagna, Vogel, Burchard, Bukow, Rangelow, Sarov, Wiggers, Plümel, Jelezko, Wrachtrup, Schmidt-Kaler, Schnitzler and Singer 19
Another approach is the use of nanodiamonds (Figure 2b), which are particularly attractive for scanning probe architectures,Reference Degen 10 , Reference Maletinsky, Hong, Grinolds, Hausmann, Lukin, Walsworth, Loncar and Yacoby 20 , Reference Balasubramanian, Chan, Kolesov, Al-Hmoud, Tisler, Shin, Kim, Wojcik, Hemmer, Krueger, Hanke, Leitenstorfer, Bratschitsch, Jelezko and Wrachtrup 21 or their deployment as intracellular sensors in biology (see the article by Hall et al.).Reference Hui, Chang, Mohan, Lim, Chen and Chang 22 , Reference Mohan, Chen, Hsieh, Wu and Chang 23 , Reference McGuiness, Yan, Stacey, Simpson, Hall, Maclaurin, Prawer, Mulvaney, Wrachtrup, Caruso, Scholten and Hollenberg 60 Both applications require small nanoparticles, with NV fluorescence already demonstrated in nanocrystals down to 5 nm in diameter.Reference Bradac, Gaebel, Naidoo, Sellars, Twamley, Brown, Barnard, Plakhotnik, Zvyagin and Rabeau 24 , Reference Tisler, Balasubramanian, Naydenov, Kolesov, Grotz, Reuter, Boudou, Curmi, Sennour, Thorel, Börsch, Aulenbacher, Erdmann, Hemmer, Jelezko and Wrachtrup 25 Recent work on optical trappingReference Horowitz, Alemán, Christle, Cleland and Awschalom 26 and mechanical manipulation of fluorescent nanodiamonds also indicates that they could be a viable route to building scalable arrays by positioning nanodiamonds with selected properties next to each other.Reference Barth, Schietinger, Schröder, Aichele and Benson 27 , Reference Schietinger, Schröder and Benson 28
Control of the physical properties of near-surface defects via surface chemistry
Near-surface NV defects require control not only over depth, but also of the diamond surface characteristics for applications in magnetometry and fluorescence resonance energy transfer (FRET) experiments. A crucial element of controlling the diamond surface properties lies in chemical functionalization. As discussed previously, NV centers can be generated in diamond with high accuracy, but for sensing applications, the molecules to be detected must also be brought to the surface of the diamond. To achieve this, nanodiamonds can be chemically bound to the molecule of interest. The first steps toward such functionalization were demonstrated recently for bulk diamondReference Härtl, Schmich, Garrido, Hernando, Catharino, Walter, Feulner, Kromka, Steinmüller and Stutzmann 29 and nanodiamond.Reference Krueger and Lang 30
However, NV centers have been observed to become unstable and turn from the negatively charged NV– state into the undesirable neutral charge state (NV0) when exposed to various kinds of laser illumination,Reference Gaebel, Domhan, Wittmann, Popa, Jelezko, Rabeau, Greentree, Prawer, Trajkov, Hemmer and Wrachtrup 31 – Reference Waldherr, Beck, Steiner, Neumann, Gali, Frauenheim, Jelezko and Wrachtrup 33 in proximity to the surface,Reference Santori, Barclay, Fu and Beausoleil 34 – Reference Rondin, Dantelle, Slablab, Grosshans, Treussart, Bergonzo, Perruchas, Gacoin, Chaigneau, Chang, Jacques and Roch 36 or at high implantation densities.Reference Martin, Grebner, Sigle and Wannemacher 37 , Reference Mita 38 CVD-grown diamond surfaces also show a notable lack of NV fluorescence, extending some tens of microns into the bulk. This has been attributed to either polishing damage or passivation from hydrogen incorporated during the end of the growth.Reference Landstrass and Ravi 39 New techniques such as chemical etching of the damaged surface and using unpolished surfaces in concert with ion implantation has led to the production of near-surface NVs with properties comparable to those in the bulk.Reference Stacey, Simpson, Karle, Gibson, Acosta, Huang, Fu, Santori, Beausoleil, McGuinness, Ganesan, Tomljenovic-Hanic, Greentree and Prawer 40 , Reference Aharonovich, Lee, Magyar, Buckley, Yale, Awschalom and Hu 41
Chemical termination of the diamond surface also influences both the probability to generate and the quality of near-surface defects. Depending on the surface orientation, each surface carbon atom has either one or two dangling bonds, which can be terminated with another chemical group. One example is oxygen termination, which leads to an inverted surface dipole moment and hence to stable NV centers very close to the surface, but the challenge remains to develop atomically characterized and fully passivated surfaces.Reference Stacey, Karle, McGuinness, Gibson, Ganesan, Tomljenovic-Hanic, Greentree, Hoffman, Beausoleil and Prawer 42 Another candidate is hydrogen. It forms a strong, stable bond and can be uniformly terminated giving a homogeneous surface with well-defined characteristics. Unfortunately, the difference in electronegativity between carbon and hydrogen induces an effective surface dipole moment, which shifts the conduction and valence band upward, leading to a negative electron affinity χ ∼ −1 eV.Reference Garrido, Nowy, Härtl and Stutzmann 43
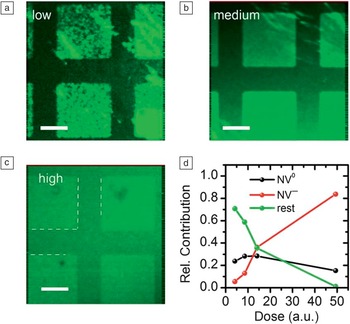
Under ambient conditions, a layer of adsorbed water forms on the diamond surface and, when the surface is hydrogenated, these water molecules accept electrons from the diamond valence band, converting NV– into NV0.Reference Hauf, Grotz, Naydenov, Dankerl, Pezzagna, Meijer, Jelezko, Wrachtrup, Stutzmann, Reinhard and Garrido 44 Electrons are transferred into the adsorbate layer until the Fermi level E F in the diamond has equilibrated with the electrochemical potential μ in the adsorbate layer.Reference Maier, Riedel, Mantel, Ristein and Ley 45 The final result is band bending in close vicinity to the diamond surface and a two-dimensional hole gas below the surface. This has a direct impact on shallow NV centers, as their charge state depends on the position of the Fermi level with respect to the charge transition level. This effect was first measured on nanodiamondsReference Kratochvílová, Taylor, Kovalenko, Fendrych, Řezáčová, Petrák, Záliš, Šebera and Nesládek 46 and later systematically studied for shallow implanted centers in electronic grade single crystalline diamond.Reference Hauf, Grotz, Naydenov, Dankerl, Pezzagna, Meijer, Jelezko, Wrachtrup, Stutzmann, Reinhard and Garrido 44 , Reference Petráková, Nesládek, Taylor, Fendrych, Cígler, Ledvina, Vacík, Štursa and Kučka 47 For nanodiamonds, the NV charge state could be observed through a change in the photoluminescence spectra (see Figure 3 ). The relative amount of NV− increased from below 10% at low N implantation doses to more than 80% at high doses. At the same time, the amount of NV0 decreased only slightly from 30% to below 20%, as shown in Figure 3d. This effect may be used to stabilize the charge state or to sense different chemical environments with nanodiamonds.Reference Petráková, Taylor, Kratochvílová, Fendrych, Vacík, Kučka, Štursa, Cígler, Ledvina, Fišerová, Kneppo and Nesládek 48
(a–c) Confocal scans of a 10 keV implanted diamond surface showing the fluorescence intensity of NV− (650 nm long pass filter, 532 nm excitation at 240 μW) at different implantation doses (1010 cm–2, 1011 cm–2, and 1012 cm–2, corresponding to low, medium, and high, respectively). (c) Dashed lines indicate O- (squares) and H-terminated (channel) regions. The negative electron affinity of the H-terminated regions leads to conversion of NV– to NV0 and thus to reduced fluorescence, but at high doses, this effect is shielded by the electron donating N atoms. Scale bar is 10 μm. (d) Relative contribution to the local fluorescence intensity of NV− and NV0, obtained from fits to spectra of single NV− or NV0 in H-terminated regions. Adapted from Reference Reference Hauf, Grotz, Naydenov, Dankerl, Pezzagna, Meijer, Jelezko, Wrachtrup, Stutzmann, Reinhard and Garrido44.

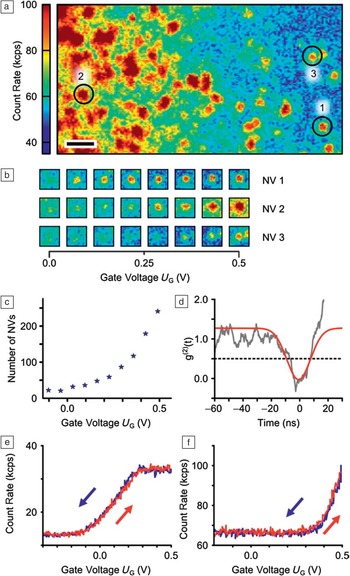
In addition, dynamic control of the NV charge state was demonstrated recently,Reference Grotz, Hauf, Dankerl, Naydenov, Pezzagna, Meijer, Jelezko, Wrachtrup, Stutzmann, Reinhard and Garrido 49 which is desirable for an envisioned quantum sensing device.Reference Toyli, Weis, Fuchs, Schenkel and Awschalom 3 , Reference Pezzagna, Wildanger, Mazarov, Wieck, Sarov, Rangelow, Naydenov, Jelezko, Hell and Meijer 50 The general idea followed the design of a diamond solution-gated field-effect transistor.Reference Dankerl, Lippert, Birner, Stützel, Stutzmann and Garrido 51 An N+-implanted and subsequently H-terminated diamond was immersed into an electrolyte, and a gate voltage was applied between a reference electrode in the electrolyte and the diamond surface. This voltage allowed electrical shifting of the Fermi level at the diamond surface which, at the same time, also changed the surface band bending. Upon varying the gate voltage, single centers could be switched from an unknown non-fluorescent state into the neutral charge state NV0, and the population of an ensemble of centers could be shifted from NV0 to NV–. Upon increasing the gate voltage toward more positive values, an increasing number of NV centers became visible ( Figure 4 a–c). The switching process of selected single centers was monitored as a function of the applied gate voltage (Figure 4e–f). Fluorescence sets in above a certain individual threshold voltage and grows with increasingly positive voltages, as the center is transferred from a non-fluorescent state, possibly NV+, into the fluorescent state NV0. The closer the NV center is to the surface, the more positive gate voltage is required to change its charge state from NV+ to NV0. In total, these findings demonstrate a way to reversibly control the charge state of NV centers in an extremely versatile manner. Furthermore, these results open the way to study formerly unstable or unknown charge states such as NV0 and the positively charged NV+, for which applications have already been proposed.Reference Weber, Koehl, Varley, Janotti, Buckley, Van de Walle and Awschalom 52 , Reference Gali 53
(a) Fluorescence image of a 5 keV spot in a hydrogenated region at gate potential U G = 0.5 V. Scale bar indicates 1 μm. (b) Selected centers at various gate voltages. (c) Number of NV centers visible in the scanned region of (a) at different gate voltages. (d) Photon statistics (correlation function of second order) g(2)(t) measured on a single center (background corrected, U G = 0.5 V). (e–f) Gate voltage dependence of the fluorescence intensity of two single NV centers. Different switching voltages can be attributed to slightly varying depths and nano-environments. Adapted from Reference Reference Grotz, Hauf, Dankerl, Naydenov, Pezzagna, Meijer, Jelezko, Wrachtrup, Stutzmann, Reinhard and Garrido49.

Nanoscale magnetometry
Shallow NV centers in diamond show great promise as nano-magnetometers with unsurpassed resolution and sensitivity under ambient conditions (see the article by Hong et al. in this issue). The NV electron spin is sensitive to magnetic fields and can be read-out optically at the single defect level. In effect, this provides an atomic scale sensor that can be placed a few nanometers from the sample to be imaged, in principle, limited only by the distance of the NV to the diamond surface.
The high magnetic sensitivity of NV stems from its long-lived quantum coherence. Detection of magnetic fields relates to the ability to accurately measure the NV magnetic (Zeeman) energy levels, which have a linewidth inversely proportional to the spin coherence time—thus longer coherence times provide narrower line-widths and better magnetic resolution. Microtesla sensitivities were shown for nanometer-sized nanodiamonds.Reference Maze, Stanwix, Hodges, Hong, Taylor, Cappellaro, Jiang, Gurudev Dutt, Togan, Zibrov, Yacoby, Walsworth and Lukin 54 More recently, coherence times approaching a millisecond have been achieved for NV centers less than 20 nm from the diamond surface, allowing ∼10 nT sensitivity to be achieved during measurement times approaching one second.
The true measure of the NV center’s value as a magnetometer will lie in its ability to measure magnetic fields arising from interesting samples outside the diamond lattice and to do so in circumstances where other techniques are incapable. The detection of free radicals in intracellular compartments of living cells is one example. Recent work with nanodiamonds has shown that the detection of electronic spins in solution is possible with NV centers. The sensitivity of a few thousand spins indicates that in vivo detection could be feasible using an ensemble of NV centers implanted close to the diamond surface.Reference Steinert, Dolde, Neumann, Aird, Naydenov, Balasubramanian, Jelezko and Wrachtrup 6 Recent work by Steinert et al. with a diamond microfluidic flow cell demonstrated nanovolume chemical sensitivity. In this work, the authors also demonstrated imaging spin-labeled HeLa (human cancer) cell compartments with ∼250 nm resolution. In addition, NV centers could be used to detect neuron action potentials or ion channel function, although these remain in the concept stage (see the article by Hall et al. in this issue for details).Reference Hall, Beart, Thomas, Simpson, McGuinness, Cole, Manton, Scholten, Jelezko, Wrachtrup, Petrou and Hollenberg 55 Imaging of single spins under ambient conditions is another driver of NV magnetometry. Grotz et al. have demonstrated detection of single electron spins at the diamond surface.Reference Grotz, Beck, Neumann, Naydenov, Reuter, Reinhard, Jelezko, Wrachtrup, Schweinfurth, Sarkar and Hemmer 56 More recent experiments have shown detection of nuclear spins with nanometer resolution.
Optical sensing using shallow defects
The ability to position single optically active defects close to the diamond surface will also provide a way to use FRET as a contrast mechanism for sensing of external, optically active molecules. Diamond-based FRET microscopy and sensing has an important advantage compared to traditional approaches that use energy transfer between organic molecules owing to the unprecedented photostability of diamond defects. FRET between NV centers in nanodiamonds and acceptor molecules located close to the diamond surface was demonstrated recently in ensembles of nanodiamondsReference Chen, Shu, Kuo, Tzeng and Chang 57 and single nanocrystals.Reference Tisler, Reuter, Lämmle, Jelezko, Balasubramanian, Hemmer, Reinhard and Wrachtrup 58
Summary
The nitrogen-vacancy center is an ideal proximity sensor for a number of applications. For most applications, such as magnetic field sensing, their true potential is only revealed when they are brought into close (i.e., less than 10 nm) proximity to the sample. Controlling the properties of defects close to surfaces is therefore a key issue in diamond defect sensing applications, and solving issues such as photostability, spin decoherence, and relaxation are thus important problems in diamond material science. Successfully meeting these challenges may see the use of diamond defects as sensors with an unprecedented impact on nanoscale metrology.