Party polarization is a central feature of contemporary American politics. Scholars have devoted considerable energy to tracing the rise of polarized voting in Congress and have illuminated the ways in which this elite polarization has reflected and reinforced mass-level ideological sorting (see McCarty's reviewFootnote 1). Yet, polarization's relationship to enduring features of American political institutions—such as federalism—is less understood.Footnote 2
State political parties have been a core element of American federalism since the early nineteenth century. Here, we ask whether state-level issue cleavages and political agendas have become polarized and nationalized, prospects that may transform the federated parties that grew out of the American constitutional system. In particular, we address whether, when, and to what extent polarization has influenced state political agendas—and whether the states are leading or lagging national trends in these respects.
A defining characteristic of American political parties from their inception has been decentralization.Footnote 3 As a consequence, state-level coalitions within each national party might represent quite different societal interests, as well as prioritizing different issues or even taking different positions.Footnote 4 Whether one views the decentralized party system as an assetFootnote 5 or limitation,Footnote 6 it has seemingly been transformed in recent decades. Polarization now pervades the American party system, with state parties increasingly taking divergent positions from one another on important issues.Footnote 7 At the state level, polarization may also go hand in hand with nationalization, a closely related phenomenon. As described in more detail below, we use polarization to refer to systematic divisions in issue positions between the major political parties while using nationalization to refer to the homogeneity of each party's positioning across subnational units. Today's state parties are less autonomous from national-level forces than in prior periods, and as a consequence, they may be more likely to address common issues and adopt common positions.
In other words, a polarized and nationalized environment may reshape state political agendas, as it could encourage state parties to emphasize common partisan agendas nationwide. A nationalized agenda may also foreground certain kinds of issues, as state parties choose to focus on social issues or other issues that resonate across the United States.Footnote 8 Nationalized parties may also de-emphasize precisely the issues on which states have significant governmental authority.Footnote 9 Similarly, nationalized parties might downplay sectoral, economic, or other issues that have a clear regional grounding.Footnote 10 We show that agricultural issues provide one example of this dynamic.
Thus, through multiple channels, polarized and nationalized state political agendas have the potential to limit the coalitional diversity that federalism permits and that some prior scholarship trumpeted. To the extent that such trends are unfolding, they suggest a critical shift in American federalism, one with major implications for contemporary party politics, policymaking, and representation. Still, research on polarization has focused principally on the federal level, and the state-level research that does exist provides a mixed assessment of the extent of polarization and nationalization.Footnote 11
Here, we contribute to these debates about the intertwined forces of the polarization and nationalization of state parties and their political agendas through an analysis of 1,783 state (and national) party platforms issued between 1918 and 2017. In one analysis, we manually annotated the 1,000 most common trigrams—three-word-phrases—appearing in the platforms. Separately, we divided the platforms into 42,020 topical segments manually before using Latent Dirichlet AllocationFootnote 12 to model the topics that occurred throughout unigram and bigram representations of the data. The resulting topics provide a rich representation of the shifting state-level political agenda over 100 years. Note that our analyses measure the language employed in platforms and thus approximate topics and their framing rather than correspond directly to issue positions.
This new data set allows us to answer questions central to the dynamics of state-level polarization and nationalization. First, have Democratic and Republican state party platforms diverged from one another in the topics they emphasize? If so, when did this divergence take hold? Platforms may prove to be a leading indicator of polarized agendas, which could detect state-level developments earlier than more persistent factors such as legislative roll call voting.Footnote 13 Second, how do polarization and nationalization transform the types of issues that the state parties prioritize, whether they are social or economic? Some issues may resonate nationwide in ways that make them well adapted to a nationalized political environment.Footnote 14 Third, do each party's state affiliates address more similar topics in their platforms today than in prior decades, and if so, what was the timing of this nationalizing shift?Footnote 15 And finally, what is the sequencing—do trends in polarization and agenda setting at the state level follow those in national politics, or are they closer to contemporaneous? Put differently, to what extent are state parties taking their cues from their national counterparts? Answering that question will help identify the mechanisms at workFootnote 16 and assess claims about the parties as integrated but relatively unstructured national networks.Footnote 17
In our analyses, we take growing differences between the topics addressed by state Democratic and Republican parties as evidence of polarization. The presence of such trends across many states is one facet of nationalization; increased interstate similarity in platform topics within each party is another. Empirically, we first report descriptive trends. In recent decades, there is clear evidence of polarization in the trigrams (or three-word phrases) employed by Democrats and Republicans. Additionally, the share of novel phrases that debuted in national platforms is declining. This means that many of the recent innovative phrases in state platforms have originated at the state level. It also provides an initial suggestion that nationalization is not a top-down process driven by national party elites.Footnote 18
Turning to the topic models, we find that political parties start to polarize sharply in the topics they discuss in the mid-1990s. From the 1920s through the 1960s, the two parties talked about similar topics in their state platforms, with only modest differences in emphasis for most issues. There was increased separation in the late 1970s and 1980s. But a dramatic gap opened between the two parties at the state level in the 1990s, peaking and then stabilizing in the early 2000s.
Topic models produce a dizzying array of outputs, so we structure our discussion by focusing on longstanding issues including labor rights, civil rights, agriculture, and abortion. The topics with the greatest increase in party distinctiveness do include such social and cultural issues as gun rights and abortion. But growing polarization is not limited to social/cultural issues; it is also apparent on labor, the environment,Footnote 19 health care, and education. Moreover, there are very few issues on which the parties were more polarized in their language in earlier eras than today. There is also evidence that social issues are somewhat more prevalent in state parties’ platforms than in the past, while economic issues garner somewhat less attention (while remaining prominent). Regional issues such as agriculture have seen a clear decline, however. Excerpts from specific platforms bolster these claims.
The finding of a sudden, discontinuous rise in state-level polarization in the mid-1990s mirrors Gentzkow et al.'s work on polarization in congressional rhetoric—and suggests that with respect to agenda setting, the state parties were moving at roughly the same time as their national counterparts.Footnote 20 State-specific social, organizational, and institutional variationFootnote 21 did not prove to be a major brake on the sudden polarization of state party platforms in the mid-1990s. This timing has important implications for the engines of polarization, as it suggests that the causes of polarization were at work in the states as well as in Washington, DC. Put differently, polarization and nationalization were connected from the start; polarization in Washington, DC, did not precede nationalization in state capitals. That observation, in turn, reinforces systemwide explanations—such as changes in party networks or communications technologies—over explanations that focus specifically on the federal government, Congress, or the presidency. The timing also lends weight to accounts of contemporary political parties characterizing them as networks that are integrated across the levels of government while lacking a consistently hierarchical structure with national actors at the top.Footnote 22 In such a party system, shifts in the political agenda are more or less contemporaneous across the levels of the federal system, and novel issues and frames can appear first at the state level.
An important caveat is that our models more clearly differentiate issues that have emerged in recent decades. This is partly because topic models better distinguish topics when there are more data to work with, and we were able to recover a greater fraction of platforms in recent years. We believe that this is more of a concern when tracing nationalization over a long time span than it is for polarization. Across a variety of measures and approaches, our results clearly show much sharper differences between the parties in their agendas in recent decades than in the 1920s–80s. There simply are very few topics that show consistent polarization in earlier decades, even when the topics are assessed separately for those periods, limiting the concern that the topics are dominated by more recent issues due to differential data availability. Our measures of nationalization prove somewhat more sensitive to choices such as the specific time period analyzed. Even so, comparisons over shorter, more clearly comparable time periods illustrate that state parties’ political agendas have grown more similar in the period since 1990 (and that the changes have been larger among Democratic platforms). This finding of growing similarity lends added weight to accounts of polarization and nationalization that emphasize systemwide causes acting at all levels of the polity.
1. Polarization, Party Nationalization, and State-Level Agendas
Elite-level partisan polarization—defined as the difference in policy positions across political parties—has become a central area in the study of American politics. Less is known about the extent and ways in which polarization has penetrated state politics. Here, we develop hypotheses about the transformation of the state political parties and their issue agendas in the wake of federal-level polarization and the related forces of nationalization.
1.1 The Polarization of State Parties
For decades, the consensus characterization of American state parties was as decentralized entities. Federal politicians depended on state and local organizations for support, with the result that “the risks and sanctions to which most members of Congress are particularly sensitive have their focus within the states and localities.”Footnote 23 State parties also had power in the presidential nominating process. Drawing these strands together, V.O. Key concluded that the relationship between national and state parties is independent and confederative: “no nationwide party organization exists.… Rather each party consists of a working coalition of state and local parties.”Footnote 24
For some scholars, these loose confederations were poorly equipped to provide the necessary responsibility and accountability.Footnote 25 Others have regarded decentralization as a strength. Nelson Polsby argued that “federalism underwrites the American party system. A significant reason that Americans make do with only two major political parties … is because each of the two American major parties is in most respects a loose coalition of state parties.”Footnote 26 To Polsby, rather than viewing America as stuck with a two-party system that restricts voter choice, we have “close to a one-hundred-party system.”Footnote 27
Today, the scholarly consensus instead emphasizes elite-level political polarization, at least in national politics. But polarization has the potential to undercut the traditionally decentralized nature of state parties and so may limit their capacity to represent those state and local interests that fit uneasily within national coalitions. Existing studies of state-level legislative polarization document a gradual increase in polarization,Footnote 28 but with significant regional variation persisting as late as 2015.Footnote 29 Still, it is possible that state political parties’ agendas can transform more quickly than roll call voting patternsFootnote 30 and so may reflect polarization more rapidly than ideological scores estimated based on legislative votes.
1.2 Nationalization
State parties’ agendas may provide a leading indicator of nationalization as well as polarization. Here, we define nationalization as the homogenization of political agendas—and of the terms of political competition—across subnational units. So defined, it is theoretically distinctive from polarization, since state parties could in theory be highly polarized on state-specific issues. Even so, the two forces are closely related: If state political parties are focused on national issues, it is quite likely that they will adopt their copartisans’ positions.
There are a number of ways to conceptualize and measure party nationalization. One strain of prior work has focused on electoral outcomes, based on the idea that a party system is nationalized to the extent that different units either vote the same way or respond similarly to national-level shocks.Footnote 31 Analyses of aggregate vote patterns generally suggest that nationalization has increased in U.S. elections. Still, this work leaves unresolved whether and to what extent the greater importance of national forces and partisanship is driven by national elites, policy-demanding groups, citizens, or other actors.Footnote 32, Footnote 33
An alternative strain of research examines the balance of power between national and state party actors and institutions.Footnote 34 Before the New Deal, state-level politics held significant promise to political organizers as an autonomous target of political action, as many of the spoils of office were available to state officials.Footnote 35 This, in turn, led some political entrepreneurs to focus on state-level efforts, sometimes with the effect of producing state-specific parties. As Valelly demonstrates, state-level political patterns in the early 1900s diverged significantly from national-level patterns, as parties like Minnesota's Farmer-Labor Party and North Dakota's Non-partisan League offered economic platforms that differed dramatically from the more laissez-faire status quo elsewhere.Footnote 36 In Valelly's account, state parties in the pre-nationalized era were able to take positions on salient issues that were outside the mainstream of national politics.
By studying western states in more recent decades, Gimpel offers an alternative vision of pre-nationalization state-level politics.Footnote 37 Like Mayhew,Footnote 38 Gimpel details significant regional differences in party organizations as late as the 1980s, with the more candidate-centered politics of some western states contrasting with the machine-oriented politics of the Northeast and Midwest, and the one-party, factional politics of the South.Footnote 39 In Gimpel's view, in a denationalized system, state politics can address different issues and can divide voters along different lines, a characterization that also holds for contemporary Canadian provincial politics.Footnote 40 In nationalization, we see a version of the Anna Karenina principle: While nationalized states are alike, states may be denationalized in varying ways.
With the centralization of power at the federal level following the New Deal, parties had heightened incentives to focus their energies on a coordinated national effort to win power.Footnote 41 Changes in party organizations in the intervening decades were another factor that prioritized competing nationally. For example, although the McGovern-Fraser reforms adopted by the Democrats in the wake of the 1968 convention debacle were widely viewed as contributing to party decline, the innovations actually shifted authority within parties toward the national level. By imposing detailed rules governing national conventions, the central party organization established its authority over its component state units.Footnote 42
The growing strength of the national parties was driven by Republicans as well as Democrats. Starting in the late 1970s, the Republican National Committee responded to a series of disappointing state election results with an increased role in financing and providing services to state and local parties.Footnote 43 Democrats soon emulated many of the Republicans’ changes, enhancing the services that the national party provided to its state and local units.Footnote 44 These changes made the state parties more like constituent units of a single national party than previously.Footnote 45
Beyond the electoral and organizational dimensions of nationalization, changes in the activist base of both parties may also have contributed to a shift away from the fragmented party system. The traditional patronage activists of many state parties have been replaced by ideological activists aligned with national interest groups and policy causes.Footnote 46 Where a patronage-based system places less of a premium on a party taking decisive policy stands, ideological activists will generally urge their party to take clear issue positions.Footnote 47 To the extent that these ideological activists are part of broader national networks,Footnote 48 this will add to the pressure for state parties to adopt similar positions across regions. And such activism need not manifest itself first or primarily at the national level.Footnote 49
Activists may play an important role both in driving polarization and the nationalization of the party system, as differences across state parties are reduced. Studies of party activists show that the ideological gap between Democratic and GOP activists grew substantially starting in the 1960s.Footnote 50 While these studies do not focus directly on state politics, there is considerable evidence that activist preferences are polarized in state as well as national parties. For example, Paddock found a substantial ideological gap separating Democratic and Republican state and county party officials.Footnote 51 Interestingly, polarization tended to be lower in states that had strong “traditional party organizations” as classified by Mayhew.Footnote 52 This finding is consistent with the idea that old-style, patronage-based state parties constitute an obstacle to a highly polarized, nationalized party system. But as these old-style organizations have eroded, the path toward greater party nationalization has cleared.
The underlying information environment has also shifted to augment the nationalizing role of activists. Recent decades have seen a transformation in the media, one that has undermined local news sources and so undercut subnational parties’ capacity to build independent brands or to be rewarded for focusing on local issues.Footnote 53 Readership for local newspapers is declining,Footnote 54 and growing audiences for national partisan media are likely to incentivize politicians to focus on national issues and to side with ideological activists.Footnote 55 At the same time, the widespread adoption of the internet and the use of social media are likely to have accelerated these polarizing trends,Footnote 56 while also providing subnational party activists with additional, real-time opportunities for coordination across state and regional lines. That coordination, in turn, might further erode the national parties’ privileged agenda-setting position, while empowering ideological activists who view each level of the party as a vehicle to advance their policy goals. From this perspective, greater nationalization of party politics need not coincide with greater strength in national party organizations.Footnote 57
1.3 Nationalization and the Issue Agenda
Nationalization may also influence the types of issues that are prominent in state politics. In a denationalized system, we might expect state-level interests to drive the political agenda, meaning that political agendas would likely reflect states’ economic and social diversity. In a more nationalized system, however, candidates and parties have incentives to emphasize issues that resonate broadly across the nation while not disrupting key elements of their coalitions. Social issues (defined broadly to include a range of issues sometimes termed “racial,” “cultural,” or “moral”) may have that national resonance in a way that only certain economic issues do.Footnote 58, Footnote 59 As a consequence, nationalization may not only homogenize state parties’ agendas but also push them toward issues that are straightforward and likely to be viewed in similar ways nationwide. Nationalization also has the potential to create a mismatch between the issues that are politically salient and those on which states have meaningful authority. Analyzing state parties’ agendas over time provides an opportunity to test such claims.Footnote 60
2. State Party Platforms as Indicators of Polarization and Nationalization
Party platforms provide a rich data source for assessing the extent to which state parties put forward a common policy agenda. Platforms offer each state party the opportunity to speak with a single voice, allowing it to outline the vision that it hopes to present to the electorate and to express where it stands in policy battles.Footnote 61 Parties have no need to highlight issues of internal disagreement, so platforms are likely to indicate the issues on which there is sufficient internal agreement among a party's decision makers. In that way, they are a window into intra-coalitional bargaining.Footnote 62 They also reveal which groups within a party's coalition have the sway to have their priorities included when shared commitments are articulated.Footnote 63
Traditionally, state platform writers tended to come from the midlevel of the parties: state and county party chairs and executive committee members, state legislators, mayors, ideological activists, and in some cases, members of Congress.Footnote 64 Building on Feinstein and Schickler's analysis of platform politics in the 1940s, we undertook a systematic search of press coverage of the platform-writing process in the states in 2008, 2010, and 2014, using newspapers.com. The news coverage illustrated that state platform committees consisted of a mix of delegates drawn from elected politicians, local party organizations, and activists. The coverage underscored that many delegates had particular issues of concern to them, though they were rarely identified explicitly with an interest group. There were a handful of cases in which a convention censured a prominent party politician for failing to abide by the platform; in particular, Republican state parties took specific elected officials to task for this failure, suggesting that party actors continue to care about the platforms in the contemporary era. Appendix Table A.1 provides summary information concerning the platform-writing process in 1942–50 and 2008–14.
Although challenges in data collection have limited the study of state party platforms, Bensel and Silver analyze late nineteenth-century platforms, revealing considerable regional variation even as the major parties tended to focus on national economic issues rather than such ethno-cultural issues as temperance and immigration.Footnote 65 Studies of more recent state platforms point toward sharper party polarization and greater nationalization, though with the caveat that no study has directly compared contemporary platforms to those from prior to the mid-1950s. Paddock hand-coded a sample of platforms starting in 1956, finding evidence of greater party differences over time.Footnote 66 Most of the movement is among Republicans, who shifted well to the right—especially on social issues in the 1990s.Footnote 67
Studies of recent platforms also suggest that cross-state differences are often manifest in the issues emphasized rather than the positions taken. Coffey reports that state parties tend to avoid issues where the national party is out of step with the state's voters. For example, Massachusetts and Hawaii Republicans fail to mention abortion in 2010–12, while many red state Democratic parties steer clear of gun control.Footnote 68 State parties do not address every issue, but when they do talk about an issue, they stick close to the national party's position.
Another question is about the relationship between state- and national-level polarization. Carr, Gamm, and Phillips analyzed more than 600 state platforms from 1960 to 2014, focusing on the social issues that have become increasingly salient in dividing the two parties.Footnote 69 They show that state parties staked out distinctive positions on two key social issues—abortion and gay rights—well before national parties and elites polarized on these issues. Just as Schickler finds that state parties and activists laid the groundwork for the national-level realignment on civil rights, Carr et al.'s evidence suggests that a broadly similar dynamic occurred on key social issues.Footnote 70 This, in turn, speaks to the potentially critical role that relatively decentralized activists and state parties can play in generating coalitional change nationwide. Nationalization need not originate in Washington, DC.
2.1 Data: State Party Platforms, 1918–2017
Our analyses draw upon a collection of state party platforms we believe to be the most extensive compiled to date. Specifically, we begin with the platforms collected by Paddock, Feinstein and Schickler, Coffey, Carr et al., and Lendway and Henderson,Footnote 71 which we extended through web searches, newspaper searches, outreach to relevant state and party archives, and collaboration with other researchers.Footnote 72 For the majority of platforms that were not already digitized, we used ABBYY FineReader to perform optical character recognition (OCR) and generate machine-readable files. Here, our analysis focuses on 1,783 digitized, major-party platforms from forty-nine states as well as the national parties. The vast majority of the platforms have been released publicly in machine-readable form.Footnote 73 Appendix Figure A.1 displays the logged number of words per platform by year and shows that platforms have been getting somewhat longer over time.
These platforms were written between 1918 and 2017. Most state parties produce platforms biannually, while others do so less frequently—and some state parties have only begun to author platforms in recent years. Predictably, it is easier to find more recent platforms, so the median platform year (1971) is slightly more recent than the midpoint of this period (1966). One-quarter of the platforms come from before 1950, and another quarter from after 2004. Florida, Georgia, Kentucky, Louisiana, and Tennessee each provide fewer than nine platforms, while Texas (51), Nebraska (55), Minnesota (61), New Jersey (62), Missouri (63), California (65), Kansas (66), Wisconsin (66), North Dakota (73), Illinois (79), North Carolina (82), New Hampshire (85), and Maine (85) each provide more than fifty platforms. Just over half of our platforms are from the Democratic Party, while the remaining 47 percent are from the GOP.
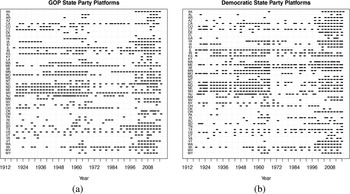
Appendix Table A.2 illustrates the results of a linear probability model in which we predict the presence or absence of platforms in our data set for every two-year state period. As the table illustrates, our data set underrepresents platforms from the South as well as the 1910s, 1920s, 1970s, and 1980s; there is a smaller but detectable underrepresentation of GOP platforms. The paucity of platforms from the South is likely to lead us to understate the rise in nationalization, as many of the missing platforms would have illustrated the divergence between Northern and Southern Democrats in earlier decades.Footnote 74 Figure 1 displays the platforms included by year and party. We include the national party platforms as benchmarks, but the data set is overwhelmingly drawn from state-level platforms.
These figures present the platforms collected separately for state Republican parties (left) and state Democratic parties (right), with each dash representing a platform collected from that state and year, n = 1,783 platforms.

2.2 Pre-processing and Data Set Construction
Our research team read all platforms for two reasons. First, by doing so, we were able to remove the handful of platforms where the document quality was too low for OCR to return legible digitized text. Second, we also broke up each platform by subject area, a time-intensive step that facilitates the automated analyses detailed below. In particular, by breaking the platforms into segments, we can incorporate information from the structure of the platforms—which are often organized into topical paragraphs—into the structure of the data set. This procedure is likely to improve the coherence of the topics returned by unsupervised analyses. Accordingly, the primary unit of observation is the platform segment. On average, there are 23.6 segments per platform.
After digitizing the platforms, we employed common pre-processing techniques for automated content analysis, taking care to subsequently test our results’ robustness to these decisions.Footnote 75, Footnote 76 We next eliminated word stems that appear in fewer than 0.25 percent of platform segments (stems that appear in fewer than 1 segment per 400). We then culled platform segments with no remaining word stems, leaving us with 42,020 platform segments from 1,783 unique platforms.
We then generated separate term-frequency matrices with all stemmed unigrams, bigrams, and trigrams. For unigrams, this meant creating a matrix in which each row represents a platform segment and each column represents a unique string of at least three characters separated by spaces. Stemming refers to a procedure through which several related words—“resolve,” “resolving,” “resolved”—are collapsed to a single stem, “resolv.” We generated the term-frequency matrix for bigrams—two-word phrases separated by a space—analogously. We were left with matrices with 5,240 unigrams and 18,800 bigrams.Footnote 77 Due to sparsity issues, we were not able to analyze trigrams within platform segments. However, we did also generate a term-frequency matrix with 605,042 trigrams (or three-word phrases) that appear in more than 0.1 percent of platforms.
There are clear advantages to the hand-coding approach employed by Coffey and Paddock. By reading each sentence, they were able to develop measures of the position adopted by each party on a specified set of issues and overall summary measures.Footnote 78 Accordingly, our analyses began by hand-coding three-word phrases, and we also drew on quotations and an in-depth reading of specific platforms. However, such hand-coding has limitations. It is labor-intensive, and it relies on researchers being able to specify the categories of interest ex ante. Our primary analyses thus employed unsupervised automated content analysis as a complementary technique to identify the prominent, recurrent political issues in state party platforms. The advantage of such an unsupervised approach is that it is more exploratory, which allowed us to identify issues and summarize the platforms in novel and potentially unexpected ways.Footnote 79 At the same time, we were able to compare the insights that emerged from the hand-coded trigrams with those from the unsupervised analyses and more traditional readings of the platforms.
3. Results: State-Level Trends in Polarization and Nationalization
3.1 Trends in Polarization via Trigrams
We began the analysis with a focus on trigrams, which provided initial evidence of a number of important patterns that we explored in greater depth via the unsupervised content analysis. A straightforward first cut was to examine the extent to which the two parties differ in their use of the most common trigrams. We started by identifying the 20 three-word phrases that appeared with the greatest frequency in three periods: 1932–60, 1961–93, and 1994–2017. (The within-period focus addressed the greater availability of platforms since the 1990s, which otherwise might have led us to miss the most important trigrams used in earlier periods.) Most trigrams can be readily given a clear, singular political meaning. For example, the trigram labeled as “keep bear arm” clearly refers to gun rights.Footnote 80
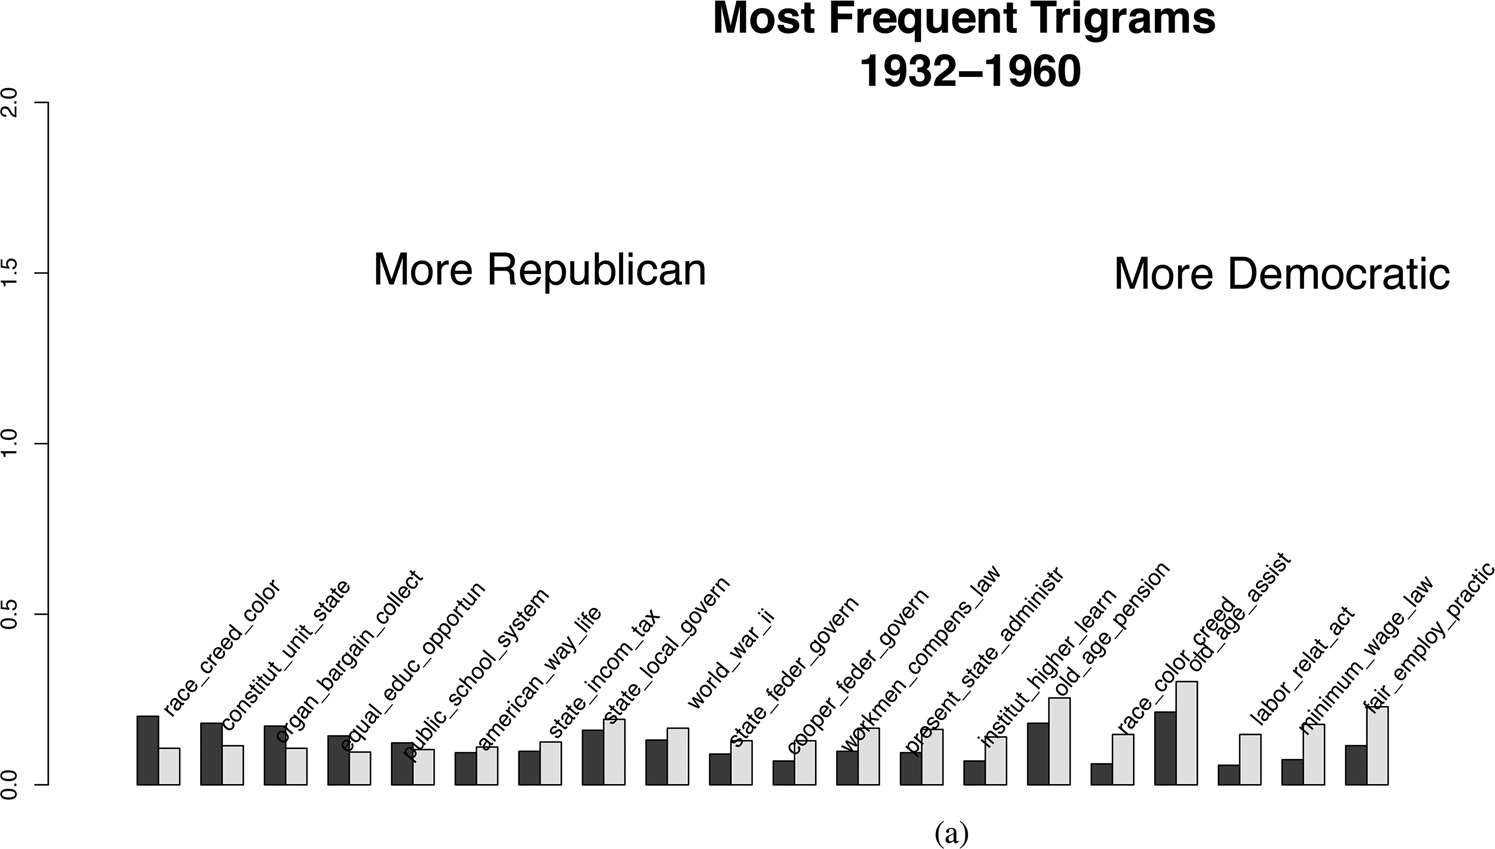
Figures 2–4 present the number of appearances of each top-20 trigram per 100 total platforms. Party differences have clearly grown in recent decades, with widespread divides most apparent in the most recent period. In 1932–60, there are only a handful of highly used trigrams that are the near-exclusive province of one party. The trigram with the greatest party difference is “fair_employ_practic,” with Democrats accounting for about 69 percent of the usage of this phrase (arguably the most prominent civil rights initiative on the political agenda). But it was far more common for both parties to have devoted similar attention to high-salience topics; thus, “old_age_pension” and “old_age_assist” were used only slightly more often by Democrats than Republicans, with Democrats’ share of usage just under 59 percent for each. There are no topics—among the top 20—for which one party accounted for more than three-quarters of the usage per platform. The average partisan gap in this period is 0.26.Footnote 81
These figures display the twenty most common meaningful trigrams sorted by differential partisan usage 1932–1960, with trigrams used more by Republican platforms at left and trigrams used more by Democratic platforms at right.

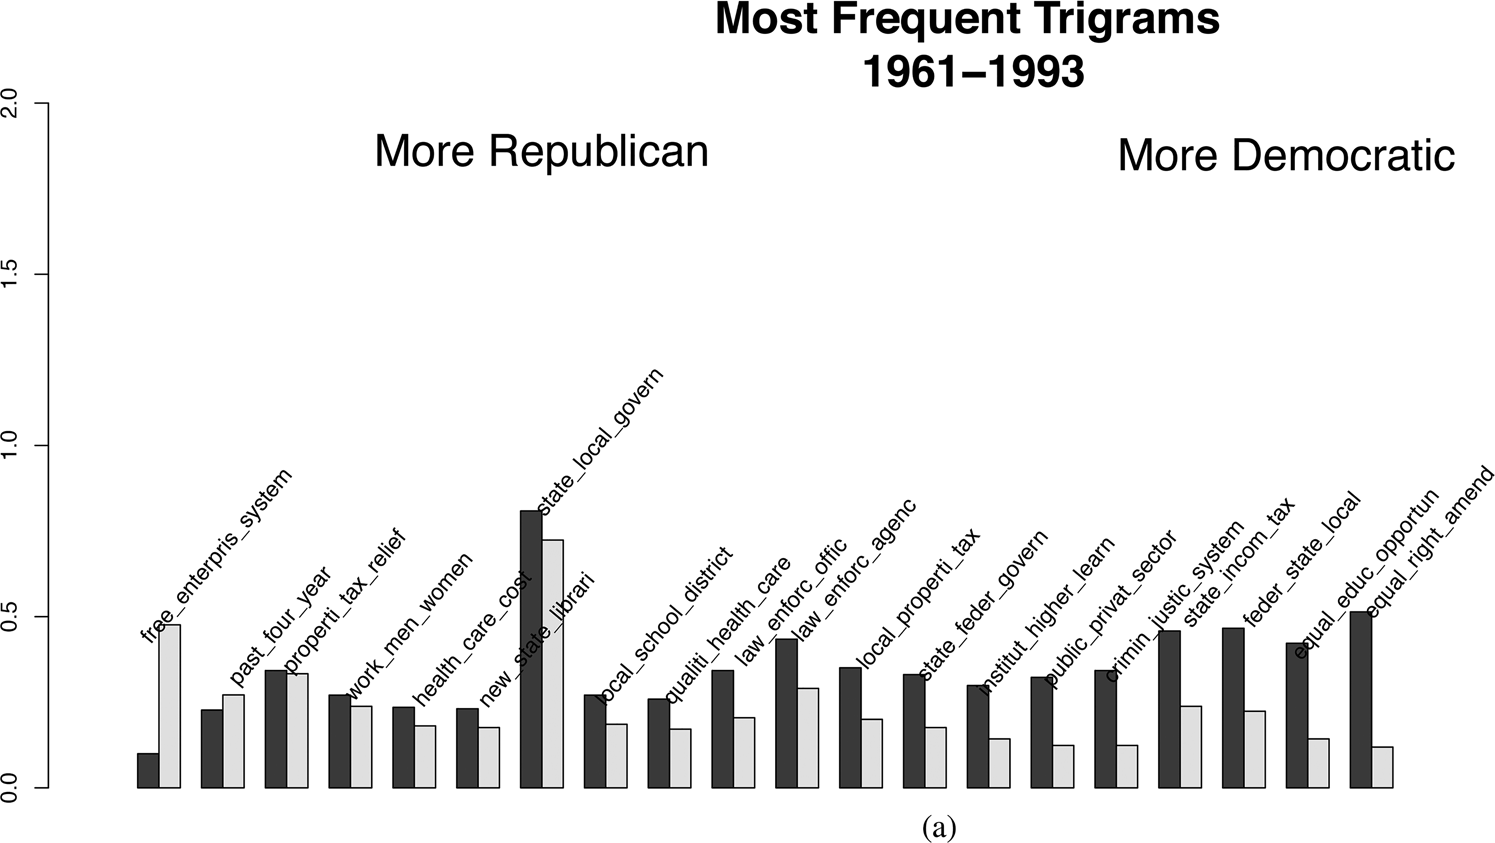
These figures display the twenty most common meaningful trigrams sorted by differential partisan usage 1961–1993, with trigrams used more by Republican platforms at left and trigrams used more by Democratic platforms at right.

These figures display the twenty most common meaningful trigrams sorted by differential partisan usage 1994–2017, with trigrams used more by Republican platforms at left and trigrams used more by Democratic platforms at right.

The results for 1961–93 show somewhat greater partisan differentiation than the first period, but also substantial overlap between the parties. Although no topics are exclusive to one party, Republicans were responsible for 83 percent of the per-platform usage of “free enterprise system” and Democrats accounted for 81 percent of the references to “equal rights amendment.” But these are the only topics among the top twenty for which one party accounted for more than three-quarters of the usage. A few other topics also show fairly lopsided use by one party, such as “equal_educ_opportun” and “crimin_justic_system” for Democrats. But more common are topics that have substantial use (i.e., at least 40 percent) from both parties, such as “work_men_women,” “properti_tax_relief,” “local_school_district,” and “health_care_cost.” For this period, the average gap is similar to earlier decades, at 0.28.
By contrast, the most commonly used trigrams in 1994–2017 sharply distinguish the two parties. One party was responsible for at least 75 percent of the per-platform usage of twelve of the top twenty trigrams, including such Republican tropes as “man_one_woman” (99 percent), “keep_bear_arm” (90 percent), and “private_properti_right” (86 percent).Footnote 82 Democrats, for their part, accounted for the vast majority of mentions of “sexual_orient_gender” (100 percent), “orient_gender_ident” (100 percent), and “qualiti_health_care” (81 percent). While there are a handful of trigrams that both parties used to a substantial extent (e.g., Democrats accounted for 55 percent of the usage of “health_care_system” and 47 percent of “health_care_provid”), the typical party difference dwarfs the gap in earlier periods. Indeed, the average partisan gap is 0.56, doubling the gap observed between 1961 and 1993. The broad pattern of trigram usage thus offers clear support for the claim that state parties have polarized markedly in their language in recent decades, and that this shift represents a sharp departure from the New Deal era.
3.2 The Shifting State Political Agenda
The most commonly used trigrams also provide a window into the changes in the political agenda conveyed through state party platforms over time. Prominent trigrams in the most recent era include such hot-button social and cultural issues as gun rights (“right_keep_bear”), gay rights (“one_man_one,” “sexual_orient_gender,” “orient_gender_ident”), and abortion. There are very large party differences in the usage of each of these phrases. A handful of economic issues also feature heavy usage and substantial polarization, including health care and private property rights. Nonetheless, the salience of social issues stands out in comparison to earlier eras. For example, while racial issues were among the most-used trigrams in 1932–60, no other social or cultural issues made the cut. Instead, social welfare and economic programs tended to top the list (e.g., “old_age_assist,” “old_age_pension,” "organ_bargain_collect,” “minimum_wage_law,” “state_incom_tax”), and party differences in the usage of both kinds of trigrams tended to be modest. The 1961–93 period appears transitional from this standpoint. A handful of social issues do emerge in a prominent (and often polarized way), such as feminism (“equal_right_amend”), but economic issues continue to be the most prominent substantive topics (“stat_incom_tax,” “property_tax_relief,” “local_properti_tax,” “free_enterpris_system,” “quality_health_care,” “health_care_cost”).
To gain a more comprehensive understanding of over-time shifts in the political agenda, we identified the 1,000 trigrams that appeared in the corpus with the highest overall frequency.Footnote 83 We used manual annotations of these trigrams to track the changing content of the platforms. Appendix Figure A.2 highlights various social/cultural issues (including abortion, same-sex marriage, and gun rights/control), and Appendix Figure A.3 provides examples from economic issues (including minimum wage, Social Security, and labor laws).Footnote 84 Jointly, these figures are consistent with the main findings with respect to the top twenty trigrams by period. We see the dramatic rise in the use of particular hot-button social issues, with sharp and growing party polarization evident on each. The pattern for economic issues suggests more variability, with a handful of issues showing polarization in earlier eras (e.g., “minimum_wage_law”) and others showing rapid polarization in the past three decades (e.g., “state_incom_tax”).
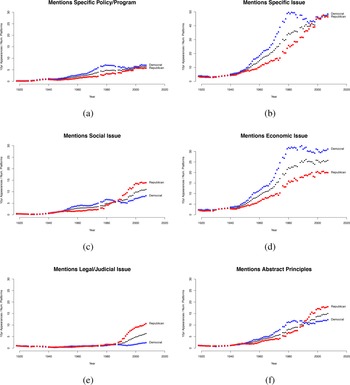
To categorize the trigrams, we had two research assistants apply the codebook in the Appendix to each. The codebook is designed to identify trigrams of theoretical import, such as those referencing social issues, economic issues, specific groups of people, and specific policy issues, alongside other categories, including the American founding, legal/judicial issues, racial/ethnic groups, the size and scope of government, specific policies/programs, rights, and abstract principles. Figure 5 displays the overall prominence of these different categories. Each point indicates the average number of appearances of all trigrams coded in that category in the surrounding ten-year window, with the results provided overall and by party. While this procedure detects more trigrams in most categories in recent decades—likely a by-product of focusing on the 1,000 most common trigrams overall—there are some noteworthy trends.
These figures display the over-time distributions of the 1,000 most frequent trigrams in the corpus. Each point represents the average number of trigrams coded in that category during the ten-year period centered on that year.

In terms of issue content, Democratic platforms employ trigrams related to economic issues more frequently than do Republican platforms, although both parties’ mentions grew in the 1960s and 1970s before plateauing. On social issues, in the 1940s–70s, when fewer mentions were included in platforms, Democrats outpaced Republicans. But social issues have seen increasing mentions since the 1980s,Footnote 85 and Republican platforms have outpaced the Democrats in emphasizing them. Republican platforms are also broadly responsible for the rise in mentions of legal or judicial issues and the U.S. founding.Footnote 86
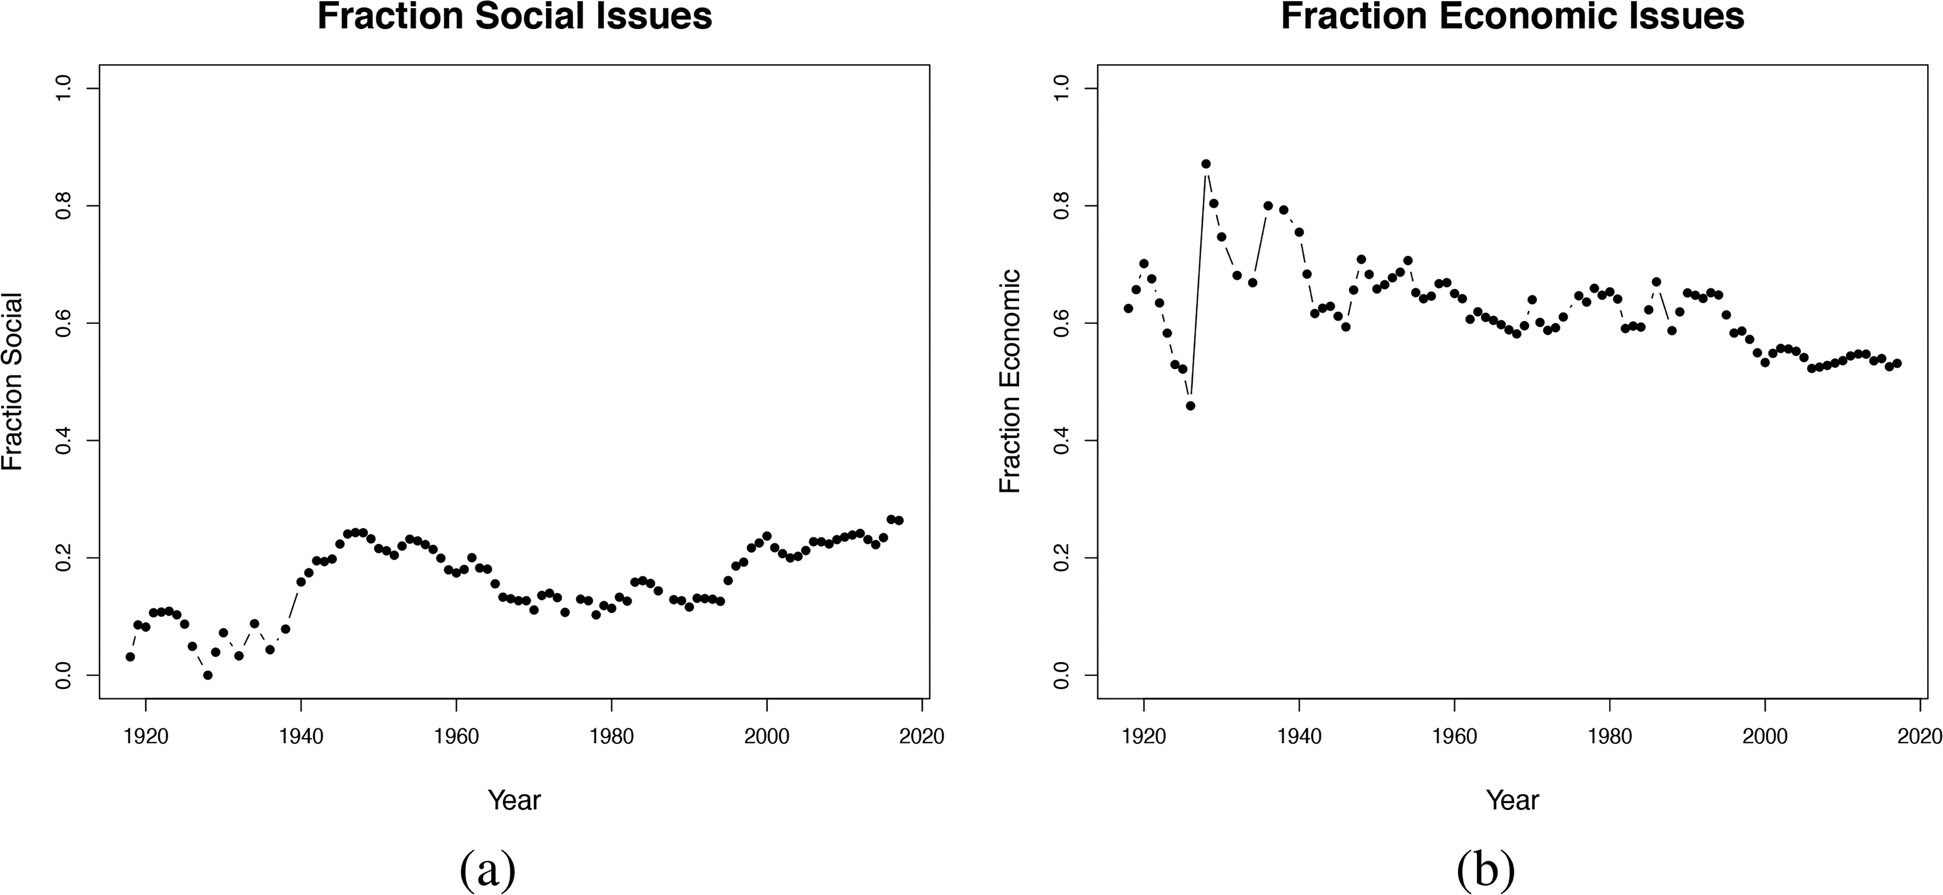
Figure 6 illustrates the fraction of the top trigrams that are linked to social or economic issues, and it shows slow rises in the former and declines in the latter—but with economic issues still exceeding social issues and accounting for approximately half of all trigrams even in the recent period. State-level polarization and nationalization have not led to a wholesale abandonment of economic issues.
Fraction of top 1,000 trigrams coded as social, economic issues over time.

3.3 Novel Trigrams
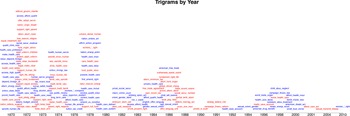
The trigrams also enable us to address questions about the diffusion of issue frames across the country. For example, Figure 7 illustrates novel trigrams after 1970 by year, defined as those that had not previously appeared in the platforms but that subsequently appeared five times in at least five separate states. In the early 1970s, Republican platforms introduced a number of innovations related to abortion; in the late 1970s, we see Democratic innovations related to health care.
Novel trigrams by year.

These novel trigrams, in turn, enable us to track the sources of innovation in the federal party system.Footnote 87 For example, we can measure the extent to which agenda setting is top-down by analyzing whether the novel trigrams came disproportionately from the national party platforms. As Appendix Figure A.4 shows, the usage-weighted fraction of novel trigrams that appear first in the national party platforms (as opposed to in a state platform) peaks just above 35 percent around 1980—but even then, most of the novel trigrams aren't coming from the national level. What's more, although our method detects relatively few novel trigrams in recent years, the fraction of novel trigrams from the national platforms has declined over that period. These results suggest that agenda setting among the major American parties is not entirely a top-down process. Innovations have appeared first at the state level more frequently than at the national level, a trend that may be gaining steam.
3.4 Unsupervised Topic Modeling
Empirically, one goal of this research is to chart the extent to which the state parties are addressing different political issues across states and over time, and the degree to which the two parties within each state differ from one another in how they discuss these issues. By doing so, we can measure state-level polarization as well as nationalization.Footnote 88 To measure the issues addressed by the state parties—and how those issues have evolved over time—we now turn to unsupervised topic models. We continue to highlight a few emblematic issues, including labor issues and economic issues alongside abortion and other social issues.
In recent years, computer science has made significant progress in developing models of language that allow researchers to identify clusters of words that typically co-occur within documents. One such model is latent Dirichlet allocation (LDA),Footnote 89 a hierarchical model that has proven extraordinarily successful in identifying topics within a collection of texts.Footnote 90 Simply put, LDA models a set of documents at two levels. At the first level, each document is assumed to have a distribution of K topics that follow a Dirichlet distribution. The number of topics, K, is chosen by the researcher and fixed ex ante. At the second level, each word within a document is assumed to have a single topic from the K topics, and that topic is drawn from the document's topic distribution. So a document with a higher frequency from a given topic will have more words drawn from that topic. Under an LDA model, the specific word is then drawn conditional on the word's topic. Each topic is defined by a separate set of word probabilities: the “education” topic might give high probability to words like “education,” “school,” and “teacher.” To be sure, there is no guarantee that LDA will return substantively meaningful topics.Footnote 91 But the technique has proven successful at recovering topics in a wide range of applications,Footnote 92 including in related studies of politicians’ tweets and of “State of the State” addresses.Footnote 93
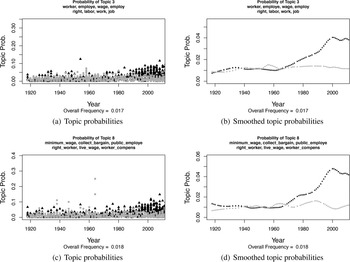
In Figure 8 we present the results for one of the fifty-five topics defined on the unigrams, one that relates to labor issues; in Appendix Figures A.6–A.9, we illustrate the results for all fifty-five topics.Footnote 94 After some experimentation, we chose fifty-five topics to represent the platforms, which captures a variety of substantively meaningful but distinct topics: choices of K that were much larger returned too many topics without substantive meaning, while choices of K that were much smaller produced topics that combined distinct issue areas. Although the unit of analysis for the model is the platform segment, we collapsed the results to the platform level after fitting the model to facilitate interpretation.
Distribution of usage of select LDA topics over time for unigrams (top) and bigrams (bottom). Black triangles represent Democratic platforms; gray circles represent Republican platforms. The smoothed lines show eight-year averages beginning with the indicated year.

For the first topic, Figure 8 panel (a) presents the share of each platform found within that topic on the y-axis—we use “shares” interchangeably with “topic probabilities”—and the platform's year is indicated on the x-axis. Gray dots denote Republican platforms, and black triangles indicate Democratic platforms. The word stems that are most characteristic of this topic—that is, which appear disproportionately within this topic relative to others—are listed in order atop the figure. Here, they are “worker,” “employe,” “wage,” “employ,” and “right,” giving the clear impression that this topic is about workplace issues, labor, and employment. In fact, we chose it as an emblematic economic issue. Overall, this figure illustrates a general rise in attention to labor issues driven by Democrats.Footnote 95 However, since it is hard to distinguish the overall trends when every platform is shown, Figure 8 panel (b) instead uses locally estimated scatterplot smoothing (LOESS) lines to present the smoothed over-time averages for each party. While the Republicans briefly led in the use of this topic in the 1950s, Democrats have increasingly used it since, providing evidence of polarization. These results go against the common view that Democrats have paid less attention to labor and workplace concerns as social issues have gained prominence in recent decades. In the bottom panels of Figure 8, we show the same plots for a closely related topic on workers’ rights from the LDA model fit using the bigram data. The core point is that the broad conclusions are similar representing the data as either unigrams or bigrams. (Appendix Figure A.5 shows comparable results for the abortion topic.)
To help identify overall trends, Appendix Figures A.6–A.9 present all fifty-five topics, with each topic labeled using the eight words that are the most characteristic of it using the score metric. The figures provide smoothed trends in topic usage for all Republican and Democratic state party platforms.
Overall, LDA fit to the topical platform segments returns topics that are typically highly meaningful and coherent. We see topics that clearly indicate education (topics 1, 19), labor/workers (topic 3), foreign affairs (topics 4, 23, and 47), the environment (topics 7 and 41), business (topic 11), family issues (topic 12), labor and unemployment (topic 13), drugs (topic 14), taxes (topic 15), health care (topic 16), industrial policy (topic 17), veterans (topic 21), courts (topic 22), agriculture (topic 25), budgets/fiscal issues (topic 31), mental health (topic 35), highways and transportation (topics 36 and 53), senior citizens (topic 39), free enterprise (topic 40), elections (topic 45), criminal justice (topic 46), land rights (topic 50), housing (topic 52), immigration (topic 51), and abortion (topic 55). While some of these topics—say, immigration or veterans’ issues—are primarily federal issues, states share in authority over most of these issues.
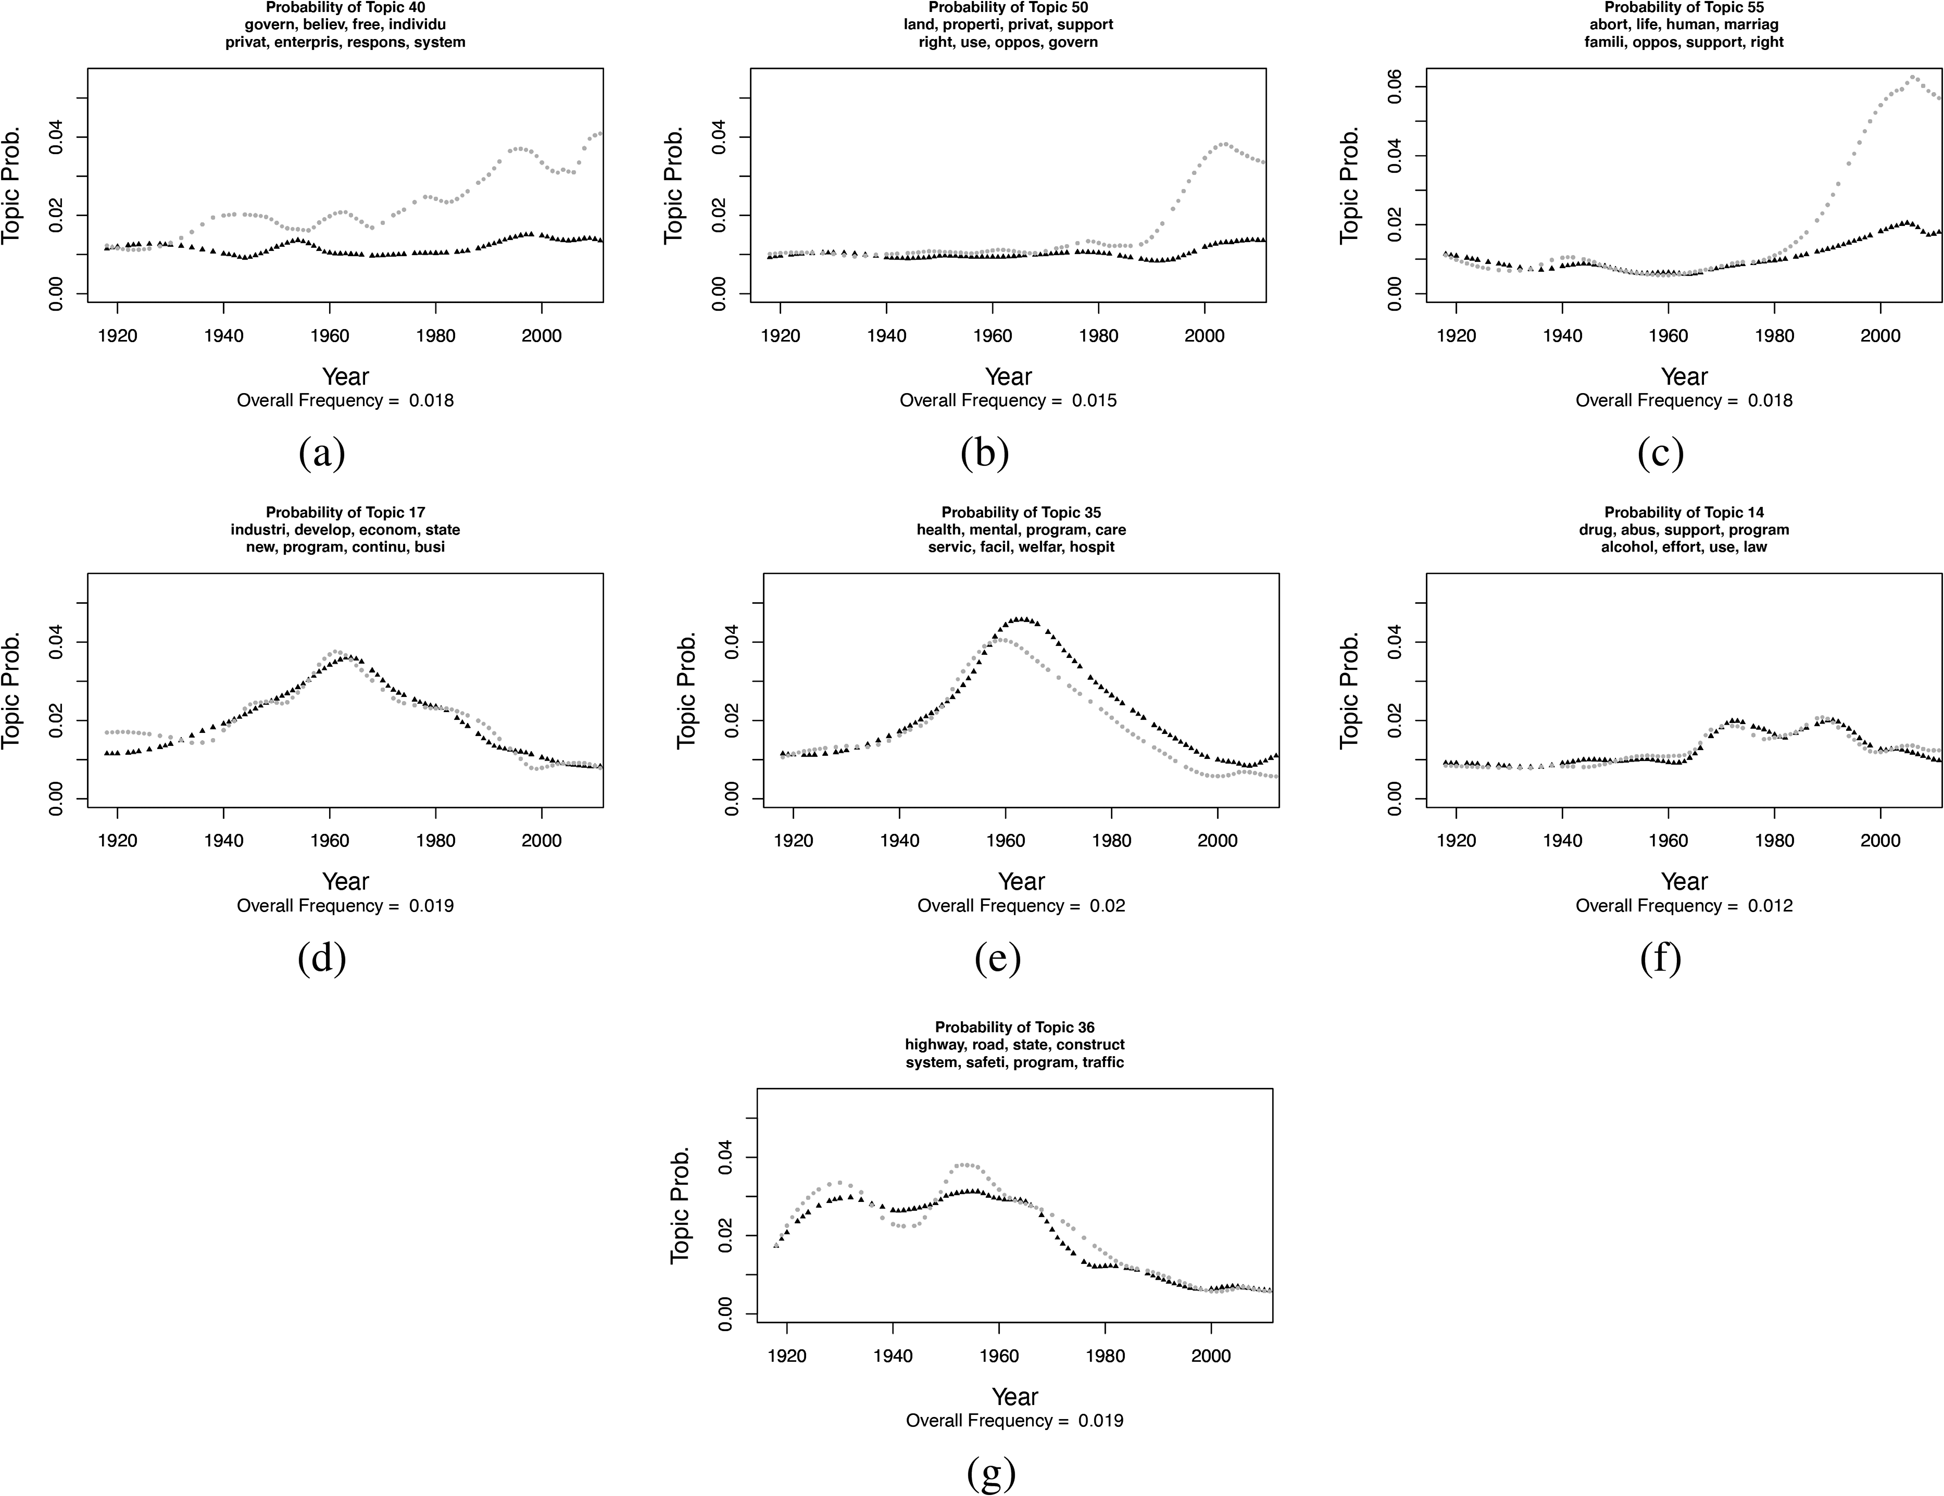
As the topics illustrate, the two parties appear to devote quite similar levels of attention to several political issues over time, while others show clear evidence of polarization in usage. Figure 9 presents select topics that illustrate the core patterns, while Appendix Figures A.6–A.9 provide all fifty-five topics. For example, we see in Figure 9 panel (a) that language about free enterprise (“govern,” “believ,” “free,” “individual”) has become increasingly common in GOP platforms while remaining infrequent in Democratic ones. The same is true around property rights, as Figure 9 panel (b) shows. It is also noteworthy that on some divisive issues, we see one party's framing but not the other's. The abortion topic (panel c) uses “abort,” “life,” and “human,” clear evidence of a conservative framing—and there is no corresponding liberal framing. When one looks back to the 1940s–60s, there are numerous major topics to which the parties devote similar attention, from industrial development (panel d) to mental health (panel e). By contrast, the handful of topics that receive similar attention from both parties in recent years tend to concern issues that are not highly salient, such as drug and alcohol abuse (panel f) and highway and road construction (panel g).
This figure presents select topics from the LDA output when fit to unigrams from platform segments.

To be clear, this is one particular representation of the state party platforms; alternative models or choices in pre-processing would have led to different representations.Footnote 96 The topics returned by LDA depend on the setting of the models’ parameters and are simply designed to identify clusters or words that disproportionately occur together. As such, the topics will never align perfectly with substantive understandings of topics. In this case, we see that some issues span multiple topics, whether because the parties frame the issue differently (as in the case of education) or because they cover multiple subtopics (as we see with foreign affairs). Note that whether a political issue spans one or multiple topics, the measures of polarization detailed below will detect partisan divergences.
Even with these limitations, this representation provides substantial insight; moreover, our results are stabilized by virtue of the decision to use topical platform segments as the unit of observation, and so to incorporate information from the documents’ structure into our models. We can see many of the trends that scholars have described, including the increased attention to civil rights by midcenturyFootnote 97 as well as the heightened attention to abortion and social issues in the mid-1980s.Footnote 98 By contrast, issues like war and agriculture (topic 25) have become less prominent with the passage of time. Agriculture's decline is especially noteworthy, as it is precisely the kind of regional issue that a decentralized party system should foreground in some places. The same general conclusions emerge from the topics fit to bigrams, lending further weight to this representation. LDA effectively identifies the broad, expected trends in issue attention over time, and it does so for a wide range of issues. In short, this representation of the platforms has considerable utility and face validity.
3.5 Validation
Do the trends uncovered by the automated content analysis hold up on a close reading of these platforms? Consider agriculture, a quintessential regional and economic issue, and consider Wisconsin, a state that is emblematic of recent political nationalization.Footnote 99 In 1968, the Wisconsin Democratic platform devoted 448 words to agriculture, singling out specific policies that would improve federal loans for young farmers, include farm workers under minimum wage laws, and strengthen their collective bargaining power, among other things. That year's Republican platform in Wisconsin included 328 words on agriculture, again highlighting specific steps such as dairy import quotas, increased applied research, and the regulation of dairy production. It also cautioned that agriculture was not only a state responsibility, noting, “There are only limited opportunities for state government to relate to farm programs. The federal farm policies of the Democratic administration are a proven failure.”
By 1994, though, the Wisconsin platforms were less engaged with agriculture. Mentions of the issue in the Democratic platform were down to 141 words, with fewer specific policy proposals alongside a statement that “we oppose farmland ownership by foreign interests.” The Republicans gave it only two sentences, including a vague commitment to “stand with Wisconsin's farmers and urge policies that will sustain Wisconsin's agrarian tradition.” The attention and specificity devoted to agriculture clearly waned.
We can also examine the handling of abortion in California. In 1967, under Republican Governor Ronald Reagan, California liberalized its abortion laws with its Therapeutic Abortion Act. Yet the prior year, not one of the 2,654 words in the Republican Party's platform had addressed the issue. It went unmentioned, too, in California Democrats’ 1966 platform, an extensive document of more than 17,000 words.
By 2014, though, the issue was a clear source of division between the two parties. The Democrats’ platform that year committed them to “preserve confidential, unrestricted access to affordable, high quality, culturally sensitive health care services, including the full range of reproductive services, contraception and abortion.” For its part, the 2014 Republican platform took the opposite stance, explaining that “the California Republican Party is the party that protects innocent life, because we believe life begins at conception and ends at natural death.” The broad trends detected through the trigrams and the automated analyses—illustrating the rise of nationalized social issues like abortion and the decline of regionalized issues like agriculture—is clearly on display in the content of specific states’ platforms as well.
3.6 Partisanship and Polarization
Having identified a topical representation of the content of select state party platforms, we were then able to measure different quantities that summarize the changing nature of these topics—such as their partisan polarization—over time. For example, Gentzkow et al. use congressional speeches between 1873 and 2016 to demonstrate that the speaker's partisan affiliation became markedly more predictive of her word choice in the mid-1990s.Footnote 100 By estimating comparable quantities from state party platforms, we were able to assess whether state party platforms have polarized in the topics they address—and if so, whether the timing of that polarization appears to differ from the timing of national-level polarization.
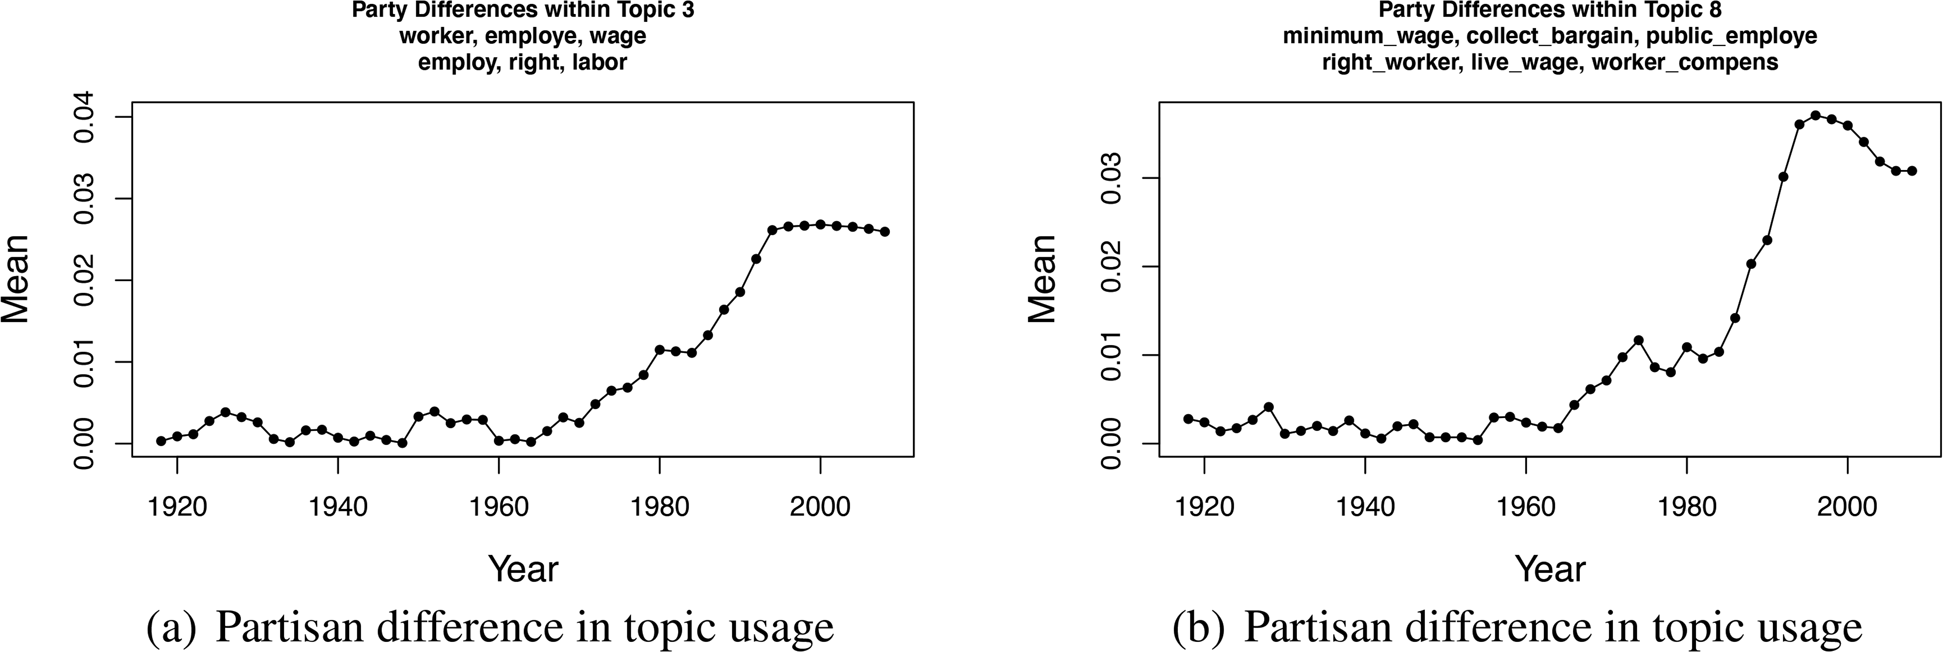
To do so, we iteratively examined eight-year windows of platforms. For all platforms in a given eight-year window, we estimated the mean topic distribution separately for Republican and Democratic platforms. We then subtracted the resulting Democratic from the Republican vector and took the absolute value of the resulting length-K vector of differences. We then took the mean and median of this vector to summarize the divergence in topic usage by the two major parties in a given year. Higher values indicate larger average partisan differences in topic usage, meaning that the parties were focusing on different issues and framings. For example, on the work-related topic, we show a mean difference that increases from nearly 0 to 0.03. This means that the average absolute difference in partisan usage grew to be approximately three percentage points. While such a number may seem small, these differences can add up when summed across dozens of topics.
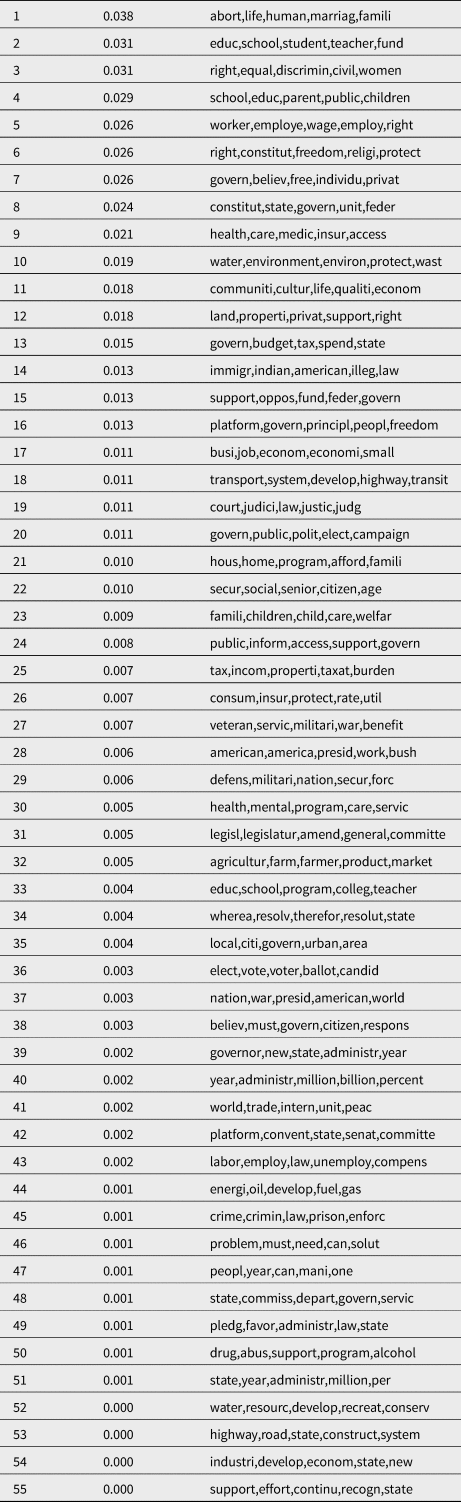
Figure 10 panels (a) and (b) illustrate the trends for the topic related to workers’ rights, while Table 1 and Appendix Table A.3 list each topic by its estimated 2008–2016 and 1992 levels of polarization, respectively. (Comparable results for bigrams are in Appendix Tables A.4 and A.5.) For unigrams, the single most polarized topic is abortion, followed by multiple school-related topics, as well as civil rights, workers’ rights, and constitutional rights. In multiple-issue domains, rights-based language seems to be highly polarized.Footnote 101 The presence of education atop the list may be surprising, but partly reflects that Democrats tend to talk about schools using stems including “teacher” and “funding,” while Republicans talk about schools with an emphasis on “parent.” This coincides with Democrats’ ties to teachers’ unions and their general support for increased funding as a key solution to education problems, in contrast to Republicans’ greater emphasis on parental choice and prerogatives.
Measures of partisan differences in topic usage. The dots lines show eight-year averages beginning with the indicated year.

The Unigram Topics Ranked by Mean Partisan Difference in 2008–2016

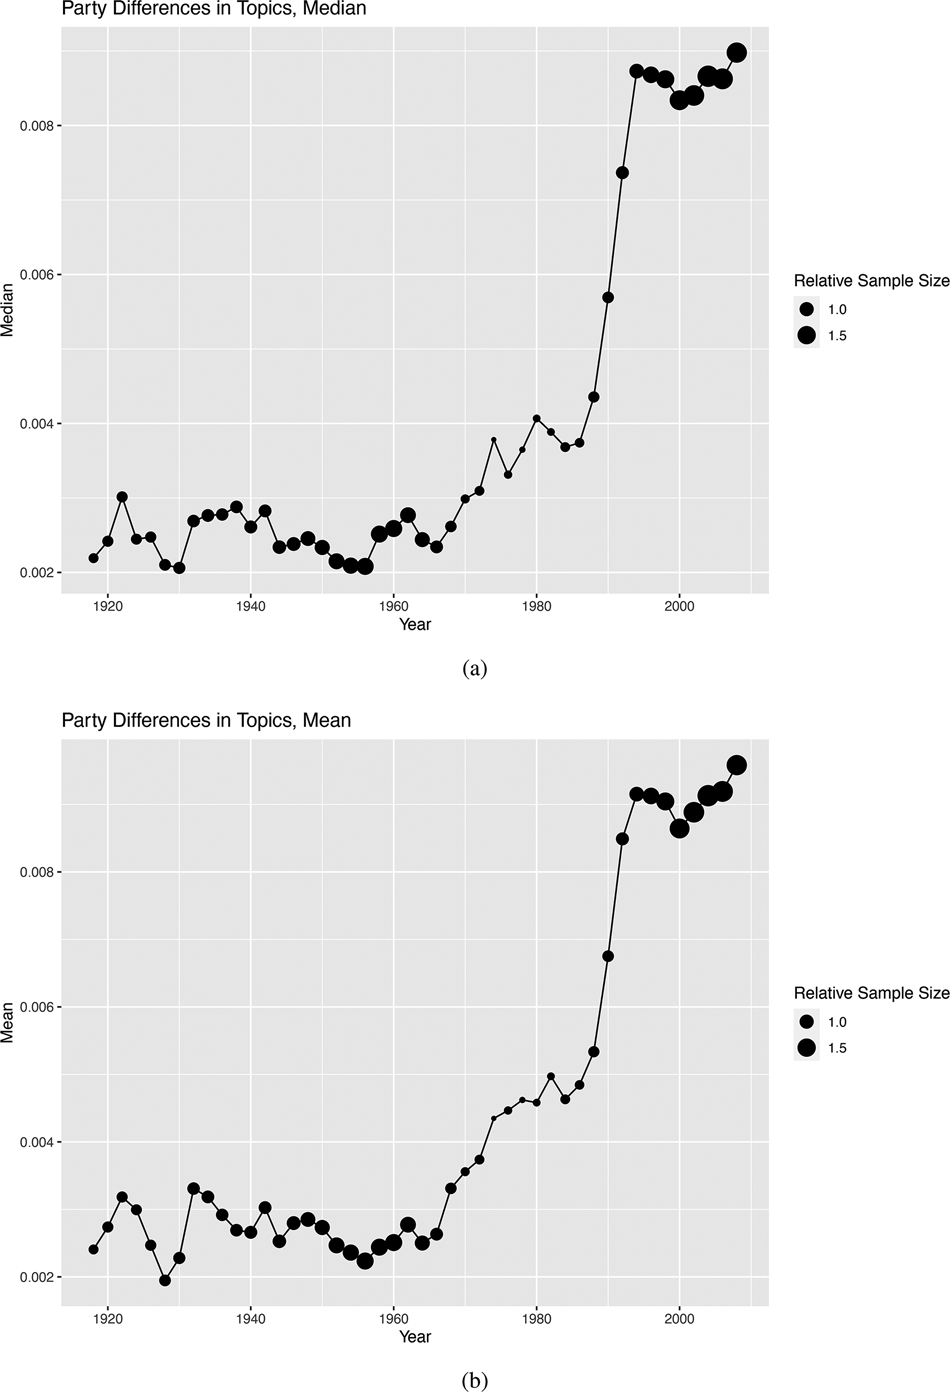
To generate measures of polarization across topics, we averaged these (and other) measures of partisan polarization over the fifty-five topics, as described above and illustrated in Figures 11 and 12 (for the unigram data) and Appendix Figures A.10 and A.11 (for the bigram data). The predictive power of the party authoring a platform on the frequency of topics began growing gradually around 1970, but then rose suddenly and dramatically in the mid-1990s. This result closely matches Gentzkow et al.,Footnote 102 indicating that whatever processes were driving congressional polarization appear to have been acting at the state level roughly contemporaneously. This result is robust to a variety of other metrics of polarization, such as the Jensen-Shannon divergence and cosine similarity.Footnote 103
This figure presents two different measures of partisan differences in topic usage in the unigram data set over time. The smoothed lines show eight-year averages beginning with the indicated year.

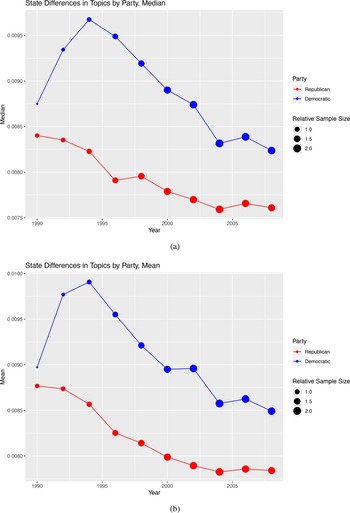
These figures present two measures of the within-party difference in topic usage across states using the unigram data set. The sizes of the points represent the relative number of platforms within the party.

The finding that polarization rises sharply in state party platforms at almost exactly the time that it rises in congressional speech is a vital clue about the causes likely to be driving it. If the state parties were simply taking their cues from national-level elites, one might expect a lag between the change in Congress and shifts in state-level platforms. The evidence instead suggests that both state parties and national-level officials were responding simultaneously to the same changes in the broader political environment. This, in turn, further reinforces the characterization of contemporary parties as loosely integrated networks of activists, policy demanders, and candidates rather than as top-down organizations headquartered in Washington, DC.Footnote 104 Information flows within parties across the levels of government appear to be almost simultaneous.
One challenge to this metric is the uneven distribution of platforms over time. Given that platforms have on average gotten longer as well as the necessity of employing OCR to input many of the earlier platforms, it is quite possible that the topics identified via LDA are more likely to be subjects that are prevalent in the final decades of the data set, and thus that a range of variables would be more powerful when predicting topics in those decades. However, the basic trends are nearly identical across unigram and bigram representations of the data, and they also hold when rescaling the differences by the average variation across platforms in a given eight-year period. Polarization in state-level agendas grew dramatically in the 1990s, a general pattern with important implications for identifying its causes.
In the left two panels of Appendix Figure A.12, we also display levels of polarization estimated from LDA models fit to unigram representations estimated separately for platforms between 1940–1964 and 1994–2017, two periods in which we have excellent platform coverage. By doing so, we are able to sidestep concerns that the unequal number of platforms may be driving the results above. As the evidence makes clear, across multiple polarization metrics, the basic conclusions stand. Republican and Democratic state party platforms were much more likely to be polarized in the period after 1994 than in the period during and immediately after World War II. Moreover, polarization continued to rise by detectable amounts, even after 1994.
3.7 State-Level Information and Nationalization
Building on Butler and Sutherland and Das et al.,Footnote 105 we might also be interested in how much information the state in question provides about the topics its platforms are likely to highlight. Polarization is closely connected to nationalization. Greater interparty differences seem likely to coincide with reduced intraparty geographic diversity, as each party's state affiliates converge in their agendas and priorities. Nonetheless, polarization could coincide with continued geographic differences, especially if the Democratic and Republican parties polarize on distinctive state- or region-specific agendas.
To answer that question about nationalization, we generated measures similar to those above that examined the interstate similarity in topic usage. These measures tell us how much of the variation in topic usage is across states. Because our collection of platforms is not balanced by region or party—and because the polarization documented so vividly above may confound cross-state estimates—we focus on within-party shifts and briefly detail summary measures including both parties in the Appendix.
Using eight-year windows of data, we estimated within-party nationalization measures as follows. We first took each state and estimate a K-length vector indicating the mean share of that state's platforms devoted to each topic. We then subtracted the corresponding means for all other states, took the absolute value, and summarized the vector of absolute differences via a mean. We then replicated this procedure for each state and summarized the results across states by taking a weighted mean. This process yielded the average difference in topic usage by state.
In Figure 12, the state-level similarity measures are plotted separately for Republican and Democratic Party platforms. (Appendix Figures A.13 and A.14 plot the trends by party over longer periods of time for unigrams and bigrams, respectively.) Higher values indicate greater within-party differences. Here, too, we focus our analysis and inference principally on the decades after 1990, when the set of major topics dominating American politics was likely to be more consistent. As the figures make clear, in these decades, the Republican Party platforms appeared to be more similar across states than the Democratic Party platforms. This evidence reinforces arguments by Galvin, Rodden, Grossman, and Hopkins about the asymmetries in the political parties.Footnote 106 Consistent with Hertel-Fernandez,Footnote 107 we see evidence of increasing similarity among Republican state parties’ agendas in this period. Nonetheless, the more dramatic shift occurs among the Democrats: Although the party remains more heterogenous in terms of its issue agenda than the Republicans, the Democrats’ interstate distinctiveness has declined by more than the Republicans’ since early 1990, and today neither party acts like the broad, regionally diverse coalition they once were.Footnote 108
This is consistent with the nationalization of the political agenda, as many states have increasingly given similar attention to a range of high-profile topics. During the same period that topics used by the two parties grew more distinctive from one another, the topics used by specific states grew more similar. Note, too, that nationalization appears to unfold at roughly the same time as polarization, as interstate differences declined markedly in the 1990s. This finding suggests that the two trends may travel together and result from some of the same causes.
4. Discussion and Conclusion
A diverse country of fifty states and 330 million people, America nonetheless channels its varied political divisions into competition between just two political parties. Historically, those two parties were decentralized, enabling them to focus on different issues and even adopt different positions in different states. In recent years, though, the closely related trends of polarization and nationalization have served to homogenize the parties. Parties that were once collections of local retailers are now clearly national brands, more McDonalds than mom and pop. In tandem, these trends stand to reconfigure American federalism, as they may circumvent the coalitional diversity touted by prior scholarship.
To date, research on polarization has primarily focused on federal politics and federal political institutions, with less attention to analyzing how these trends have unfolded at the state level.Footnote 109 Even so, researchers can gain valuable new insights about the likely causes of polarization and nationalization by studying the timing of and extent to which these two trends manifest in state-level politics.
Here, we advanced that effort by analyzing 1,783 state (and national) party platforms issued between 1918 and 2017. Our results provide important clues about how and when state-level political agendas shifted—and also about how polarization and nationalization have unfolded. Specifically, we combine supervised analyses that categorize three-word phrases with unsupervised topic models to characterize the political agenda in American state party platforms over a century. We also provide excerpts from indicative platforms to confirm key trends. Our analysis illustrates, for example, that polarization is clearly evident in commonly used trigrams. It also shows that novel phrases often emerge first in state platforms, meaning that top-down models of partisan agenda setting are incomplete. Our analyses further demonstrate that while social issues grew in prominence in the period after around 1990, that growth was not solely responsible for polarization. After all, some of the most polarized topics in the post-2000 period turned out not to be social issues, and economic issues get more attention overall. So a polarized and nationalized political agenda is not necessarily one that focuses primarily on social issues. That said, our analyses document clear declines in attention to regional economic issues like agriculture over the period we study.
Our analyses also let us identify the timing at which state-level platforms manifested growing polarization and nationalization. There is clear state-level evidence of polarization beginning in the mid-1990s, meaning that polarization in state-level platforms was growing at roughly the same time as polarization in congressional rhetoric.Footnote 110 Nationalization proved difficult to measure over broad swaths of time, but it, too, has generally been on the rise since around 1990. Those observations, in turn, undercut claims that either phenomenon is principally a top-down process driven by developments in Washington, DC. Changes internal to Congress are unlikely to explain why Colorado's state parties increasingly adopted the rhetoric and issues of their national copartisans. Our analyses instead bolster accounts that emphasize causes that act simultaneously at the state and federal levels, including those pointing to shifting party networks, activist ideology and commitments, and communication media. They also bolster characterizations of contemporary American parties that emphasize the rapid movement of information and rhetoric across the levels of the federal system without consistent hierarchies.Footnote 111 Topics and frames clearly travel from federal politics to state-level politics, but they make the reverse trip, too.
This collection of state party platforms promises to help answer a range of additional questions about American politics. Future work might productively consider the relationship between issue salience and state governmental authority as well. For example, some of the issues that the parties have become polarized on are matters that are substantially within each state's control (such as state tax rates or gun regulations), while others are for the most part outside of state governments’ jurisdiction (e.g., immigration). To what extent do patterns of polarization and nationalization differ as a function of an issue's traditional “place” in the federal division of authority? The figures we present regarding specific issues—such as labor, abortion, and civil rights—demonstrate patterns that could also serve as a starting point for an in-depth study of the content of state party positioning on these important policy matters. Furthermore, our initial categorization of trigrams could be extended to consider additional dimensions, such as the extent to which the parties use abstract versus concrete language as they elaborate their positions and the affective tone of this form of political position-taking over time. We view the current analysis of the corpus of nearly 1,800 platforms as a starting point for what we hope will be a growing literature engaging a diverse range of scholars.
Supplementary material
To view supplementary material for this article, please visit https://doi.org/10.1017/S0898588X22000013
Acknowledgments
This article was previously presented at the 2016 Annual Meeting of the American Political Science Association, the 2019 Text as Data Association meeting (Stanford University), the Rutgers Computational Social Science Institute (June 18, 2020), the University of Pennsylvania Computational Linguistics Lunch (September 21, 2020), Washington University's American Politics Workshop (November 17, 2020), and the University of Michigan's Political Communication Working Group (November 20, 2020). The authors especially thank Noah Smith for serving as a discussant and gratefully acknowledge helpful comments from Jacob Montgomery, Ben Noble, Andrew Reeves, Philip Resnik, Robert Shaffer, Gaurav Sood, Stuart Soroka, David Mayhew, and Craig Volden. Additionally, the authors acknowledge research assistance from Emma Arsekin, Francois Barrilleaux, Cedar Casper, Jacob Denenberg, Matthew Garber, Gregory Gelzinis, Tori Gorton, Dan Grushkevich, Sam Mitchell, Bhavana Penmetsa, Georgia Ray, Gabrielle Rothschild, Janelle Schneider, Anna Weissman, and Amelia Whitehead. The authors thank a group collecting state party platforms including Dan Coffey, Brian Feinstein, Dan Galvin, Gerald Gamm, John Henderson, Joel Paddock, and Justin Phillips.