INTRODUCTION
The rice–wheat cropping system is the principal traditional agricultural production system in the Indo-Gangetic Plains of South Asia. It occupies c. 13·5 million ha spread over India, Bangladesh, Nepal and Pakistan (Ladha et al. Reference Ladha, Fischer, Hossain, Hobbs and Hardy2000). In India, rice–wheat rotations cover c. 9·2 million ha (Jat et al. Reference Jat, Saharawat and Gupta2011) and they are the principal source of food and livelihood security for several hundred millions of people in this densely populated region (Paroda et al. Reference Paroda, Woodhead and Singh1994). It is estimated that by 2020, food grain requirement would be almost 30–50% more than the current demand (Paroda & Kumar Reference Paroda and Kumar2000). Several researchers have studied the long-term rice–wheat experiments in South Asia and found that there are signs of stagnation or decline in yields, after an initial rise in productivity during the 1970s and early 1980s with the introduction of high-yielding varieties and adoption of improved cultural practices (ICAR 1998; Dawe et al. Reference Dawe, Dobermann, Moya, Abdulrachman, Singh, Lal, Li, Lin, Panaullah, Sariam, Singh, Swarup, Tan and Zhen2000; Duxbury et al. Reference Duxbury, Abrol, Gupta, Bronson, Abrol, Bronson, Duxbury and Gupta2000; Yadav et al. Reference Yadav, Dwivedi and Pandey2000; Bhandari et al. Reference Bhandari, Ladha, Pathak, Padre, Dawe and Gupta2002; Ladha et al. Reference Ladha, Dawe, Pathak, Padre, Yadav, Singh, Singh, Singh, Singh, Kundu, Sakal, Ram, Regmi, Gami, Bhandari, Amin, Yadav, Bhattarai, Das, Aggarwal, Gupta and Hobbs2003; Pathak et al. Reference Pathak, Ladha, Aggarwal, Peng, Das, Singh, Singh, Kamara, Mishra, Sastri, Aggarwal, Das and Gupta2003; Yadvinder-Singh et al. Reference Yadvinder-Singh, Ladha, Khind, Gupta, Meelu and Pasuquin2004; Nayak et al. Reference Nayak, Gangwar, Shukla, Mazumdar, Kumar, Raja, Kumar, Kumar, Rai and Mohan2012). Declining soil fertility, changes in water-table depth, deterioration in the quality of irrigation water and rising salinity, increasing resistance to many pesticides, and inadequate crop and nutrient management are considered as some of the general causes for this decline (Joshi & Tyagi Reference Joshi, Tyagi, Svendsen and Gulati1994; Sinha et al. Reference Sinha, Singh and Rai1998; Ladha et al. Reference Ladha, Dawe, Pathak, Padre, Yadav, Singh, Singh, Singh, Singh, Kundu, Sakal, Ram, Regmi, Gami, Bhandari, Amin, Yadav, Bhattarai, Das, Aggarwal, Gupta and Hobbs2003; Aggarwal et al. Reference Aggarwal, Joshi, Ingram and Gupta2004). It is also reported that many of the systems have low yields because of inappropriate water management (Timsina & Connor Reference Timsina and Connor2001). The situation will be further complicated by climate change, which will have various direct and indirect influences on production.
The Fourth Assessment Report of the Intergovernmental Panel on Climate Change (IPCC Reference Parry, Canziani, Palutikof, van der Linden and Hanson2007b) stated that the earth's temperature increased by 0·74 °C between 1906 and 2005, due to increases in anthropogenic emissions of greenhouse gases. In India, the mean annual temperature has shown a significant warming trend of 0·05 °C/decade during the period 1901–2003 and the period from 1971–2003 has seen accelerated warming of 0·22 °C/decade, with unprecedented warming during the last decade (Kothawale & Rupa Kumar Reference Kothawale and Rupa Kumar2005). Observational analysis of the data from121 weather stations spread over India has shown an increase in intensity and frequency of hot events and also a decrease in frequency of cold events (Revadekar et al. Reference Revadekar, Kothawale, Patwardhan, Pant and Rupa Kumar2012). More than three quarters of the stations show decreasing trends in the number of cold events, and c. 0·70 stations show an increasing trend in hot events. It also reported that 11 of the last 12 years rank among the 12 warmest years in the globe since 1850 (IPCC Reference Solomon, Qin, Manning, Chen, Marquis, Averyt, Tignor and Miller2007a). Several countries in the tropical Asia region have reported increasing surface temperature trends in recent decades (Rupa Kumar et al. Reference Rupa Kumar, Krishna Kumar and Pant1994; NATCOM 2004; IPCC Reference Parry, Canziani, Palutikof, van der Linden and Hanson2007b). The spatial patterns of observed extreme daily maximum temperatures indicate that the maximum temperatures recorded over the central parts of India exceed 45 °C, whereas along the west coast, the extreme maximum temperatures recorded range from 35 to 40 °C (NATCOM 2004). It has been estimated that for every 1 °C rise in mean temperature, there is a corresponding 7% decline in rice yield (Bouman et al. Reference Bouman, Barker, Humphreys, Tuong and Molden2007). The International Food Policy Research Institute calculates a decline of 12–14% in world rice production by 2050 due to the effects of climate change (Nelson et al. Reference Nelson, Rosegrant, Koo, Robertson, Sulser, Zhu, Ringler, Msangi, Palazzo, Batka, Magalhaes, Valmonte-Santos, Ewing and Lee2009). Analysis of the historical trends of rice and wheat crops in the Indo-Gangetic Plains using regional statistics, long-term fertility experiments, conventional field experiments and crop simulation models has shown that rice yields during the last three decades are declining, which may be partly related to the gradual change in weather conditions (Aggarwal et al. Reference Aggarwal, Bandyopadhyay, Pathak, Kalra, Chander and Kumar2000; Pathak et al. Reference Pathak, Ladha, Aggarwal, Peng, Das, Singh, Singh, Kamara, Mishra, Sastri, Aggarwal, Das and Gupta2003). Wheat production could be reduced by 4–5 million tonnes with every 1 °C temperature throughout the growing period, even after considering positive carbon fertilization benefits but no other adaptation benefits (Aggarwal Reference Aggarwal2008). Several researchers have confirmed the decline in agricultural productivity with climate change through simulation approaches (Saseendran et al. Reference Saseendran, Singh, Rathore, Singh and Sinha2000; Mall & Aggarwal Reference Mall and Aggarwal2002; Aggarwal et al. Reference Aggarwal, Kumar and Pathak2010; Subash & Ram Mohan Reference Subash and Ram Mohan2012).
The Inter-Governmental Panel on Climate Change has projected that the global mean surface temperature will rise by 1·4–5·8 °C by 2100 (IPCC Reference Solomon, Qin, Manning, Chen, Marquis, Averyt, Tignor and Miller2007a, Reference Parry, Canziani, Palutikof, van der Linden and Hansonb). Climate variability is also projected to increase, leading to uncertain onsets of monsoons and more frequent extremes of weather, such as more severe droughts and floods. In a recent study under the Coupled Model Inter-Comparison Project 5, projected under the business-as-usual scenario, mean warming in India is likely to be in the range of 1·7–2·0 °C by the 2030s and 3·3–4·8 °C by the 2080s relative to pre-industrial times, and precipitation may increase by 4–5% by the 2030s and 6–14% by the 2080s compared with the 1961–1990 baseline (Chaturvedi et al. Reference Chaturvedi, Joshi, Jayaraman, Bala and Ravindranath2012). An increase in the frequency of extreme precipitation days (>40 mm/day) for 2060 and beyond is also predicted. In India, the monsoon enters over the main lands through the Kerala Coast during the last week of May to the first week of June, so rice can be transplanted in the puddled fields after good initial monsoon showers. Similarly, the monsoon starts to withdraw from the northwestern part of the country in the first week of September and has gone completely by mid-October. Hence, as far as the rice crop is concerned, June–October rainfall is crucial. Jearakongman et al. (Reference Jearakongman, Rajatasereekul, Naklang, Romyen, Fukai, Skulkhu, Jumpaket and Nathabutr1995) showed that grain yield was severely affected when standing water disappeared >20 days before anthesis, while the presence of standing water 20 days after anthesis resulted in higher yields. For wheat, the maximum temperature is more crucial than any other single climatic variable.
However, with the adoption of integrated nutrient management practices, the ill-effects of extreme climatic conditions can be minimized. There is an urgent need to quantify the response of different integrated nutrient management practices to extreme climatic conditions under the rice–wheat system under the projected climate-change scenario. The present study aims to: (i) understand observed trends in climate variables (ii) quantify the trends in the rice–wheat system productivity under various management practices (iii) investigate how the variability of rainfall and temperature affect productivity under different management practices and (iv) identify site-specific, climate-smart integrated nutrient management practices under the rice–wheat system.
MATERIALS AND METHODS
Study sites and experimental details
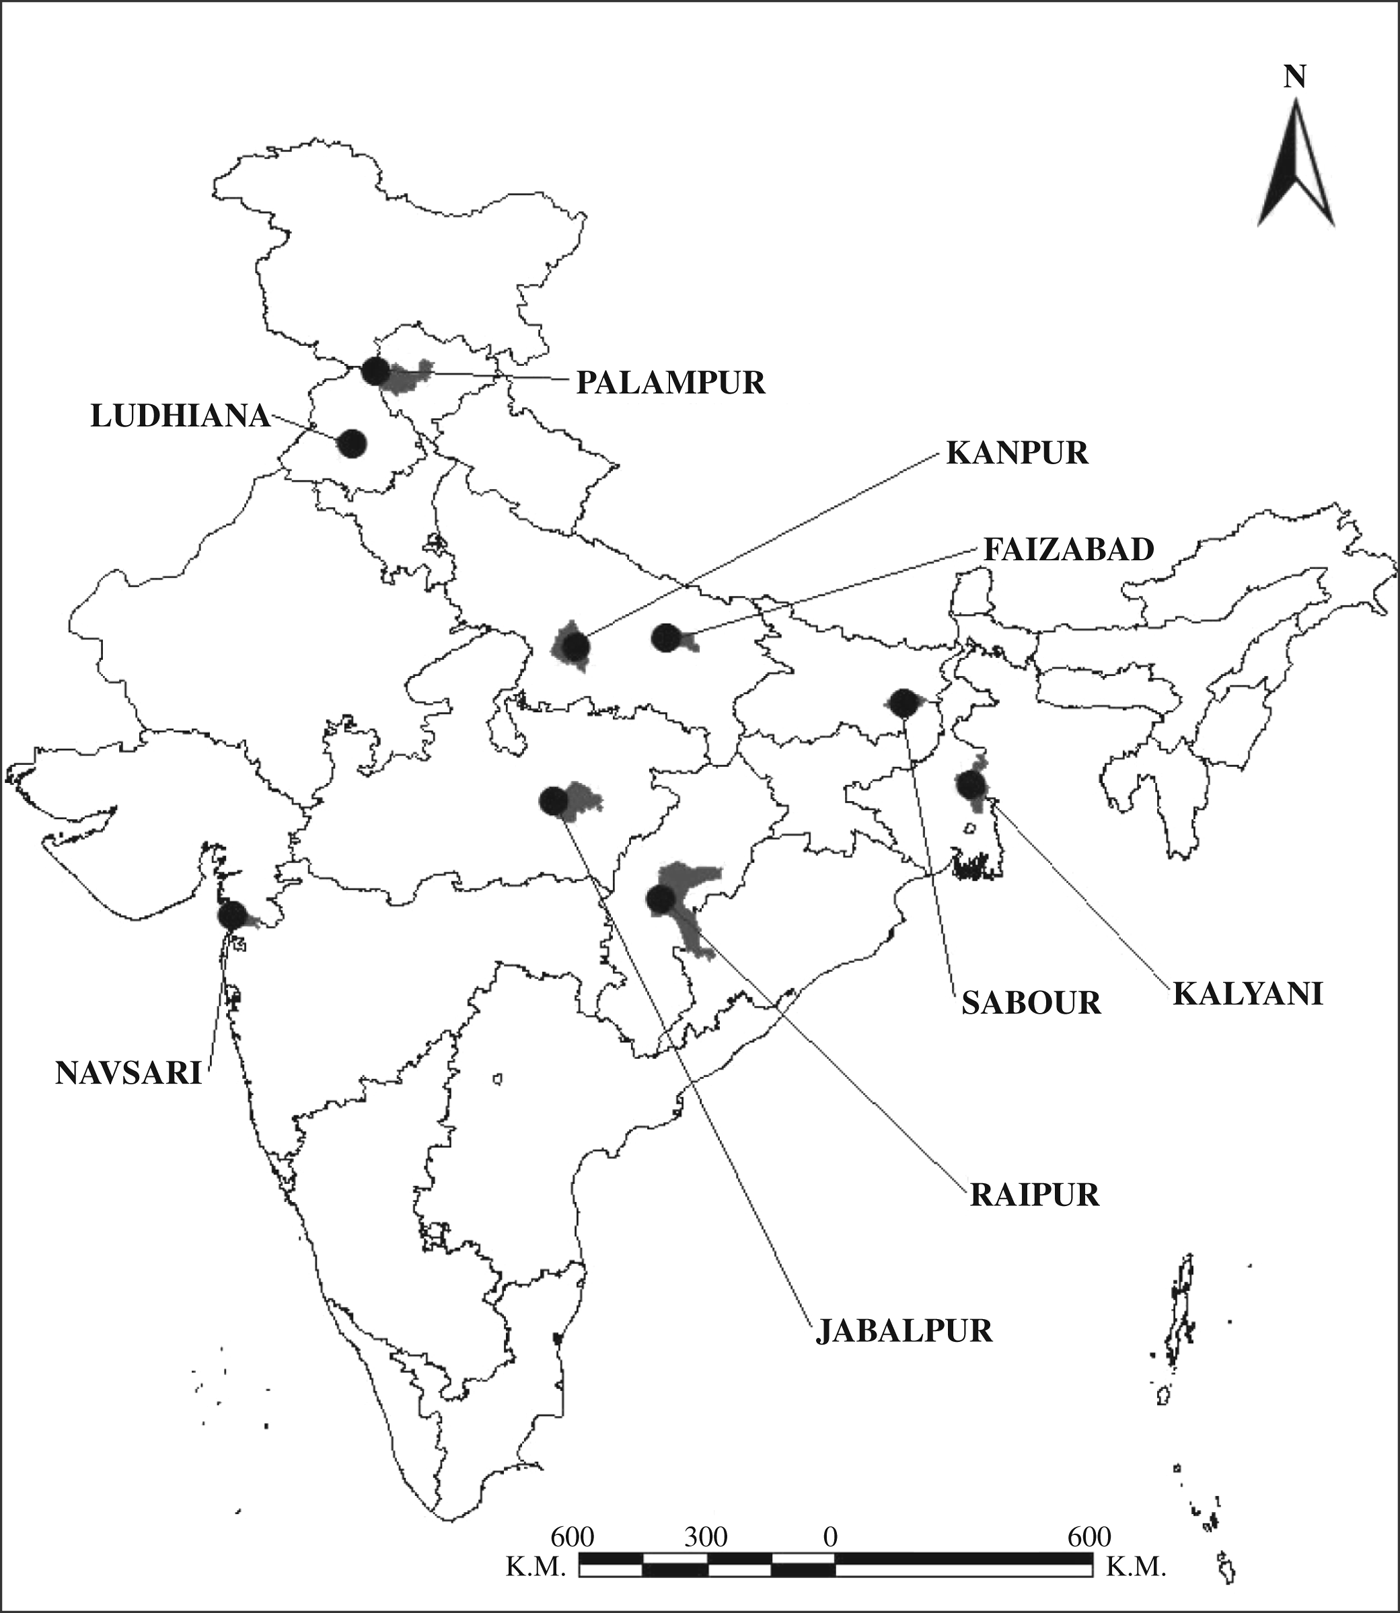
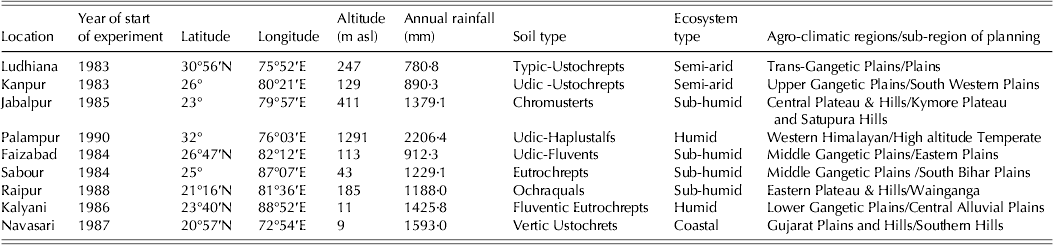
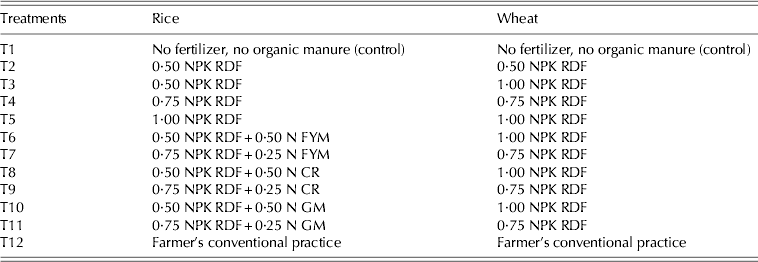
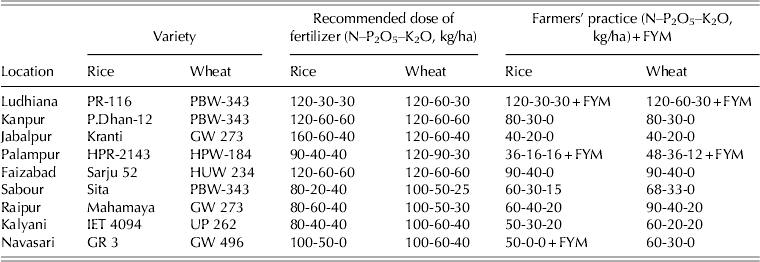
The present study was based on the yield data collected under the aegis of the All India Coordinated Project on Farming Systems Research of the Indian Council of Agricultural Research, located at nine sites representing different agro-ecological zones of India (Table 1 & Fig. 1). The ecosystems range from humid regions (Palampur & Kalyani) to a coastal one (Navasari). The grain yield datasets from long-term experiments on integrated nutrient management in rice–wheat cropping systems at these nine sites were used. There are 12 rice–wheat system treatments with different combinations of inorganic and organic sources of nutrient inputs (Table 2). In kharif rice (i.e. rice grown during the monsoon season), the full recommended levels of nitrogen (N), phosphorus (P) and potassium (K) were supplied through either inorganic fertilizers alone or in a range of different combinations with different organic N sources [e.g. farmyard manure (FYM), crop residue (CR; wheat straw/paddy straw) or green manure (GM; sesbania, a leguminous crop – Sesbania sesban (L) Merr.)], so that the full recommended N dose was made available to the crop. The nutrient concentrations of FYM varies according to the source, conditions and duration of storage, whereas that of CR varies with the time or method of incorporation. However, in the case of GM, it depends on the incorporation age of the sesbania. On average the N, P, K contents (g/kg on oven dry basis) in FYM ranges from 8–12 N, 2–4 P and 3·5–6·5 K; CR had 4–6 N, 0·5–1·5 P and 2–4 K; and GM had 18–24 N, 1–3 P and 15–21 K (Bhandari et al. Reference Bhandari, Ladha, Pathak, Padre, Dawe and Gupta2002). During June and July, the land was ploughed, puddled and levelled. For green manuring, an appropriate amount of above-ground sesbania biomass was chopped into 5–10 cm pieces, uniformly spread into the plot following flooding of the field and incorporated into the soil with an offset disc harrow, while the soil was being puddled for transplantion of rice. Sesbania was incorporated into the soil 1 day before transplanting. However, FYM and CR were incorporated into the moist soil 2 weeks before transplanting of rice. Two or three rice seedlings (25–30 days old) were transplanted in the puddle soil at 20×15 cm spacing. The rabi wheat (i.e. grown during the drier winter season) received inorganic NPK at the recommended dose only, and received no organic fertilizer inputs. After the rice was harvested in October–November, the land was prepared by ploughing and laddering, and wheat was sown. It was harvested in April. All P and K and half the dose of N were applied during sowing and the remaining N was top-dressed 21 days after sowing. Other recommended practices such as weeding, irrigation and plant protection measures were followed as per the recommended package of practices. During the long period of experimentation, the varieties were changed/replaced as per availability; however to continue the long-term nature of the experiment the varieties were selected in such a way as to match yields and duration to maintain the commonalities. Normally farmers were not followed the recommended dose of fertilizers and they apply different quantities and the 12th treatment dealt with farmers’ practice and this also different for different sites. The site-specific experimental details are given in Table 3.
Locations of the study sites.

Geographical coordinates, year of start, soil type, ecosystem type and agro-climatic regions/sub-region of the experimental sites
Experimental details
RDF, recommended dose of fertilizer; FYM, farmyard manure; GM, green manure (sesbania, a leguminous crop – Sesbania sesban (L) Merr.); CR, crop residue (wheat straw).
Site-specific experimental details
FYM, farmyard manure.
Weather data, trends and variability
Data were collected on the daily rainfall, maximum and minimum temperature and sunshine hours recorded at the nine study sites during the period 1980–2010. The observatories were installed many years ago under the guidance of technically qualified officers and the instruments calibrated according to the India Meteorological Department/World Meteorological Organization standard. All observations were recorded at the same time each day to maintain the homogeneity of readings. The Mann–Kendall (Mann Reference Mann1945; Kendall Reference Kendall1975) non-parametric trend test, which uses the rank achieved by each entry in the data series, was used for trend analysis; it is a statistical yes/no-type hypothesis testing procedure for the existence of trends and does not estimate the slope of trends. The magnitude of the trends was estimated using Sen Slope (Sen Reference Sen1968) and according to Hirsch et al. (Reference Hirsch, Slack and Smith1982), Sen's method was robust against extreme outliers. The Mann–Kendal test has been used by several researchers to detect trends in hydro-meteorological time-series data (Sneyers Reference Sneyers1990; Serrano et al. Reference Serrano, Mateos and Garcia1999; Brunetti et al. Reference Brunetti, Buffoni, Maugeri and Nanni2000a, Reference Brunetti, Maugeri and Nannib; Kundzewicz & Robson Reference Kundzewicz and Robson2000; Chiew & Sirivardena Reference Chiew and Sirivardena2005; Subash & Ram Mohan Reference Subash and Ram Mohan2011, Reference Subash and Ram Mohan2012; Subash et al. Reference Subash, Ram Mohan and Sikka2011a, Reference Subash, Sikka and Ram Mohanb). The averages of monthly, seasonal (rice season: June–October, wheat season: Novermber–April) and annual values for all weather variables and their sd and coefficients of variation (CV) (CV=(sd/mean)×100) were calculated in order to find out the variability during the study period.
Yield trends
The parametric test was performed to determine the presence of linear trends by examining the relationship between time (experimentation period in years) and yield of rice, wheat and system productivity (Y) in terms of rice equivalent yield, using a least-squares linear regression:
 $$Y = a + bt$$
where Y is the grain yield (t/ha) of rice or wheat or rice equivalent yield, a is the constant, b is the slope or magnitude of the yield trend (% change in yields per year) and t is the time (experimentation period in years). The rice equivalent yield was calculated according to the unit price of wheat and rice during the year 2012–2013.
Sustainability yield index
Several researchers (Reddy & Sudhakara Babu Reference Reddy and Babu Sudhakara2003; Sharma et al. Reference Sharma, Mandal, Srinivas, Vittal, Mandal, Grace and Ramesh2005; Dinesh Kumar et al. Reference Dinesh Kumar, Devaraju, Madaiah and Shivakumar2009; Gui et al. Reference Gui, Lei and Zeng2010; Nayak et al. Reference Nayak, Gangwar, Shukla, Mazumdar, Kumar, Raja, Kumar, Kumar, Rai and Mohan2012; Srinivasarao et al. Reference Srinivasarao, Venkateswarlu, Lal, Singh, Kundu, Vittal, Balaguravaiah, Vijaya Shankar Babu, Chary, Prasadbabu and Reddy2012b; Uzoho Reference Uzoho2012) have used the Sustainable Yield Index (SYI) to determine the sustainability of different cropping systems under different integrated nutrient management practices in long-term fertilizer experiments. The SYI indicates the minimum guaranteed yield obtained under different treatments; higher SYI values indicate the treatments are less affected by seasonal variations. The SYI was suggested by Singh et al. (Reference Singh, Das, Bhaskara Rao and Narayana Reddy1990) and used to adjust any annual variations in the yield due to differences in rainfall and also to highlight the relative yield of the treatments for the long-term experimental study period. The SYI is defined as:
 $${\rm SYI} = \left( {Y - \sigma} \right)/Y_{{\rm max}} $$
where Y is the average rice/wheat/system yield of a treatment/practice across the years, σ is the sd and Y max is the observed maximum yield in the long-term experiment during years of cultivation. The SYI was calculated separately for rice, wheat and the rice–wheat system.
Detection of site-specific climate-smart nutrient management practices
Year-to-year yield variability in rice and wheat is driven largely by rainfall and maximum temperature, respectively. As mentioned earlier, several researchers have reported that the yields of rice, wheat and rice–wheat systems have been increasing, decreasing and stagnating, respectively, as far as long-term time-series data are concerned. Thus, to quantify the influence of climatic variables on yield, the yield must first be de-trended. The observed yields were de-trended in a conventional manner (McQuigg et al. Reference Mcquigg, Thompson, Leduc, Lockard and Mckay1973; Sakamoto Reference Sakamoto1978; Easterling et al. Reference Easterling, Chen, Hays, Brandle and Zhang1996; Gopinathan Reference Gopinathan2000; Challinor et al. Reference Challinor, Slingo, Wheeler, Craufurd and Crimes2003, Reference Challinor, Wheeler, Slingo, Craufurd and Grimes2005; Brown et al. Reference Brown, Pervez, Wardlow, Tadesse and Callahan2008; Subash & Ram Mohan Reference Subash and Ram Mohan2010, Reference Subash and Ram Mohan2012) using a simple linear model with time as the independent predictor of yield. To normalize the yield, the yield anomaly index (YAI, the percentage deviation of the estimated trend yield to the actual yield) was worked out for rice, wheat and rice–wheat systems during the period of study for all the treatments.
The YAI for the ith year is
 $${\rm YAI}_{\rm i} = \left( {Y_{\rm i} - {\rm TY}_{\rm i}} \right) \times {\rm 1}00/{\rm TY}_{\rm i} $$
where YAIi is the yield anomaly index for the ith year, Y i is the actual yield for the ith year and TYi is the technological trend yield for the ith year.
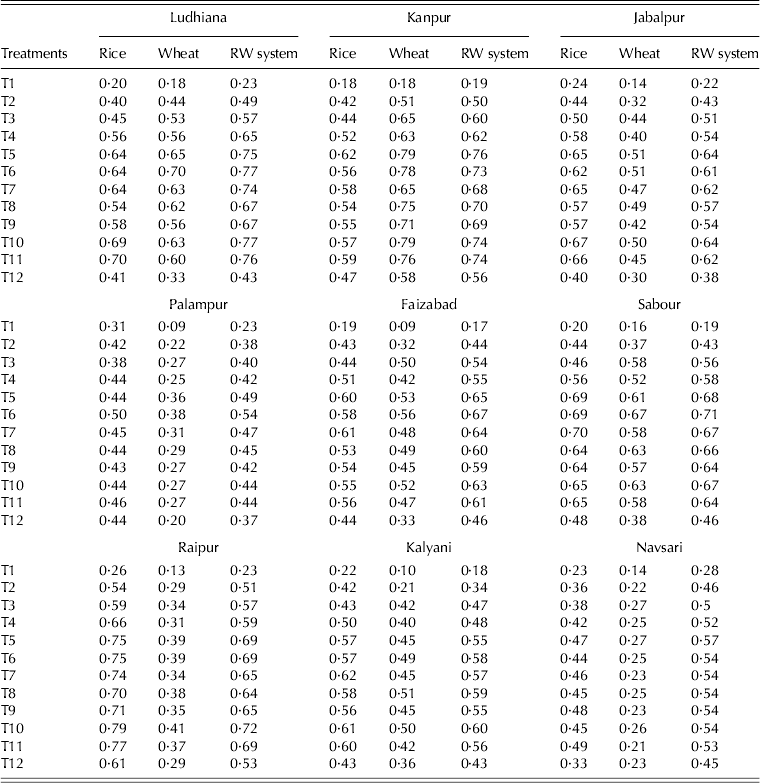
To quantify the influence of rainfall on rice yield, average YAI (for rice) was worked out for excess and deficit years based on half of the sd from the average seasonal rainfall during the crop season (mean±0·5×sd) (seasonal rainfall ⩾mean+0·5×sd for excess years, seasonal rainfall⩽mean–0·5×sd for deficit years) for all the treatments. Similarly, to quantify the influence of maximum temperature on wheat yield, the average YAI (wheat) was worked out for years having an average maximum temperature during the wheat season ⩾mean +1 °C for all the treatments. For the rice–wheat system, the simple average of rice yield anomaly and wheat yield anomaly indices (the rice–wheat (RW) anomaly index) was calculated for each treatment at all of the nine sites. The highest value of the RW anomaly index indicated the highest adaptive capacity of the treatment for sustainability under extreme climatic situations. Based on this index, the top three climate-smart nutrient management practices for rice–wheat systems were identified for each study site.
RESULTS
Rainfall variability and trends
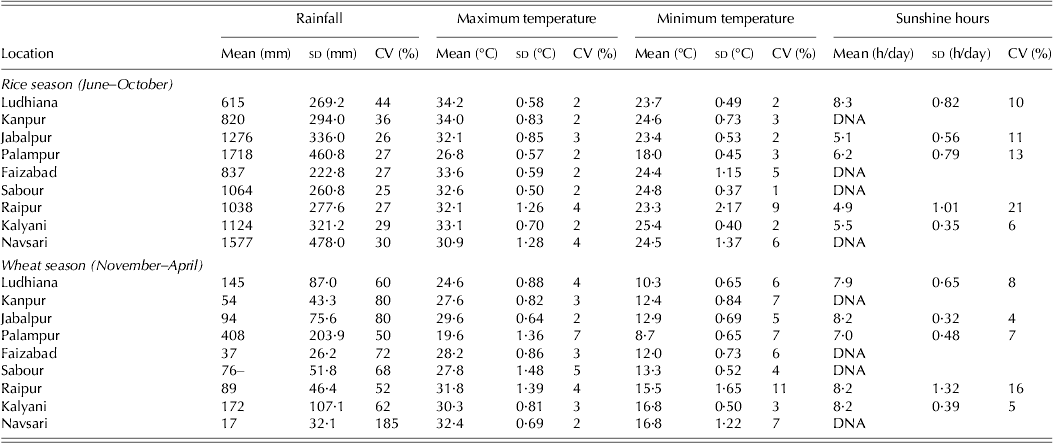
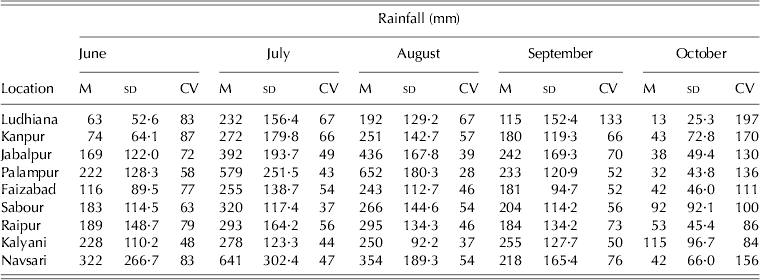
The mean seasonal rainfall during the rice season varied from 615 mm at Ludhiana to 1718 mm at Palampur (Table 4) and the CV ranged from 25% at Sabour to 44% in Ludhiana. However, large-scale variability was seen in the distribution pattern (Table 5). July was the rainiest month in Ludhiana, Kanpur, Faizabad, Sabour, Kalyani and Navsari, but August was the rainiest month at Jabalpur, Palampur and Raipur. At all sites except Kalyani, the CV was >50% during June, indicating higher variability of rainfall during that month; this might be due to fluctuations in the date that the monsoon began as well as the overlapping of pre-monsoon showers with monsoon showers. It was also observed that the variability of rainfall is high (CV>50%) for most of the month in the study sites. Even in September, the CV was >100%. In October, the CV for rainfall at all the sites except Raipur and Kalyani, was >100%. Rainfall during the wheat season varied from 17·3 mm at Navsari to 407·5 mm at Palampur and CV at all the sites was >50%, ranging from 185% at Navsari to 50% at Palampur.
Seasonal mean, sd and coefficient of variation of weather variables during rice- and wheat-growing periods at the different study locations
DNA, Data not available.
Mean monthly rainfall (M)(mm), its sd and coefficient of variation (CV%) during the rice season at different study sites
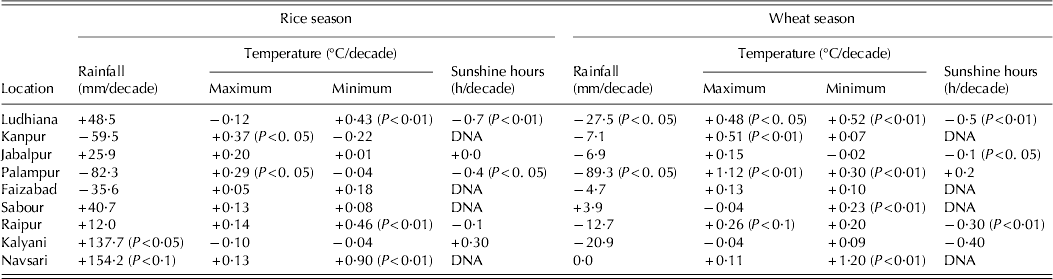
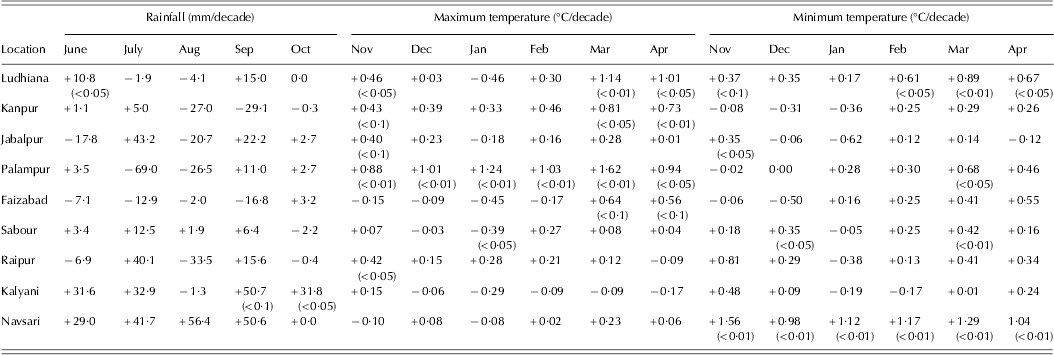
Positive trends were seen for rainfall during the rice season at all sites except Kanpur, Palampur and Faizabad, with significant increases of 137·7 (P<0·05) and 154·2 (P<0·01) mm/decade at Kalyani and Navsari, respectively (Table 6). However, decreasing trends were seen for rainfall during the wheat season at all sites except Sabour and Navsari (the latter showed no trend). Significant (P<0·05) decreases, of the order of 27·5 and 89·3 mm/decade, were recorded only at Ludhiana and Palampur, respectively, during the wheat season. As far as the monthly distribution of rainfall during the rice season is concerned, significant increasing trends for rainfall of the order of 50·7 mm/decade (P<0·1) and 31·8 mm/decade (P<0·05), respectively, were observed at Kalyani during September and October (Table 7). The trend for decreasing rainfall during August at most of the sites (seven out of nine) are a serious concern, as this period coincides with the tillering to flowering phase of the rice crop, which requires adequate moisture for potential growth.
Trends (per decade) in seasonal rainfall, maximum and minimum temperature and sunshine hours during rice and wheat
DNA, Continuous sufficient data were not available for trend analysis.
Positive and negative values indicate increasing and decreasing trends, respectively, during the study period.
Trends (per decade) in monthly rainfall (mm/decade) during kharif (rice season) and maximum and minimum temperature (°C/decade) during rabi (wheat). P levels are given in brackets
Positive and negative values indicate increasing and decreasing trends, respectively, during the study period.
Temperature variability and trends
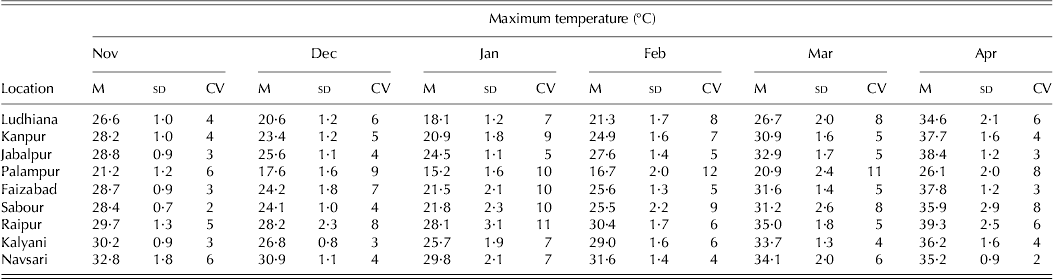
The average seasonal maximum temperature during the rice season varied from 26·8 °C at Palampur to 34·2 °C at Ludhiana and the minimum temperature varied from 18·0 °C at Palampur to 25·4 °C at Kalyani. The minimum temperature was more variable compared with maximum temperature at Kanpur, Palampur, Navsari, Faizabad and Raipur. A trend for increasing maximum temperature was noticed at all sites except Ludhiana and Kalyani, but this was only significant at Kanpur and Palampur where increases of the order of 0·37 °C/decade (P<0·05) and 0·29 °C/decade (P<0·05), respectively, were observed. The average maximum temperature during the wheat season varied from 19·6 °C at Palampur to 32·4 °C at Navsari, while average minimum temperature varied from 8·7 °C at Palampur to 16·8 °C at Kalyani and Navsari. For most of the sites, higher variability in maximum and minimum temperatures was seen during the wheat season, as evident from the higher coefficient of variation values. With regard to temperature distribution during the wheat season, the lowest maximum temperature occurred in January at all the sites and varied from 15·2 °C at Palampur to 29·8 °C at Navsari (Table 8). The CV at Palampur is higher compared with all other sites for all the months. The trend in maximum temperature during March increased at all the sites except Kalyani, with the highest value of 1·62 °C/decade at Palampur followed by 1·14 °C/decade in Ludhiana. This is again of great concern since this period coincides with the grain filling stage of wheat at most of the sites, depending on the dates of sowing and varieties used. Statistically significant trends (P<0·1 to 0·01) for increasing temperatures were observed at four out of the nine locations (Ludhiana, Kanpur, Palampur and Faizabad). Significant trends for increasing temperatures during April, of the order of 0·73 (P<0·01) and 0·56 °C/decade (P<0·1) at Kanpur and Faizabad, respectively, are also of great concern, since the general practice of delaying the sowing date of wheat in these eastern parts of the Indo-Gangetic Plains extends the grain filling stage of the crop in April, adversely affecting grain size and therefore yield.
Mean monthly maximum temperature (°C), its sd and coefficient of variation during the rice season at different study sites
Sunshine variability and trends
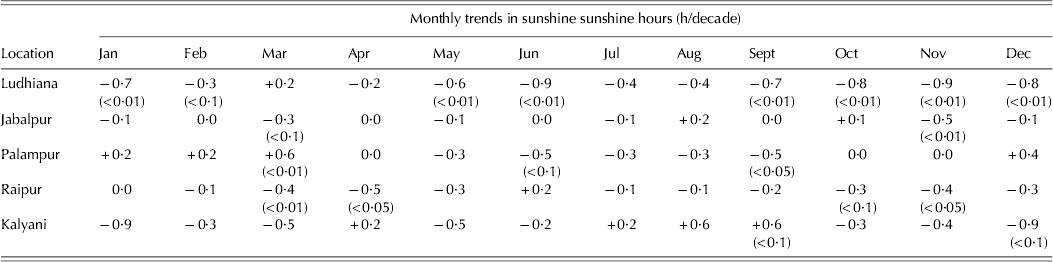
The average sunshine hours during the rice season varied from 4·9 h/day in Raipur to 8·3 h/day in Ludhiana. However, during the wheat season, it varied from 7·0 h/day in Palampur to 8·2 h/day in Jabalpur, Raipur and Kalyani. The number of sunshine hours decreased during the rice season at all sites except Kalyani and significant decreases of the order of 0·7 h/decade (P<0·01) and 0·4 h/decade (P<0·1) were noted at Ludhiana and Palampur, respectively. Similarly, all the sites showed trends for decreasing sunshine hours during the wheat season, with significant trends for decreasing sunshine hours of the order of 0·5 (P<0·01), 0·3 (P<0·01) and 0·1 h/decade (P<0·05) observed at Ludhiana, Raipur and Jabalpur, respectively. For monthly trends, a decrease of sunshine hours was noted at Luhiana in all months except March, with significant (P<0·01) decreases of 0·9 h/decade during June and November and 0·6 h/decade during May (Table 9).
Monthly trends (per decade) in sunshine hours (h/decade). P levels are given in brackets
Positive and negative values indicate increasing and decreasing trends, respectively, during the study period.
Long-term yield trends in rice–wheat yield
Rice yield trend
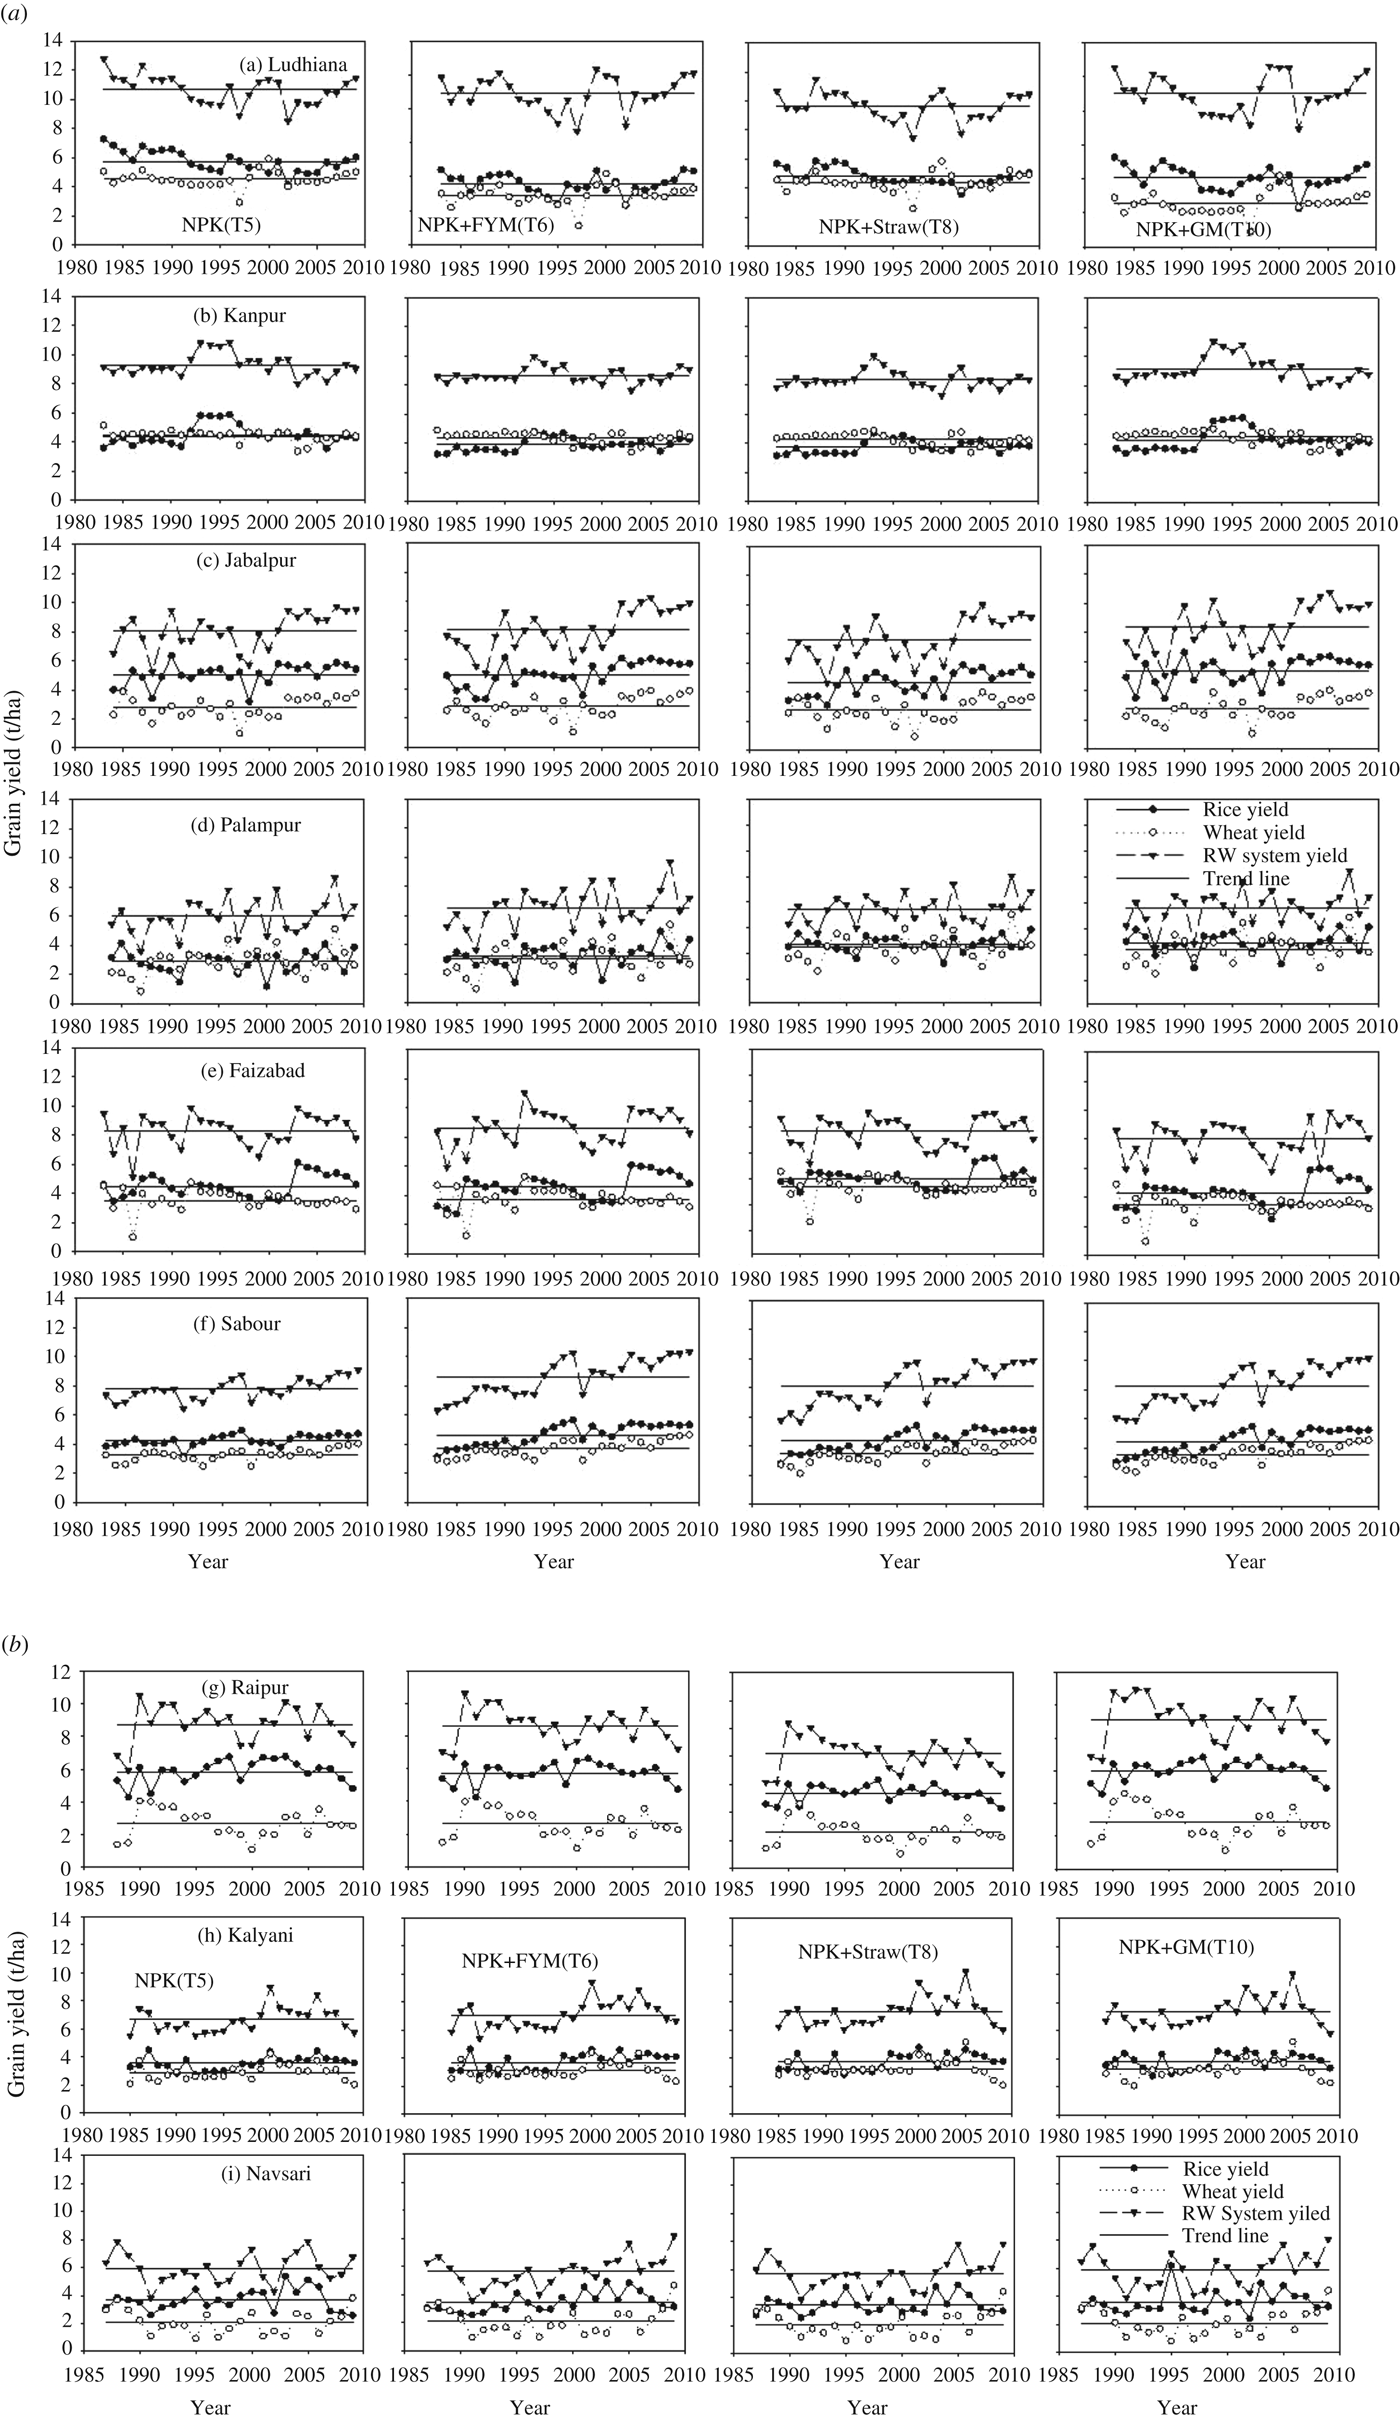
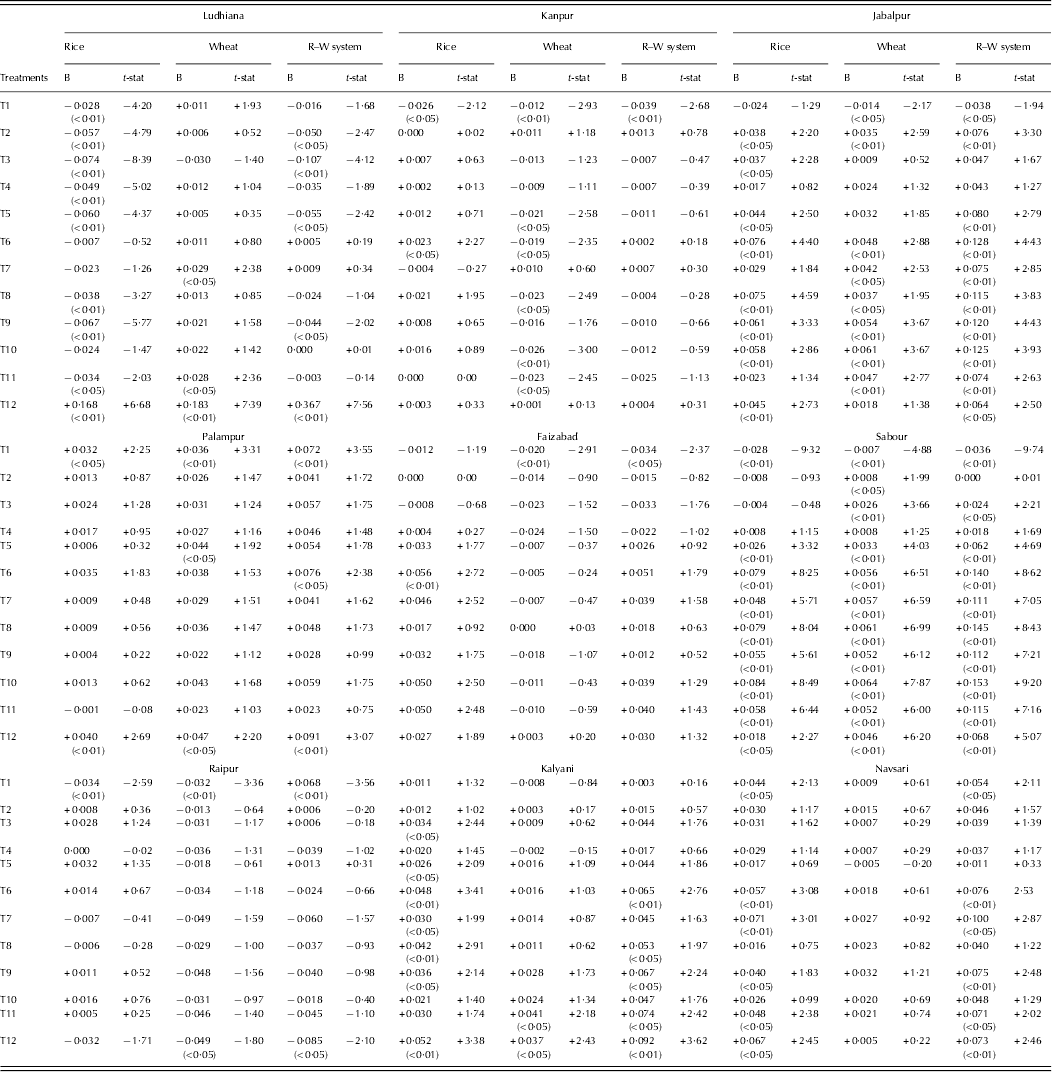
The time-series linear regression statistics of different treatments over the locations showed that no uniformity existed between the study sites (Table 10 & Figs 2(a) and (b)). It was noticed that at Ludhiana, all the treatments except farmers’ practice showed decreased trends for rice yield ranging from 0·074 to 0·067 t/ha/year. However, the decreases seen for incorporation of FYM (to provide either 0·5 or 0·25 of total N) or GM (0·5 of total N) combined with inorganic source of nutrients were not significant. At Navsari and Kalyani, all treatments showed increasing trends. A significant (P<0·01) trend for increasing yield of the order of 0·071 t/ha/year was observed with incorporation of 0·25 N through FYM at Navsari. At Sabour, all treatments with application of the recommended dose of fertilizers either through inorganic sources or in combination with FYM, CR or GM showed highly significant (P<0·01) trends for increasing yield ranging from 0·084 tha/year with the addition of 0·5 N through GM to 0·026 t/ha/year with the application of inorganic fertilizer only. At Faizabad, all treatments except for the control showed increasing trends. This was highly significant (P<0·01) for application of 0·5 N through FYM along with an inorganic fertilizer source of nutrients. In Jabalpur, all treatments except the control showed an increasing trend, with the highest value of 0·076 t/ha/year seen for application of 0·5 N through FYM treatment followed by 0·075 t/ha/year with the application of 0·5 N through CRs.
Variability and trends (fitted by linear regression) of rice, wheat and rice–wheat system yield with the application of NPK, NPK+FYM, NPK+CR and NPK+GM nutrient treatments at (a) Ludhiana, (b) Kanpur, (c) Jabalpur, (d) Palampur, (e) Faizabad, (f) Sabour, (g) Raipur, (h) Kalyani and (i) Navsari.
Long-term yield trend statistics under different fertilization treatments. P levels are given in brackets
B, Slope in t/ha (per year increase/decrease).
Wheat yield trend
In Ludhiana, all the treatments except 0·5 NPK (through inorganic fertilizers) showed an increasing trend in wheat yield, with significant (P<0·05) increases of 0·029 and 0·028 t/ha/year for the application of 0·25 N through FYM and 0·25 through GM, respectively. All treatments except the control showed an increasing trend in Jabalpur, Kalyani and Sabour. Interestingly, all treatments with incorporation of FYM, CR or GM showed a significant (P<0·01 to 0·1) increasing trend, with the highest (0·061 t/ha/year) noted with the application of GM. At Sabour, all treatments with application of the recommended dose of fertilizers either through inorganic fertilizers or in combination with FYM/CR/GM showed highly significant (P<0·01) increasing trends ranging from 0·064 to 0·033 t/ha/year. At Pantnagar and Navsari, all the treatments showed trends for increasing yield. However, at Kanpur, trends for a yield decrease were seen for all treatments except for the three treatments with 0·5 of recommended inorganic fertilizer during both the rice and wheat season and 0·25 N through FYM and farmers’ practice. The highest trend for decreasing yield of −0·026 t/ha/year was seen for the treatment providing 0·5 of the N through GM.
Rice–wheat system yield trend
All the treatments at Palampur, Kalyani and Navsari showed a trend for increasing yield of the rice–wheat system. The increase at Palampur ranged from 0·091 for farmers’ practice to 0·023 t/ha/year for supply of 0·25 N through GM. However, at Navsari, a trend for greater increase of the order of 0·100 t/ha/year was seen with the incorporation of 0·5 N through FYM. At Sabour and Jabalpur, all treatments except the control showed trends for increasing yield: it was noted that all treatments with the recommended dose of fertilizer through either inorganic sources or in combination with FYM, CR or GM showed highly significant (P<0·01 to 0·1) trends for increasing yield at these locations. In Faizabad, trends for increasing yield were seen with application of the recommended dose of fertilizers either through inorganic sources or in combination with FYM/CR/GM along with the farmers’ practice treatment. At Ludhiana and Kanpur, application of N through FYM treatments showed increasing yield trends while all other treatments showed decreasing yield trends. Application of the recommended dose of fertilizers through inorganic nutrient sources showed a trend for decreasing yield at both sites, with a significant (P<0·05) decrease of 0·055 t/ha/year in Ludhiana.
Changes in soil organic carbon, available nitrogen, phosphorus and potassium
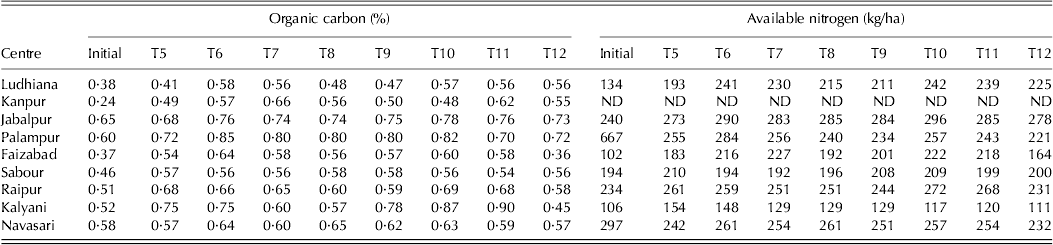
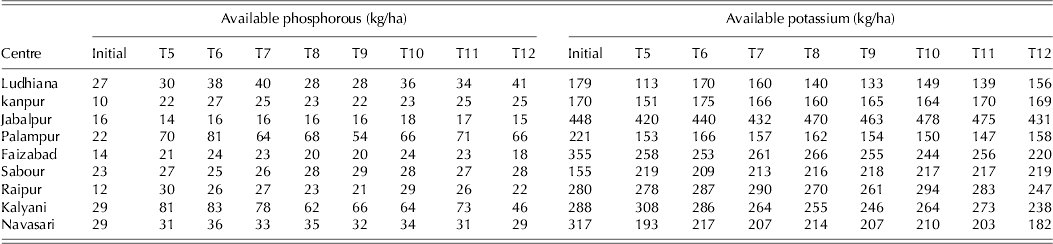
The long-term application of FYM, CR and GM under various treatments on soil organic carbon, available N, P and K at 0–15 cm depth are shown in Tables 11 and 12. It is clearly seen that relative changes of soil organic carbon, available N, P and K compared with initial increased substantially in treatments with incorporation of FYM, CR and GM along with inorganic fertilizers compared with inorganic fertilizer alone treatments. However, the rate of increase will be different for incorporation of FYM, CR and GM as well as for different sites because of the differing soil types and textures and also due to different climates.
Comparison of initial and buildup of organic carbon and available N during the last 20 years of long-term experiment in rice–wheat system under different treatments over different study sites
Compiled from Annual reports of AICRP-IFS centres during 2011/12; ND, no data available.
Comparison of initial and buildup of P and K during the last 20 years of long-term experiment in rice–wheat system under different treatments over different study sites
Compiled from Annual reports of AICRP-IFS centres during 2011/12.
Changes in response of continuous application of nutrient management practices on yield
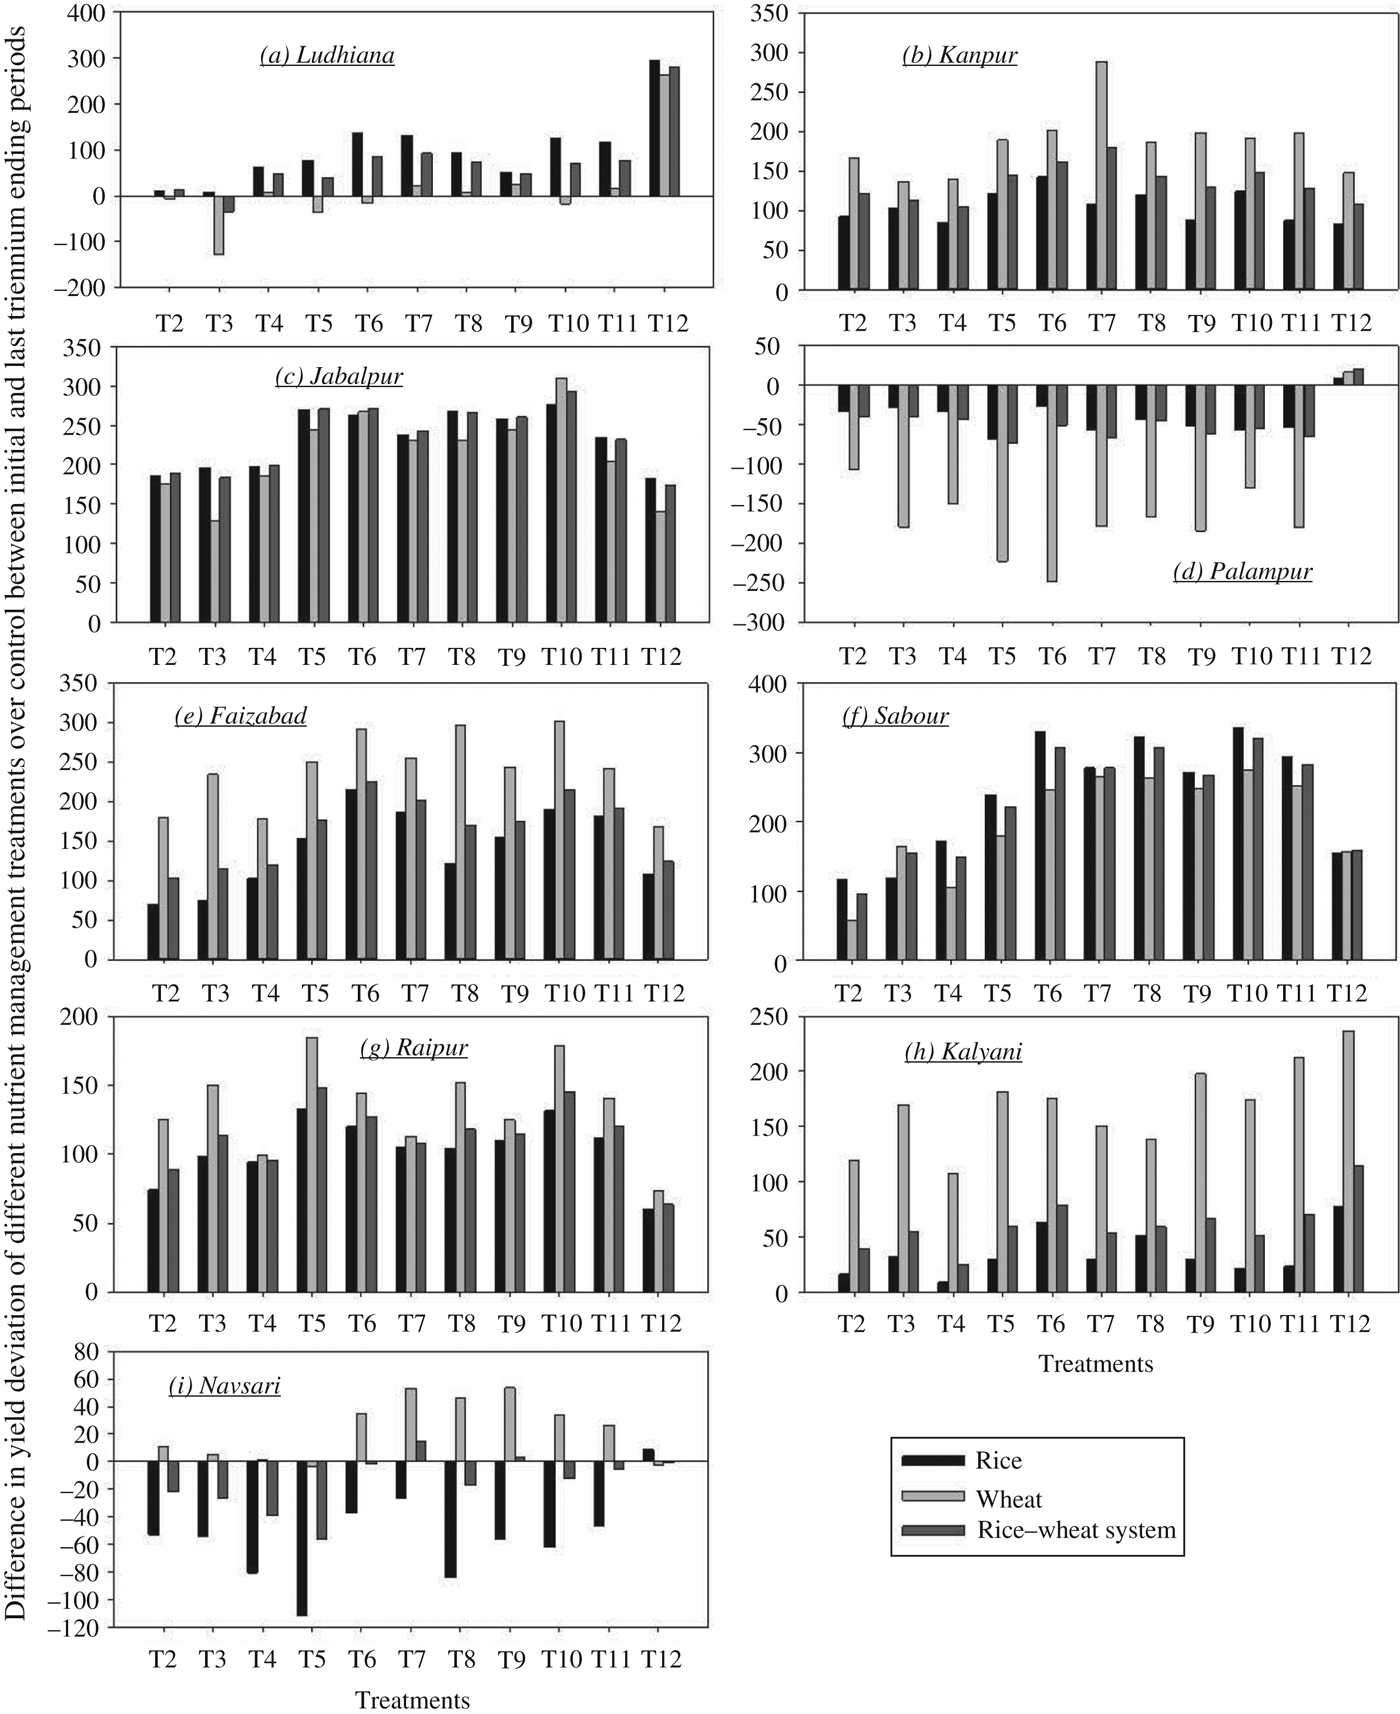
In order to determine the changes in response to continuous application of different nutrient management practices from the first to the last year of experimentation in the rice–wheat system over the control, the deviations between the average yields of the final 3 years (ending 2009) and those of the initial 3 years (ending 3 years after the start of the experiment) were calculated to avoid the effect of any particular year on yield response. It was noticed that for all the sites except Palampur and Navsari, the differences in yield deviation between the first and last 3 years showed positive values. This showed that the response of the crop to nutrient management either through inorganic fertilizers or in combination with FYM/CR/ GM was higher compared with the control after 27 years of continuous rice cropping during the kharif season. However, the magnitude of response is different for different nutrient management practices (Fig. 3). At Palampur and Navsari, all the treatments except for farmers’ practice showed lower yield response over the control during the last 3 years of the experiment (ending in 2009) compared with the initial 3 years. It was noted that at all the sites except Ludhiana and Palampur, wheat yield showed higher responses than the control during the 3 year to 2009 compared with the first 3 years of the experiment. For the rice–wheat system, at all the sites except Palampur and Navsari, all the treatments showed higher yield responses than the control during the 3 years to 2009 compared with the initial 3 years. This highlighted the need for modification of integrated nutrient management treatments with the incorporation of higher proportions of organic fertilizers (and therefore lower proportions of inorganic fertilizers). It also highlighted the need for modifications in the recommended dose of fertilizers.
Difference in yield deviation of different nutrient management treatments over the control between the first and last 3 years of long-term experiments at the selected study sites.
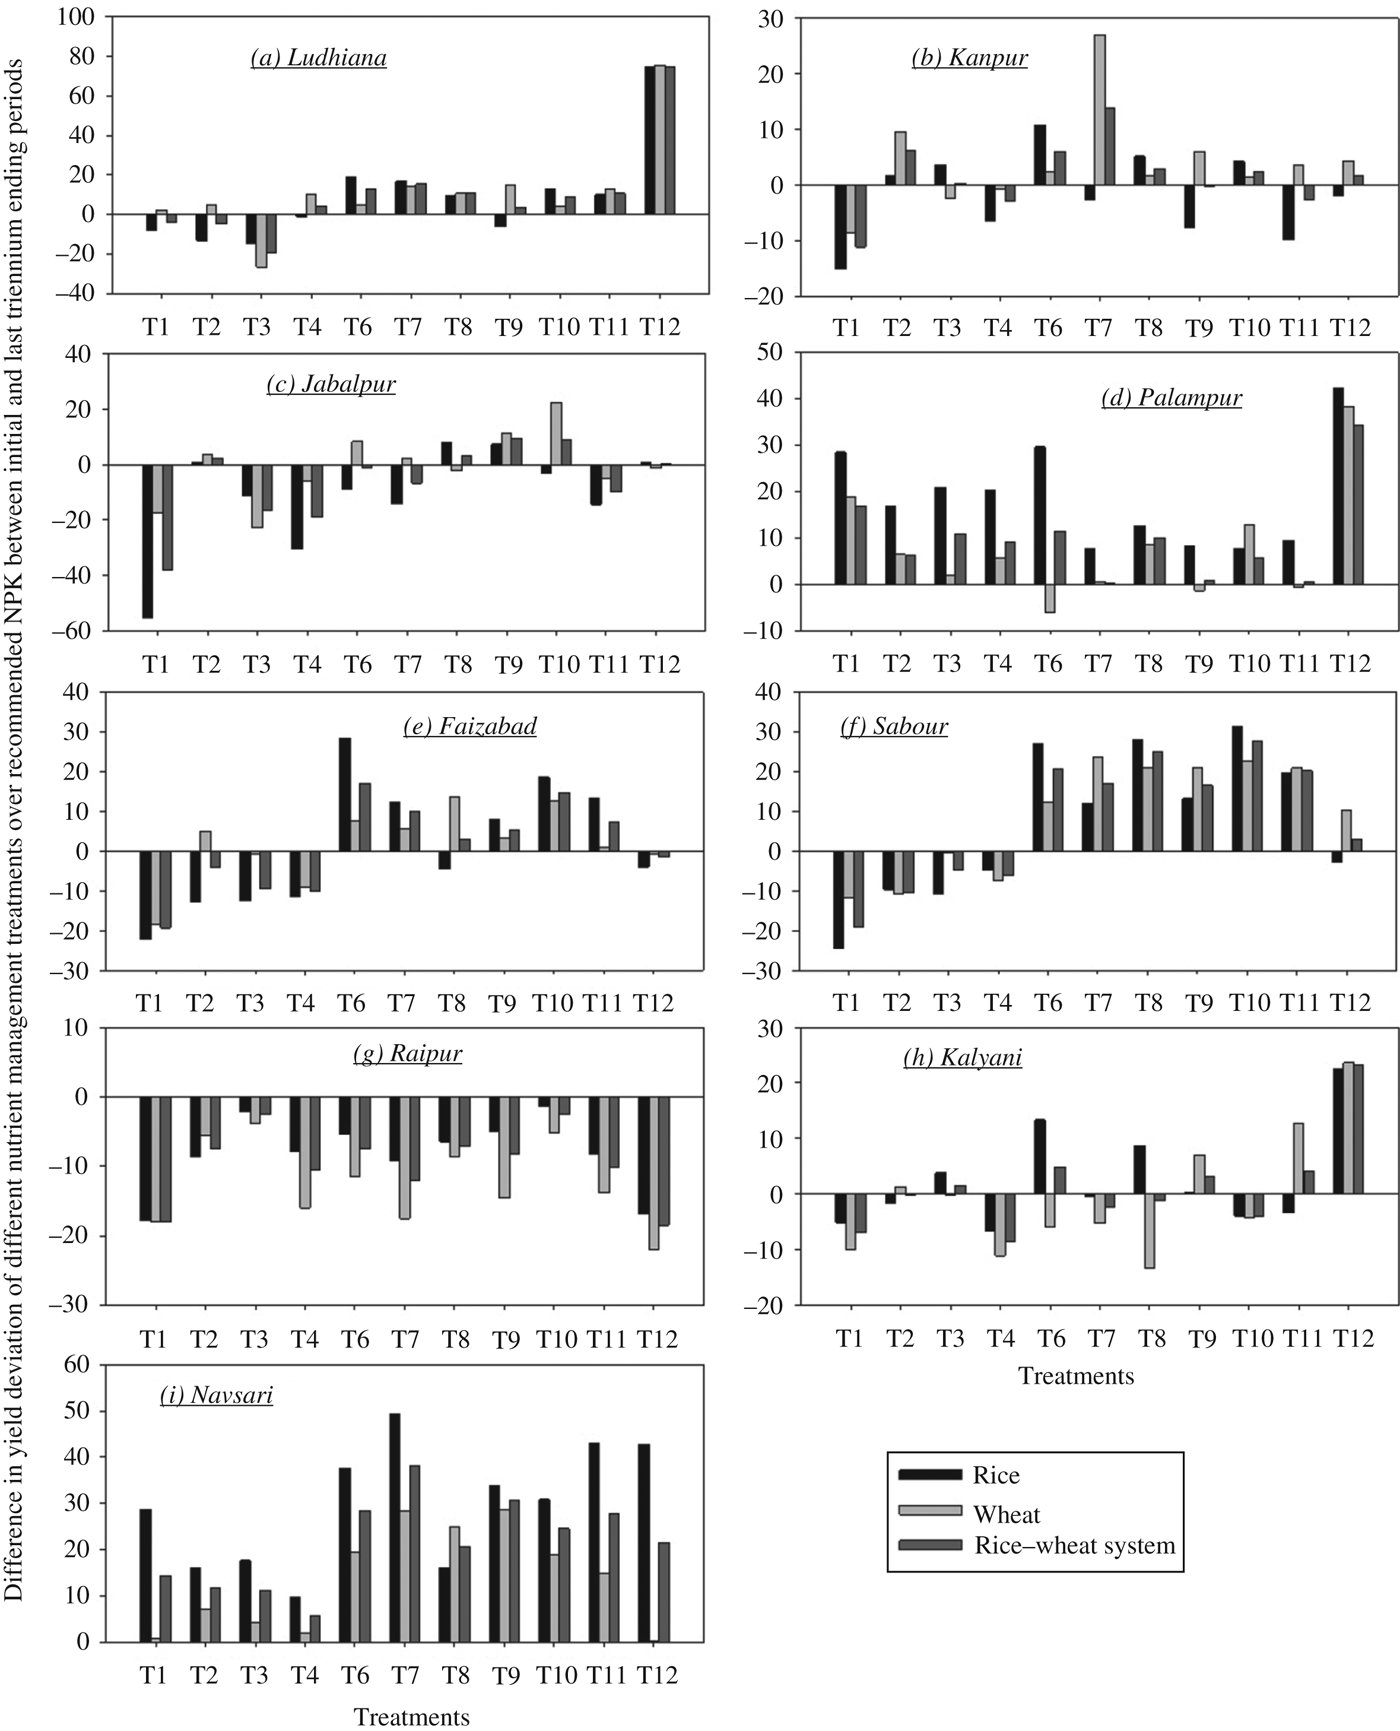
However, the difference in deviations of rice yield responses over the recommended dose of fertilizer treatment was positive with the addition of organic fertilizers, except for application of inorganic treatments at different combinations and substitution of 0·25 N through CR in Ludhiana (Fig. 4). Interestingly, the difference in deviation was higher for farmers’ practice. But in the case of wheat, all the treatments except for half the recommended dose of inorganic fertilizers were positive. For the rice–wheat system, all showed positive responses except for two treatments: 0·5 recommended dose of inorganic fertilizers in both seasons and 0·5 in the rice season only. It clearly showed that substituting FYM/CR/GM for inorganic N increased the yield compared with inorganic fertilizer alone over the duration of the experiment. The same pattern was also seen in Faizabad and Sabour. At all other sites, different treatments responded differently. At Navasari, the difference in the yield response over the recommended dose of fertilizer was positive in all treatments in the case of rice, wheat and the rice–wheat system.
Difference in yield deviation of different nutrient management treatments over recommended NPK between the first and last 3 years of long-term experiments at selected study sites.
Sustainability yield index
The SYI indicated that different integrated nutrient practices sustained the rice–what system productivity at different sites according to the nature of the climate (Table 13). There was a large difference in SYI between the control and other treatments. Rice yield was sustained at all the sites except Kanpur and Palampur with incorporation of FYM or GM to supplement the inorganic nutrient supply. Similarly, wheat yield as well as system productivity was sustained at all the sites except Kanpur and Navsari with incorporation of 0·5 N through FYM or GM.
Sustainable yield index (SYI) of rice, wheat and rice–wheat under different nutrient management practices for the study sites
RW system: rice–wheat system.
Relation between weather variables and quantification of climate resilience management practices
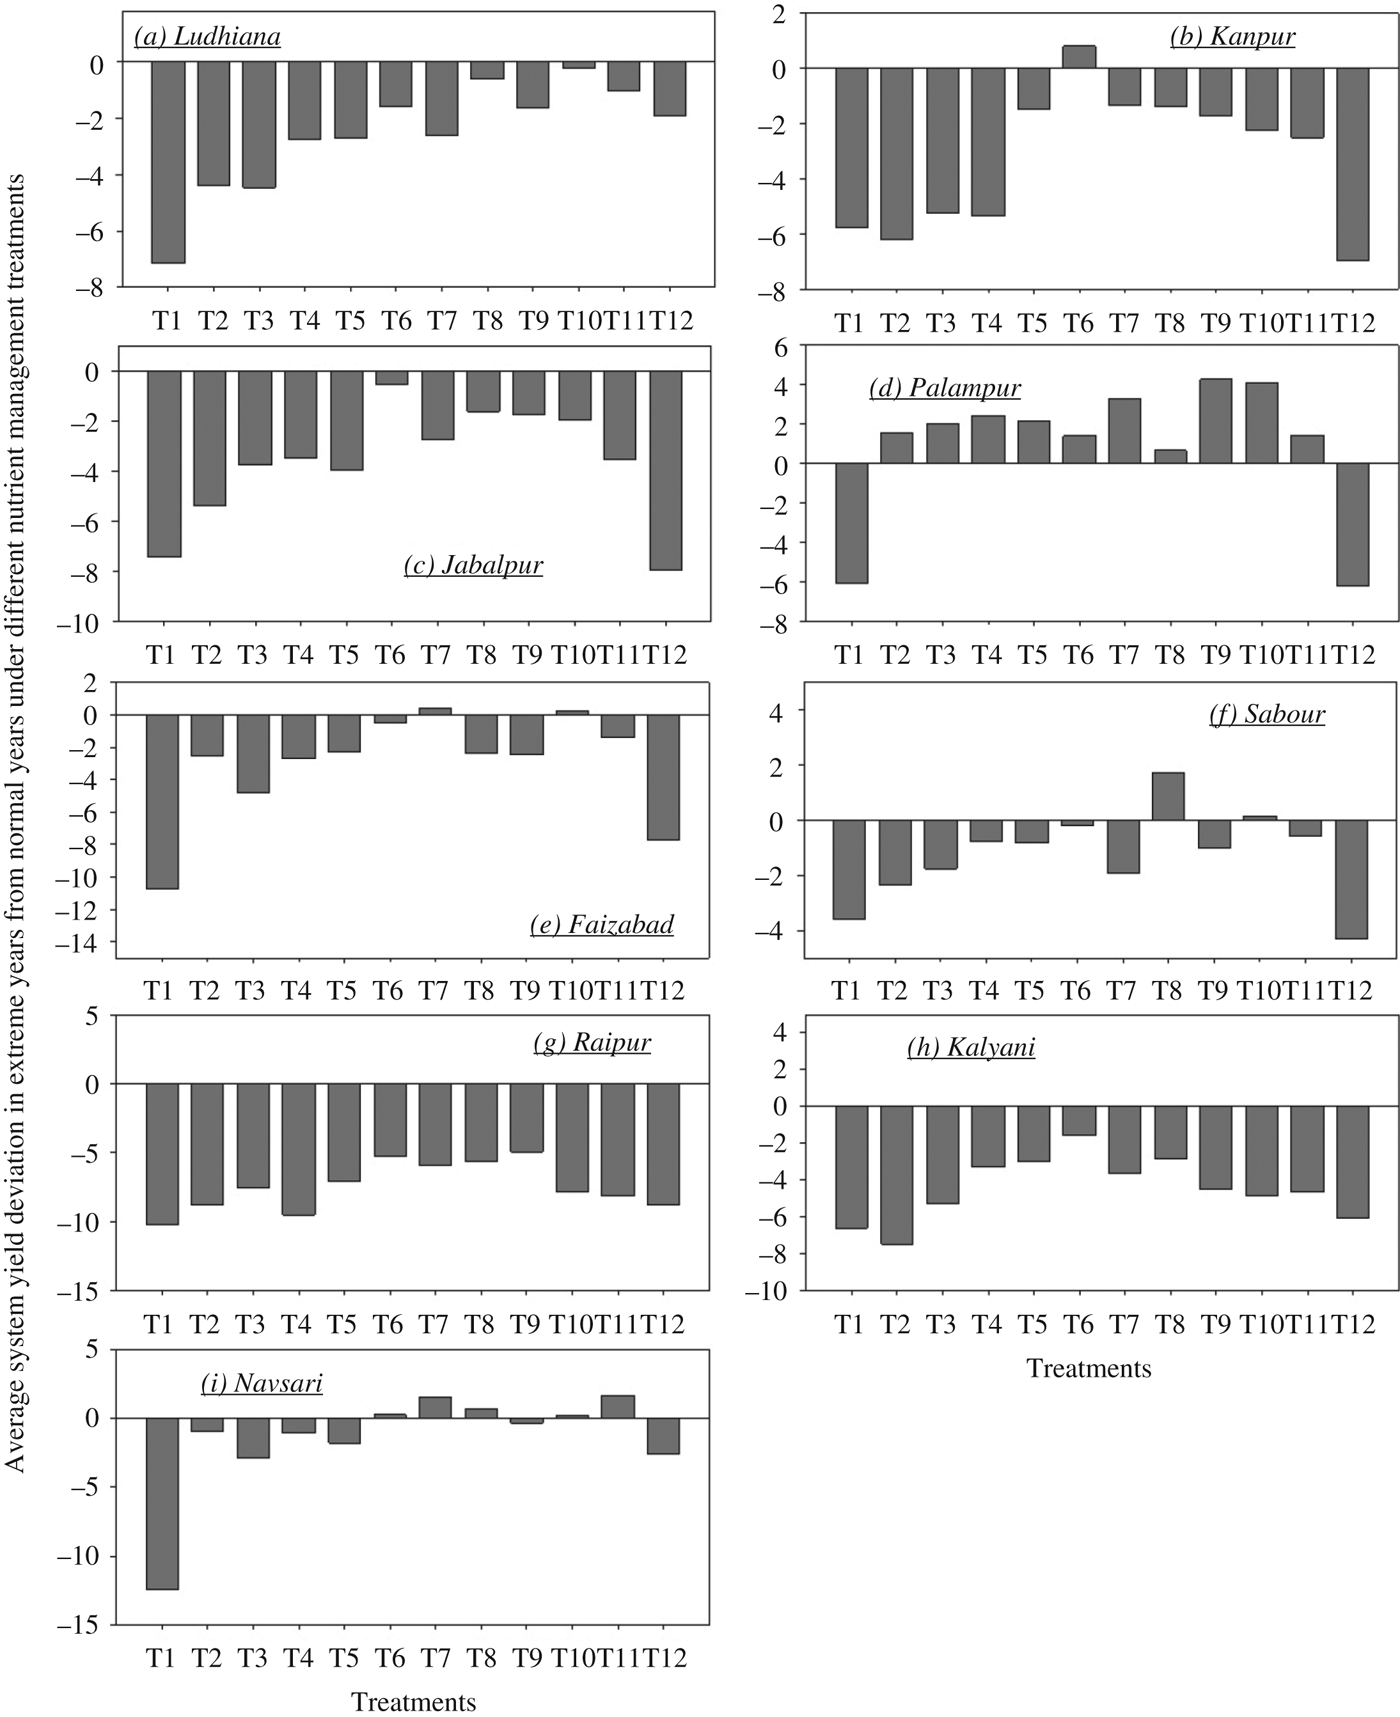
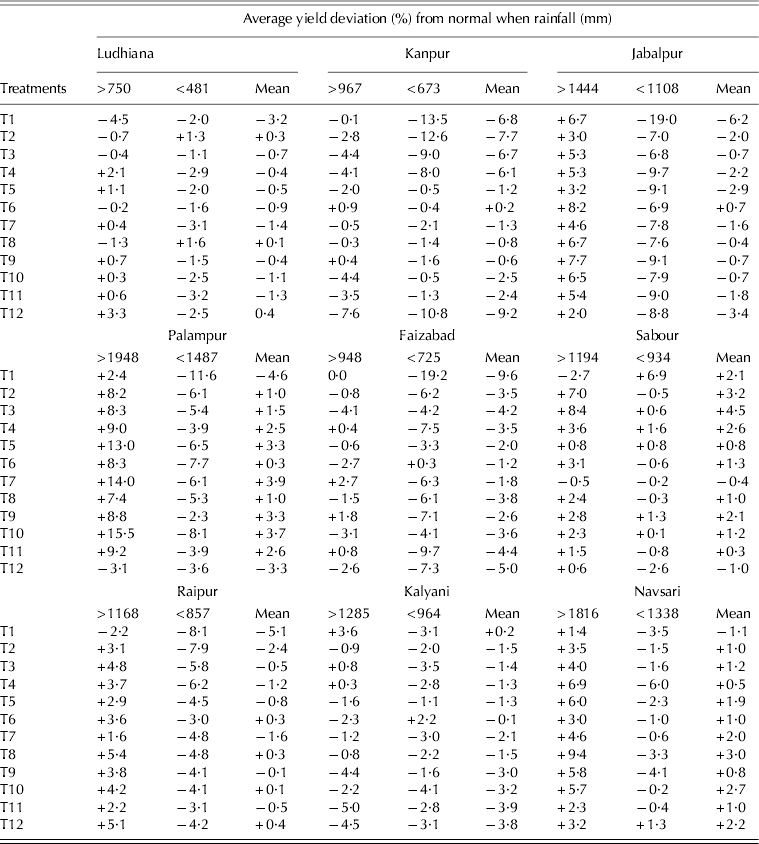
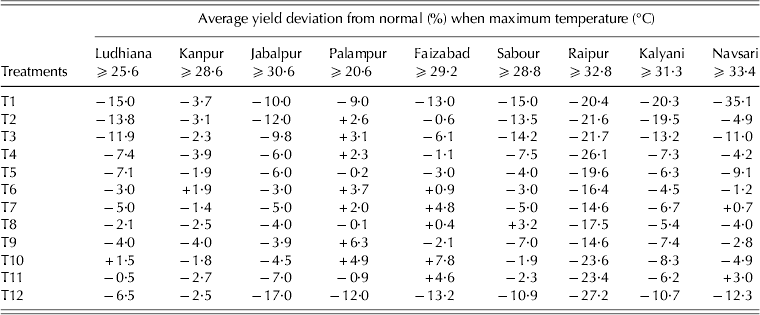
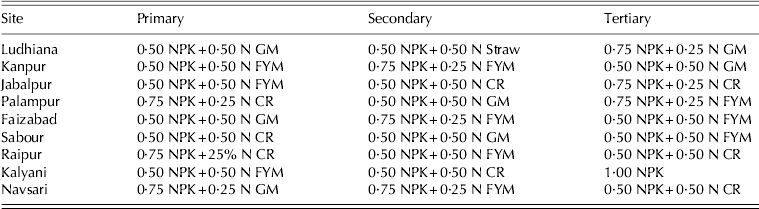
Different integrated nutrient management practices responded differently to the excess/deficit quantity of monsoon rainfall at the different study sites (Table 14). The threshold rainfall value also varied from site to site because of differences in mean seasonal rainfall, varying from 615·2 mm at Ludhiana to 1717·7 mm at Palampur with different sd, varying from 222·8 mm at Faizabad to 478 mm at Navsari. At Kanpur and Jabalpur, application of 0·5 of total N through FYM produced positive system yield anomalies of 0·2 and 0·7%, respectively. Application of 0·5 of total N through CR along with inorganic fertilizers produced a positive and higher yield anomaly at Raipur and Navsari during excess rainfall years. In Faizabad, a lower average yield anomaly of 1·2% was seen under both excess and deficit rainfall years with the application of 0·5 of total N through FYM. The threshold maximum temperature varied with the study site, from 20·6 °C at Palampur to 33·4 °C at Navsari, indicatative of the broad thermal wheat growing environmental situation that exists throughout the country (Table 15). The system yield deviation revealed that there is no uniform integrated nutrient management practice to withstand the extreme climatic situations across the study locations (Fig. 5). For the rice–wheat system, the simple average of rice yield anomaly and wheat yield anomaly indices (the RW anomaly index) was calculated for each treatment at all of the nine sites. The highest value of the RW anomaly index indicated the highest adaptive capacity of the treatment for sustainability under extreme climatic situations. Based on this index, three climate-smart nutrient management practices for rice–wheat systems were identified for each study site (Table 16).
Average percent deviation of rice-wheat system yield during failure/excess of monsoon years during rice and higher maximum temperature during wheat season over normal years at selected study locations.
The average rice yield anomaly (%) pertaining to the years with extreme rainfall (mean ±0·5 sd) from estimated trends under different nutrient management treatments
The average wheat yield anomaly (%) pertaining to the years when the maximum temperature during the wheat season ⩾mean+1 °C under different nutrient management treatments over different study sites
Site-specific primary, secondary and tertiary climate-smart integrated nutrient management practices
NPK, inorganic fertilizers; FYM, farmyard manure; GM, green manure; CR, crop residue of wheat.
DISCUSSION
Quantification of rainfall variability on rice yield under different nutrient management practices
Rice yields are influenced strongly by monsoon rainfall, which accounts for 0·67 of the variation in productivity over India (Subash & Ram Mohan Reference Subash and Ram Mohan2010). When seasonal rainfall >750 mm at Ludhiana, the farmers’ practice treatment produced the highest yield anomaly of 3·3% and the control treatment produced an anomaly of −4·5%, while during drought years (rainfall <481 mm), all treatments except the application of 0·5 recommended dose of inorganic fertilizer during both the rice and wheat growing seasons recorded negative yield anomalies. This shows that there is no uniform nutrient management practice that will provide sustainable yields during both rainfall deficit or excess years. However, it can be said that on average, the farmers’ practice produced a slightly higher yield anomaly compared with all the other treatments investigated. This could be due to the addition of 0·5 of total N through FYM (with the remaining N being supplied through inorganic fertilizers), which increased the moisture retention capacity of the soil (Srinivasarao et al. Reference Srinivasarao, Venkateswarlu, Lal, Singh, Vittal, Kundu, Singh and Singh2012a) and therefore the amount of water available to the crop during the sensitive phases of crop growth and development. In plots treated with FYM there may have been an overall improvement in nutrient supply via timed realase and more availability for crop uptake (Srinivasarao et al. Reference Srinivasarao, Venkateswarlu, Lal, Singh, Kundu, Vittal, Balaguravaiah, Vijaya Shankar Babu, Chary, Prasadbabu and Reddy2012b).
Quantification of temperature variability on wheat yield under different nutrient management practices
Possible losses of 4–5 million tonnes of wheat could be seen with every 1 °C rise in temperature throughout the growing period in India, even after considering enhanced carbon accumulation but no other adaptation benefits (Aggarwal et al. Reference Aggarwal, Kumar and Pathak2010). In the present study, when the average maximum temperature during the wheat season in a particular year increased to 1 °C or higher from the mean, the nutrient management treatments responded differently. In Ludhiana, all the treatments except application of 0·5 of total N through GM recorded negative yield anomalies, with declines ranging from −15% under the control treatment to −0·5% with the application of 0·25 N through GM. It was also noted that there was a yield anomaly of −7·1% with the recommended full dose of inorganic fertilizer. Gupta et al. (Reference Gupta, Gopal, Jat, Jat, Sidhu, Minhas and Malik2010) also reported that an abrupt rise in temperature during the year 2010 produced an average yield penalty of −3·6% in Ludhiana. This reduction may be due to earlier grain filling and forced maturity, leading to a reduction in grain size and consequently yield (Rahman et al. Reference Rahman, Chikushi, Yoshida and Karim2009; Farooq et al. Reference Farooq, Bramley, Palta and Siddique2011; Lobell et al. Reference Lobell, Sibley and Ortiz-Monasterio2012). In Kanpur, application of 0·5 of total N through FYM produced 1·9% higher yield anomaly while all other treatments recorded negative anomalies ranging from −4 to −1·4%. However, all the treatments show different magnitudes of negative yield anomalies at Jabalpur, Raipur and Kalyani. Application of 0·25 of total N through CR produced a 6·3% higher yield at Palampur. However, application of 0·25 N through GM produced a 3% higher yield anomaly in Navsari. This clearly shows that substitution of organic fertilizers such as FYM, CR or GM along with inorganic sources of nutrient supply reduced the negative effects of higher maximum temperature. However, the best type of organic manure depends upon the soil and climatic characteristics of the site.
Detection of site-specific climate-smart nutrient management practice for rice–wheat system
The system yield deviation revealed that there is no uniform integrated nutrient management practice to withstand the extreme climatic situations across the study locations. For example, at Ludhiana, it was found in the present study that the treatment of 0·5 recommended dose of NPK through chemical fertilizers and 0·5 N through GM resulted in an overall average increase of 1·5% in system yield under both excess (>750 mm) and deficit (<481 mm) rainfall conditions and also during the years with seasonal mean maximum temperature ⩾25·6 °C. Thus, this treatment has the adaptive capacity to withstand extreme climates and it can be said that this treatment is the primary climate-smart integrated nutrient management practice for rice–wheat system at Ludhiana. Treatments with application of 0·5 of total N through CR and 0·25 through GM were the second and third best climate-smart integrated nutrient management practices identified at Ludhiana. It was also found that the productivity of all 12 treatment systems was affected negatively by the extreme climatic situations at Jabalpur, Raipur and Kalyani.
CONCLUSIONS
Significant observational changes were noticed in seasonal weather, i.e. monthly rainfall, maximum temperature, minimum temperature and sunshine hours at some of the study sites. Rice yields showed a significant decreasing trend (0·06 t/ha/year) at Ludhiana, which contributed to the significant decreasing trend of system yield (0·055 t/ha/year) even with the slight increasing trend of wheat yield under the recommended dose of inorganic fertilizers. Higher sustainable system yields were attained by the application of different combinations of integrated nutrient management (using a range of organic N sources) at the different study sites. The decreasing yield response to application of either inorganic fertilizer alone or inorganic fertilizer in combination with organic N sources (CR/FYM/GM) over unfertilized plots as well as a proportion of the recommended dose of inorganic fertilizers between the average yield level of the first 3 years of the experiment to the 3 years ending in 2009 at some of the sites accentuate the need for modification of integrated nutrient management treatments with the incorporation of higher organic fertilizers as the nutrient source. This also highlights the need for modifications in the recommended dose of fertilizers at these sites. The quantified system yield deviation under extreme climatic conditions and different nutrient management practices emphasized the importance of site-specific integrated nutrient management practices to overcome the negative effects of extreme climatic situations in the rice–wheat production system. The identification the top three site-specific climate-resilient nutrient management practices at the study sites provides an opportunity for the farming community to choose different organic fertilizers according to availability.
The authors are grateful to Indian Council of Agricultural Research for providing the necessary funds under the National Initiative on Climate Resilient Agriculture (NICRA) project to carry out this study. The authors are also grateful to all present and past Chief Agronomists of all the nine study sites for their efforts to conduct these experiments under the aegis of All India Coordinated Research Project on Farming Systems Research of Indian Council of Agricultural Research. The authors are also grateful to two anonymous reviewers who have provided critical inputs to improve the quality of the manuscript.