Implications
At the onset of lactation, the feed intake does not increase to the same extent as the energy requirements for milk synthesis resulting in a negative energy balance in high-yielding dairy cows. To cover the energy requirements of increasing milk synthesis, the mobilisation of energy from adipose tissue is crucial during the peripartal period. We studied the effects of two different concentrate portions in the feeding ration on the transcriptional regulation of four different nutrient sensing receptors, involved in adipose tissue metabolism. We used adipose tissue from a subcutaneous and a visceral localisation. The findings of our study may help to understand, in parts, how the energy density of the ration may affect the metabolism of adipose tissue due to the expression of the investigated receptors.
Introduction
One of the most challenging times for high-yielding dairy cows is the transition from late pregnancy to early lactation. The energy requirements in early lactation cannot be entirely met by voluntary feed intake and the animals therefore enter a state of negative energy balance (EB) during which lipolysis increases to provide non-esterified fatty acids (NEFA) from adipose tissue (AT) as energy substrates for other organs or precursors for milk fat synthesis (Drackley, Reference Drackley1999). In a previous study we observed differential expression of particular G protein-coupled receptors (GPCR) mRNAs, which are involved in energy and metabolic sensing, due to lactation-induced changes in EB (Friedrichs et al., Reference Friedrichs, Saremi, Winand, Rehage, Dänicke, Sauerwein and Mielenz2014). These GPCRs belong to the family of free fatty acid receptors (FFAR) 1, 2, and 3 (also known as GPCR40, GPCR43 and GPCR41, respectively). They enable free fatty acids (FFA), as their ligands, to act as signaling molecules (Stoddart et al., Reference Stoddart, Smith and Milligan2008). The FFAR1 is a target for saturated and unsaturated medium and long chain fatty acids (LCFA) (Brown et al., Reference Brown, Jupe and Briscoe2005). The FFAR1 is most abundant in insulin-producing pancreatic β-cells, but it is also expressed in other tissues; however, its physiological role in adipose is not clear. In contrast to FFAR1, the physiological functions of FFAR2 and FFAR3 have been identified and comprise an inhibition of lipolysis in adipocytes through activation of FFAR2 (Hong et al., Reference Hong, Nishimura, Hishikawa, Tsuzuki, Miyahara, Gotoh, Choi, Feng, Chen, Lee, Katoh, Roh and Sasaki2005) and increased leptin secretion by activation of FFAR3 (Xiong et al., Reference Xiong, Miyamoto, Shibata, Valasek, Motoike, Kedzierski and Yanagisawa2004). The receptors FFAR2 and FFAR3 are activated by short-chain fatty acids (SCFA). In cattle the affinity of FFAR2 and FFAR3 for FFA is different to human or murine receptors with preference for FFA with a longer carbon backbone: FFAR2 displaying affinity C6>C5>C4=C7>C3=C8>C2=C9 and the bovine FFAR3 displays no affinity for C1 (Hudson et al., Reference Hudson, Christiansen, Tikhonova, Grundmann, Kostenis, Adams, Ulven and Milligan2012). Besides serving as major substrates for energy production in ruminants, SCFA have various other regulatory effects (Bergman, Reference Bergman1990). They may increase blood insulin and glucagon concentrations in ruminants (Harmon, Reference Harmon1992), regulate gene expression in vitro (Li et al., Reference Li, Li, Wang and Elsasser2007) and exert immune-modulatory effects; for example FFAR2 is involved in granule release from bovine neutrophils induced by propionate (Carretta et al., Reference Carretta, Conejeros, Hidalgo and Burgos2013). It is well documented that the energy density of the diet influences the microbial SCFA production in the rumen, for example a high energy content or high concentrate proportion in the diet increases the production of propionate (Rabelo et al., Reference Rabelo, Rezende, Bertics and Grummer2003).
The hydroxycarboxylic acid receptor (HCAR) 2 (previously termed GPCR109A) is mainly expressed in adipocytes and can be activated by niacin and β-hydroxybutyrate (BHBA) as an endogenous ligand. Due to its function as metabolic sensor suppressing lipolysis during starvation, HCAR2 is an important target for a group of antilipolytic drugs (Offermanns et al., Reference Offermanns, Colletti, Lovenberg, Semple, Wise and Ijzerman2011). We recently reported that the HCAR2 ligand niacin stimulates the expression of HCAR2 in differentiated bovine preadipocytes in vitro (Kopp et al., Reference Kopp, Hosseini, Singh, Regenhard, Khalilvandi-Behroozyar, Sauerwein and Mielenz2014). Comparable to other mammalian species, the retroperitoneal AT (RPAT) from dairy cattle seems to have a higher lipolytic activity than subcutaneous AT (SCAT) due to the higher expression of hormone-sensitive lipase and the greater lipolytic response to adrenergic stimulation in RPAT (Locher et al., Reference Locher, Meyer, Weber, Rehage, Meyer, Dänicke and Huber2011; Kenéz et al., Reference Kenéz, Locher, Rizk, Dänicke, Rehage and Huber2013). In dairy cattle two isoforms of the transcription factor peroxisome proliferator-activated receptor γ (PPARG), namely PPARG and its isoform PPARG-2 were described (Sundvold et al., Reference Sundvold, Brzozowska and Lien1997). Both members of the nuclear-receptor family bind various fatty acids and their activation is associated with the improvement of insulin sensitivity by increasing glucose and fatty acid uptake. The isoform PPARG2 is the leading isoform in adipose tissue and is involved in the regulation of adipocyte differentiation (Hammarstedt et al., Reference Hammarstedt, Andersson, Rotter Sopasakis and Smith2005; Tyagi et al., Reference Tyagi, Gupta, Saini, Kaushal and Sharma2011). The mRNA abundance of PPARG in mice and of both receptors in SCAT of dairy cows were shown to be positively linked with HCAR2 (Wanders et al., Reference Wanders, Graff and Judd2012; Friedrichs et al., Reference Friedrichs, Saremi, Winand, Rehage, Dänicke, Sauerwein and Mielenz2014).
Therefore, we hypothesised that differing portions of concentrate in and niacin supplementation to the diet of dairy cattle in the first 3 weeks postpartum (p.p.) will alter the expression of metabolic sensing receptors in two adipose depots. In this study we describe the mRNA expression of genes encoding FFAR1, FFAR2, FFAR3 and HCAR2 in a SCAT and RPAT of cows in the transition period as influenced by time and the diet fed p.p.
Material and methods
Animals, feeding and sample collections
This study was conducted at the experimental station of the Friedrich Loeffler Institute, Federal Research Institute for Animal Health, Braunschweig, Germany. All animal experiments were conducted according to the European Community regulations concerning the protection of experimental animals and were approved by the Lower Saxony state office for consumer protection and food safety (LAVES, Oldenburg, Germany). The experimental design has been described in detail elsewhere (Locher et al., Reference Locher, Meyer, Weber, Rehage, Meyer, Dänicke and Huber2011). Briefly, 20 multiparous pregnant German Holstein cows, dried off 8 weeks before calving, were fed according to the recommendations of the German Society of Nutrition Physiology (GfE, 2001). On day 1 p.p. one half of the cows (n=10) was allocated to either the high-concentrate (HC) group receiving a diet with a 60 : 40 concentrate-to-roughage ratio (on a dry matter (DM) basis) or the low-concentrate (LC) group receiving a diet with a 30 : 70 concentrate-to-roughage ratio. The HC diet comprised 24% and 16% and the LC diet 42% and 28% corn and grass silage, respectively. One half of each dietary group also received as part of the pelletized concentrate 24 g powdered niacin per day which contained at least 99.5% nicotinic acid (Lonza Ltd, Basel, Switzerland). All diets were fed individually as a total mixed ration. The detailed composition of the diet as well as nutrient, fiber, and energy content of the different feed ingredients fed p.p. is provided in Supplementary Table S1 and elsewhere (Locher et al., Reference Locher, Meyer, Weber, Rehage, Meyer, Dänicke and Huber2011). Milk yield was recorded daily by a milk meter (Lemmer-Fullwood GmbH, Lohmar, Germany) and milk composition was analysed twice a week by a milk analyser based on Fourier transform infrared spectroscopy (Milkoscan FT 6000; Foss Electric, Hillerød, Denmark). The individual DM intake was recorded by a computerised feeding system (Insentec BV, Marknesse, the Netherlands). Data for milk yield, milk composition and DM intake were pooled for each week of lactation. Energy balance was calculated as follows: EB=NEL intake – energy in milk – NEM (GfE, 2001). On day −21, 1, and 21 relative to parturition, blood and AT samples were obtained. Blood samples were drawn from the jugular vein in the morning and centrifuged at 2000×g for 10 min to separate serum and plasma. The AT samples were obtained by biopsy as described previously (Locher et al., Reference Locher, Meyer, Weber, Rehage, Meyer, Dänicke and Huber2011), whereby the SCAT samples were taken from the tail head region and the RPAT samples were taken directly above the peritoneum each time alternating from the left and right flank. The AT samples were snap-frozen in liquid nitrogen. The serum, plasma and AT samples were stored at −80°C until further processed.
Measurement of SCFA in serum
The concentrations of serum SCFA were determined according to the method described by Kristensen (Reference Kristensen2000). Briefly, 450 µl plasma was treated an internal standard solution (50 µl 2-ethyl butyrate, 75.45 µmol/10 ml), 700 µl 2-chloroethanol and 700 µl acetonitrile. Samples were centrifuged (15 min, 4°C, 3000×g) and 1600 µl of the supernatant was combined with 20 µl 0.5 N NaOH and 1600 µl heptane. After mixing for 30 s, the aqueous phase (1300 µl) was removed and treated with 10 µl 37% HCl, 100 µl pyridine and 50 µl 2-chloroethyl chloroformate. After 5 min at RT, the reaction mixture was extracted with 2500 µl H2O and 100 µl chloroform and the organic phase was separated after centrifugation (3 min, RT, 3000×g). The organic phase was dried with Na2SO4 (15 mg) for 30 min and 1 µl injected into a gas chromatograph equipped with a flame ionisation detector (Series 17A; Shimadzu Corp., Kyoto, Japan). Separation was achieved on a free fatty acid phase column (length 25 m, internal diameter 0.25 mm, particle diameter 0.25 μm) (Kristensen, Reference Kristensen2000).
Relative quantification of mRNA
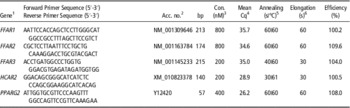
After homogenisation of the AT samples with the Precellys®24 system (peQLab Biotechnology, Erlangen, Germany), total RNA was extracted from each sample using Trizol (Invitrogen, Karlsruhe, Germany) with a subsequent DNase (Qiagen, Hilden, Germany) treatment in solution and purified using spin columns (RNeasy® Mini Kit, Qiagen, Hilden, Germany). From 1 µg total RNA a reverse transcription with RevertAidTM (Fermentas, St. Leon-Rot, Germany) in a Multicycler PTC 200 (MJ Research, Watertown, MA) was performed resulting in an 80 µl cDNA reaction volume. The real-time PCR mixes, with a total volume of 10 µl consisting of 2 µl cDNA (diluted 1 : 4) as template, 1 µl primer mix, 2 µl water and 5 µl SYBR Green JumpStart Taq Readymix (Sigma-Aldrich, Nümbrecht, Germany), were performed in an Mx3000P (Agilent, Santa Clara, CA, USA) in three replicates. The sequences of the primers used and the conditions used in qPCR are provided in Table 1. All PCR products were confirmed by sequencing. Relative quantification of the target genes using efficiency corrected data was performed with standard curves diluted from cDNA except in case of FFAR3, for which a dilution series based on the purified amplicon was used. The qPCR efficiency of the target genes are also provided separately in Table 1 and those of the reference genes were in the range from 98.3% to 103.1%.
Sequences of the primer and real-time PCR conditions used for the quantification of the target genes in the adipose tissue of dairy cows

bp=base pairs.
1 FFAR1=free fatty acid receptor 1 (Friedrichs et al., Reference Friedrichs, Saremi, Winand, Rehage, Dänicke, Sauerwein and Mielenz2014); FFAR2=free fatty acid receptor 2 (Hosseini et al., Reference Hosseini, Behrendt, Regenhard, Sauerwein and Mielenz2012); FFAR3=free fatty acid receptor 3 (Friedrichs et al., Reference Friedrichs, Saremi, Winand, Rehage, Dänicke, Sauerwein and Mielenz2014); HCAR2=hydroxycarboxylic acid receptor 2 (Lemor et al., Reference Lemor, Hosseini, Sauerwein and Mielenz2009); PPARG2=peroxisome proliferator-activated receptor gamma 2 (Saremi et al., Reference Saremi, Winand, Friedrichs, Kinoshita, Rehage, Dänicke, Häussler, Breves, Mielenz and Sauerwein2014).
2 Acc. No.=NCBI Accession Number.
3 Concentrations for each primer.
4 Mean quantification cycle from SCAT and RPAT.
5 Initial denaturation for 10 min at 90°C; denaturation for 30 s at 95°C.
6 Extension at 72°C.
Reference gene stability and data analysis
To determine the most stably expressed genes for subsequent data normalisation, a set of seven genes was tested with qBASEplus 2.0 (Biogazelle, Ghent, Belgium) separately for each tissue and for both tissues combined. Based on the stability of their expression as final reference genes, low density lipoprotein receptor-related protein 10, RNA Polymerase II and emerin were used for RPAT and comparison of both tissues; for SCAT, marvel domain containing 1 was additionally used for normalisation. Data are presented as ratio of the mRNA abundance of the gene of interest and the geometric mean of the corresponding reference genes. The characteristics of the primers and their real-time PCR conditions used for the reference genes are described elsewhere (Saremi et al., Reference Saremi, Sauerwein, Dänicke and Mielenz2012).
Statistical analyses
The statistical analyses were performed with the software package SPSS (version 21.0, SPSS Inc., Chicago, IL, USA). All data are presented as arithmetic means±SEM, significance was set at P<0.05 and a trend was noted when 0.05<P<0.10. Data were tested for normal distribution using the Kolmogorov–Smirnov test and homogeneity of variances was tested using the Levene’s test. Accordingly, the general linear model or Mann–Whitney U test was used for comparing the HC v. the LC group or the groups with and without niacin supplementation. To test for differences between the sampling dates, the ANOVA or the Wilcoxon signed-rank test followed by Bonferroni correction was used. Parametric testing was performed for FFAR1 mRNA abundance in RPAT and HCAR2 mRNA abundance in both tissues. For correlation analyses, the Spearman’s rank correlation coefficient (two-tailed) was calculated.
Results
Temporal effects
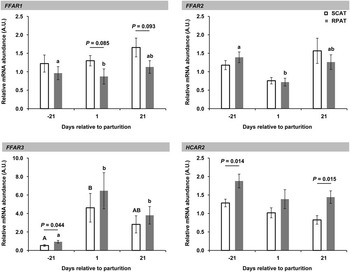
As shown in Figure 1, the mRNA abundance of FFAR1 and FFAR2 in SCAT remained unchanged during the transition period. In contrast, an effect of time with greater abundance of FFAR1 and FFAR2 mRNA on day −21 in comparison to day 1 relative to calving (P<0.01) was observed in RPAT. The mRNA abundance of FFAR3 was lower at day −21 compared to day 1 relative to calving in both tissues (SCAT: P<0.05; RPAT: P<0.05); in RPAT day −21 was also lower compared to day 21 p.p. (P<0.05). The HCAR2 mRNA was neither affected by time nor by treatment.
Relative mRNA abundance of the free fatty acid receptor 1, 2, and 3 and hydroxycarboxylic acid receptor 2 at day −21, 1 and 21 relative to parturition in subcutaneous (SCAT, white bars) and retroperitoneal adipose tissue (RPAT, grey bars) of dairy cows. Pooled data from the cows fed either low or high portions of concentrate low are shown (means±SEM) to compare the mRNA abundances between both AT. A line indicates a difference between the tissues with the corresponding P-value written above. Different small letters and different capital letters indicate significant differences in between the sampling dates in SCAT and in RPAT (P<0.05), respectively. For normalisation enabling a comparison of both tissues, the ratio of the mRNA abundance of the gene of interest and the geometric mean of the mRNA abundance of low density lipoprotein receptor-related protein 10, RNA Polymerase II and emerin was used.

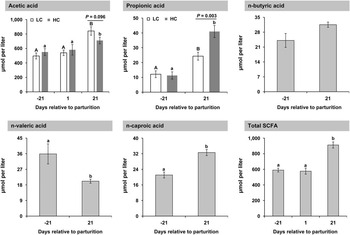
At day 1 after parturition propionic acid, n-butyric acid, n-valeric acid, and n-caproic acid were detectable albeit at low levels in <50% of the samples. For these SCFA we compared only day −21 with day 21 relative to calving (Figure 2). Except for n-butyric acid and n-valeric acid, all SCFA and total SCFA concentrations were lower on day −21 than on day 21; acetic acid (P<0.01) and total SCFA (P<0.01) in serum were also higher at day 21 compared with day 1 after parturition. The concentrations of n-butyric acid did not change with time and n-valeric acid was higher at the beginning compared to the end of the transition period (P<0.05). Acetic acid formed the highest portion of total SCFA.
Specific short-chain fatty acids (SCFA) and total SCFA in serum of dairy cows on day −21 and 21 relative to calving, for acetic acid and total SCFA additionally at day 1 relative to calving. Except for acetic and propionic acid, pooled data from cows fed either low (LC; fed a diet with 30 : 70 concentrate-to-roughage ratio; white bars) or high portions of concentrate (HC; fed a diet with 60 : 40 concentrate-to-roughage ratio; dark grey bars) are shown (means±SEM; light grey bars), because no effect of different portions of concentrate in the diet were observed. Different letters indicate significant differences between the sampling dates (P<0.05), whereas in the first two graphs capital letters indicate differences in the LC group and small letter indicate differences in the HC group. The effects of different portions of concentrate in the diet are defined using a line with the corresponding P-value written above.

Dietary effects
In this study we found no effect of supplementing niacin on any of the variables investigated. For this reason, data of the subgroups (with or without niacin) were each pooled within the HC and the LC group for all further analyses.
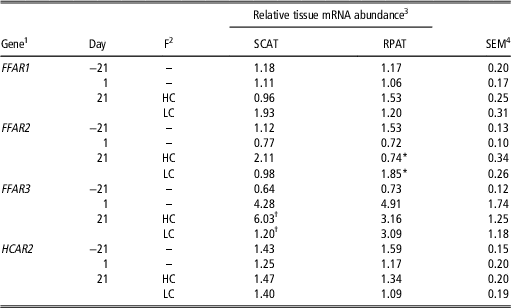
With the exception of FFAR2 in RPAT, we detected no differences between the HC and the LC group (Table 2); in RPAT the mRNA abundance of FFAR2 was greater in the LC animals than in the HC cows at day 21 relative to calving (P<0.01). The abundance of FFAR3 mRNA tended to lower values in SCAT of LC v. HC animals (P<0.1).
Relative tissue mRNA abundance of free fatty acid receptor 1, 2, and 3 and hydroxycarboxylic acid receptor 2 in subcutaneous and retroperitoneal adipose tissue of dairy cows fed either high or low portions of concentrate

*Values within a column marked with a star differ significantly at P<0.05 between the HC and LC group at day 21 after parturition.
†Values within a column marked with a cross differ at P<0.10 (trend) between the HC and LC group at day 21 after parturition.
1 FFAR1=free fatty acid receptor 1; FFAR2=free fatty acid receptor 2; FFAR3=free fatty acid receptor 3; HCAR2=hydroxycarboxylic acid receptor 2.
2 F=feeding; HC=high concentrate group fed a diet with 60 : 40 concentrate-to-roughage ratio; LC=low concentrate group fed a diet with 30 : 70 concentrate-to-roughage ratio. Both diets were fed from day 1 to 21 relative to calving.
3 SCAT=s.c. adipose tissue; RPAT=retroperitoneal adipose tissue. Given are means presented as ratios of the mRNA abundance of the gene of interest and the geometric mean of the corresponding reference genes. For SCAT, lipoprotein receptor-related protein 10, RNA Polymerase II, emerin and marvel domain containing 1 were used for normalisation. For RPAT, lipoprotein receptor-related protein 10, RNA Polymerase II and emerin were used for normalisation. The values for day 21 are shown separately concerning to feeding on a high concentrate v. on a low concentrate diet.
4 SEM=standard error of the mean. The pooled standard error of the mean relative mRNA abundance in SCAT and RPAT is given.
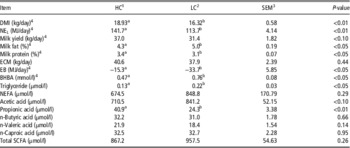
On day 21 after calving the LC group, compared to the HC group, had 1.7-fold lower serum concentrations of propionic acid (P<0.01) and 1.2-fold higher concentrations of acetic acid serum as a trend (P<0.01; Figure 2). In Table 3 the performance data and the concentrations of particular and total SCFA in serum from day 21 p.p. are listed separately for the LC and the HC group.
Performance data and serum concentrations of metabolites and short chain fatty acids of dairy cows fed either high or low portions of concentrate

a,bValues within a row with different superscript letters differ significantly at P<0.05 between the HC and LC group at day 21 after parturition or in the third week of lactation.
1 HC=high concentrate group fed a diet with 60 : 40 concentrate-to-roughage ratio.
2 LC=low concentrate group fed a diet with 30 : 70 concentrate-to-roughage ratio. Both diets were fed from day 1 to 21 relative to calving. Given are means. Performance data are given as means for the third week of lactation; all variables assessed in serum were obtained on day 21 postpartum.
3 SEM=standard error of the mean. The pooled standard error of the mean values from the HC group and LC group is given.
4 Data has been published previously by Locher et al. (Reference Locher, Meyer, Weber, Rehage, Meyer, Dänicke and Huber2011).
Location effects
When comparing both tissues, we observed a trend for a lower FFAR1 mRNA abundance in RPAT compared to SCAT at day 1 (P<0.1) and 21 (P<0.1) after parturition. The expression of FFAR2 was not different between SCAT and RPAT at the different sampling dates. In RPAT, FFAR3 mRNA abundance was greater compared to FFAR3 mRNA abundance in SCAT at day −21 relative to calving (P<0.05). Also HCAR2 mRNA abundance was higher in RPAT compared to SCAT at day −21 (P<0.05) and also at day 21 (P<0.05) relative to calving.
Results of the correlation studies
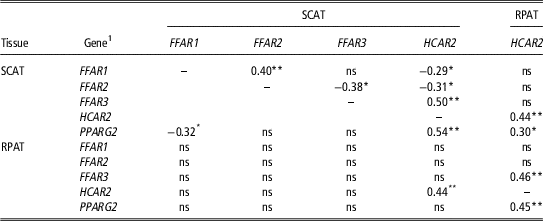
As summarised in Table 4 (r values reported in the table), in SCAT the mRNA abundance of FFAR1 and FFAR2 was positively correlated (P<0.01), but not in RPAT. In both AT the mRNA abundance of HCAR2 was positively correlated with FFAR3 (SCAT: P<0.01; RPAT: P<0.01) and peroxisome proliferator-activated receptor γ-2 (PPARG2; SCAT: P<0.01; RPAT: P<0.01). The HCAR2 mRNA abundance in SCAT was related to the one in RPAT (P<0.01); HCAR2 and PPARG2 were interrelated among RPAT and SCAT (P<0.05). The independent analysis of both feeding groups revealed partly higher correlation coefficients which was associated at least partly with the observation that the correlation between the receptor mRNAs exist only within the LC group. This was relevant for FFAR3 compared to FFAR1 (r=−0.516; P<0.05) as well as compared to FFAR2 (r=−0.598; P<0.01), HCAR1 and FFAR1 (r=−0.654; P<0.01) within SCAT. In RPAT HCAR2 correlated with FFAR2 only within the LC group (r=0.494; P<0.01) but with FFAR3 only within the HC group (r=0.606; P<0.01).
Coefficients of correlation (Spearman) between relative mRNA abundance of receptors involved in nutrient sensing and peroxisome proliferator-activated receptor γ-2 in subcutaneous and retroperitoneal adipose (SCAT and RPAT, respectively) tissue of dairy cows

**P<0.01; *P<0.05.
1 FFAR1=free fatty acid receptor 1; FFAR2=free fatty acid receptor 2; FFAR3=free fatty acid receptor 3; HCAR2=hydroxycarboxylic acid receptor 2, PPARG2=peroxisome proliferator-activated receptor γ-2.
We observed a positive correlation between FFAR1 mRNA abundance in SCAT and n-caproic acid concentration in serum (r=0.322; P<0.05) and a negative correlation between FFAR3 mRNA abundance in SCAT and n-butyric concentration in serum (r=−0.369; P<0.05). The FFAR2 mRNA abundance in SCAT was correlated with the glucose concentrations in serum (r=0.346; P<0.01). The target mRNA measured in RPAT showed no correlation with the measured SCFA at all. The FFAR2 mRNA abundance in RPAT and the BHBA concentration in the circulation were correlated (r=0.307; P<0.05). In RPAT the FFAR3 mRNA abundance was negatively correlated with the triglyceride concentrations in serum (r=−0.406; P<0.01) and positively with the ones of NEFA in serum (r=0.287; P<0.05), respectively. We also observed a negative correlation between FFAR3 mRNA abundance in RPAT and EB (r=−0.585; P<0.05).
Discussion
Changes in FFAR1 expression
Less information is available about the influence of dietary components or metabolites on FFAR1 expression (Kebede et al., Reference Kebede, Ferdaoussi, Mancini, Alquier, Kulkarni, Walker and Poitout2012). In the present study in dairy cows, the concentrate portion in the diet had no effect on the FFAR1 mRNA expression in both AT depots. A recent study in mice showed that the digestibility of fibre affects FFAR1 expression in AT, that is, soluble fibre compared to insoluble fibre intake was accompanied with an increased SCFA production in the colon and was associated with increasing FFAR1 mRNA abundance in the epididymal AT (Isken et al., Reference Isken, Klaus, Osterhoff, Pfeiffer and Weickert2010). However, this link could not be confirmed with our results for dairy cows. The reasons for the downregulation of this receptor from late pregnancy to early lactation observed herein and its physiological consequences in RPAT remain unknown as does the function of this receptor in adipocytes. Generally, the FFAR1 gene expression in AT is very low compared to pancreas and brain in humans (Itoh et al., Reference Itoh, Kawamata, Harada, Kobayashi, Fujii, Fukusumi, Ogi, Hosoya, Tanaka, Uejima, Tanaka, Maruyama, Satoh, Okubo, Kizawa, Komatsu, Matsumura, Noguchi, Shinohara, Hinuma, Fujisawa and Fujino2003), and lower in AT compared to liver in cattle (Friedrichs et al., Reference Friedrichs, Saremi, Winand, Rehage, Dänicke, Sauerwein and Mielenz2014). Therefore, the importance of the regulation of FFAR1 mRNA or the corresponding protein should be verified in future using adequate models.
Changes in FFAR2 and FFAR3 expression related to SCFA content in blood
In differentiated murine adipocytes, acetic and propionic acid were demonstrated to stimulate the gene expression of FFAR2 in vitro and both fatty acids also affected adipogenesis and adipocyte differentiation (Hong et al., Reference Hong, Nishimura, Hishikawa, Tsuzuki, Miyahara, Gotoh, Choi, Feng, Chen, Lee, Katoh, Roh and Sasaki2005). In the current study, the LC diet expectedly resulted in decreased concentrations of propionic acid in serum and in a trend for increased acetic acid concentrations. Concomitantly the mRNA abundance of FFAR2 was increased in RPAT. Even though acetic acid is the most abundant SCFA in the circulation, the pEC50 potency values for the bovine FFAR2 and FFAR3 reported by Hudson et al. (Reference Hudson, Christiansen, Tikhonova, Grundmann, Kostenis, Adams, Ulven and Milligan2012) are in the millimolar range and let us assume that the circulating concentrations of acetic acid recorded in the cows of the present study were not able to activate either receptor. Based on their characterised affinities for SCFA (Hudson et al., Reference Hudson, Christiansen, Tikhonova, Grundmann, Kostenis, Adams, Ulven and Milligan2012) we speculate that the plasma concentration of butyric acid may stimulate both receptors.
It remains open as to whether the observed changes of the abundance of FFAR2 mRNA in RPAT were triggered by the altered circulating SCFA concentrations in the animals or not. An in vitro study on bovine adipose tissue explants showed no effect of propionic acid on FFAR2 and FFAR3 expression (Hosseini et al., Reference Hosseini, Behrendt, Regenhard, Sauerwein and Mielenz2012) and a recent study on human cell culture explants from omental AT showed no effect of neither acetic acid nor propionic acid on FFAR2 expression during differentiation (Dewulf et al., Reference Dewulf, Ge, Bindels, Sohet, Cani, Brichard and Delzenne2013). The previously reported link between peroxisome proliferator-activated receptor γ (PPARG) and FFAR2 in mice (Dewulf et al., Reference Dewulf, Ge, Bindels, Sohet, Cani, Brichard and Delzenne2013) could not be confirmed by our study. Thus, the observed weak correlation between the mRNA abundance of PPARG2, the most prominent PPARG isoform in AT (Tyagi et al., Reference Tyagi, Gupta, Saini, Kaushal and Sharma2011) and FFAR2 in cattle, point to species specificity. As reported previously (Locher et al., Reference Locher, Meyer, Weber, Rehage, Meyer, Dänicke and Huber2011), animals from the LC group underwent a more negative EB in the third week of lactation, showed higher BHBA concentrations and had numerically higher NEFA concentrations (although there was no significant dietary effect), at day 21 after parturition, indicating a more extensive fat mobilisation in LC animals. Expressional up-regulation and activation of FFAR2 in these animals seems to counteract extensive lipolysis in RPAT due to its role in inhibition of lipolysis in adipocytes (Hong et al., Reference Hong, Nishimura, Hishikawa, Tsuzuki, Miyahara, Gotoh, Choi, Feng, Chen, Lee, Katoh, Roh and Sasaki2005) supported by the negative correlation between FFAR2 mRNA abundance and EB. However, the herein observed decline in FFAR2 mRNA abundance in RPAT from late pregnancy to the onset of lactation might be associated with the declining EB during this time period to reduce the inhibitory effects of FFAR2 on lipolysis and thus to enable the necessary p.p. catabolism. In previous works, we also observed no differences of FFAR2 mRNA abundance in SCAT comparing day −21, 1 and 21 relative to calving, but differential expression between the different adipose depots (Friedrichs et al., Reference Friedrichs, Saremi, Winand, Rehage, Dänicke, Sauerwein and Mielenz2014). The expression of FFAR3 mRNA was inversely related to FFAR2 mRNA with higher FFAR3 mRNA abundance in late pregnancy compared to the onset of lactation in RPAT. Another indication for the inverse expressional regulation of both receptors is the detected trend with lower values for FFAR3 mRNA abundance in the SCAT of animals from the LC group and the negative correlation between FFAR2 and FFAR3 mRNA abundance in SCAT. The negative correlation between FFAR2 and FFAR3 mRNA abundance in SCAT occurred solely in the LC group which might indicate a greater importance of these receptors in the animals that underwent a more severe negative EB.
Based on the higher responsiveness of RPAT v. SCAT towards lipolytic stimuli in cattle (Locher et al., Reference Locher, Meyer, Weber, Rehage, Meyer, Dänicke and Huber2011; Kenéz et al., Reference Kenéz, Locher, Rizk, Dänicke, Rehage and Huber2013) and the herein observed changes with time and energy intake, the differential expression of FFAR2 in RPAT suggests that energy sensing might be more important in RPAT than SCAT. In addition, the circulating concentrations of propionic acid achieved by the feeding regime using either high or low portions of concentrate were related to the mRNA abundance of FFAR2 in RPAT, but not in SCAT, also indicating that metabolic sensing through FFAR2 to adapt lipolysis might be more important in RPAT than SCAT. We also provide evidence for an inverse differential expression of both receptors in RPAT of dairy cattle in the periparturient period. With the results for the correlation between FFAR1 and FFAR2 mRNA abundance we can confirm the previously suggested concordant regulation of these receptors expression in SCAT (Friedrichs et al., Reference Friedrichs, Saremi, Winand, Rehage, Dänicke, Sauerwein and Mielenz2014).
Changes in HCAR2 expression
The circulating concentrations of BHBA, the endogenous ligand of HCAR2, were different between HC and LC animals, but the mRNA abundance of HCAR2 in both AT was not affected by the diet. In an in vitro study on bovine SCAT and RPAT explants the lack of BHBA-induced change on HCAR2 expression has already been described, attributed the lack to the short duration of the treatment (Hosseini et al., Reference Hosseini, Behrendt, Regenhard, Sauerwein and Mielenz2012). Based on our previous and present results we speculate that BHBA is not regulating the transcription of HCAR2 in bovine AT. However, in our study the HCAR2 expression did not differ between the animals fed a diet supplemented with niacin compared to the animals fed a diet without niacin. A possible explanation for the missing effect could be the ruminal degradation of the niacin, as the supplement used herein was not rumen-protected.
In another study we found a decrease of the receptor mRNA abundance from late pregnancy (day −21) to mid- (day 105) and late-lactation (day 252 relative to calving), but also not in the time interval considered in the current study (Lemor et al., Reference Lemor, Hosseini, Sauerwein and Mielenz2009; Friedrichs et al., Reference Friedrichs, Saremi, Winand, Rehage, Dänicke, Sauerwein and Mielenz2014). We thus assume that the expressional regulation of HCAR2 and the feedback of BHBA on lipolysis via this receptor are only relevant if BHBA concentrations are in a range observed during ketosis. Effects of high BHBA concentrations on lipolysis were shown by Kenéz et al. (Reference Kenéz, Locher, Rehage, Dänicke and Huber2014) in vitro but not evident in the current study at least at sampling on day 21 p.p. Alternatively or in addition it might be that up-regulation is more relevant in stages of positive EB to limit lipolysis. Irrespective of time, in our study the mRNA abundance of HCAR2 was higher in RPAT than in SCAT, whereas a recent report describes greater HCAR2 protein abundance in SCAT than RPAT (Kenéz et al., Reference Kenéz, Locher, Rehage, Dänicke and Huber2014). However, a study in rumen-fistulated Holstein steers showed no difference in HCAR2 protein as well as mRNA abundance between SCAT and RPAT, respectively (Titgemeyer et al., Reference Titgemeyer, Mamedova, Spivey, Farney and Bradford2011).
A correlation between HCAR2 and PPARG2 in SCAT has been reported for cattle previously (Friedrichs et al., Reference Friedrichs, Saremi, Winand, Rehage, Dänicke, Sauerwein and Mielenz2014) and this association can be extended to bovine RPAT based on our present results. Similarly, HCAR2 was shown to be positively associated with PPARG in mice (Wanders et al., Reference Wanders, Graff and Judd2012). Feeding a high-fat diet reduced HCAR2 expression in murine epididymal adipose tissue and correlated with a decline in PPARG expression (Wanders et al., Reference Wanders, Brouwer, Siebelink and Katan2010). In both AT investigated the mRNA abundance of PPARG2 was not affected by the concentrate portion fed to the animals; considering the potential regulatory impact of PPARG on HCAR2 expression, this might explain the unaltered HCAR2 mRNA abundance. Thus we assume that HCAR2 is regulated through PPARG rather than by its endogenous ligand BHBA. This assumption is in line with the study of Kopp et al. (Reference Kopp, Hosseini, Singh, Regenhard, Khalilvandi-Behroozyar, Sauerwein and Mielenz2014) in which the mRNA abundance of HCAR2 was not downregulated in bovine adipocytes in vitro by uncoupling of G-protein signalling using pertussis toxin.
Conclusions
Energy balance after parturition affects the mRNA abundance of FFAR an HCAR2 in RPAT and SCAT differently. Based on our results divergent nutrient sensing by FFAR2 and FFAR3 in AT of dairy cows is indicated. The adjustment of lipolysis by HCAR2 mRNA abundance may take place only in case of subclinical or clinical BHBA concentrations during the transition period, alternatively in case of positive EB to limit lipolysis.
Acknowledgements
The donation of the scholarship by the H. Wilhelm-Schaumann Foundation, Hamburg, Germany to P. Friedrichs is gratefully acknowledged. Furthermore, special gratitude is dedicated to Inga Hofs, Isabella Israel (Institute of Animal Science, Physiology & Hygiene Unit, University of Bonn) and Marlies Althaus (Institute of Nutritional Physiology ‘Oskar Kellner’, Leibniz Institute for Farm Animal Biology, Germany) for their excellent technical assistance. We would also like to thank Christel Drewke (Institute of Pharmaceutical Biology, University of Bonn, Germany) for the discussions about the ligand affinities of the receptors studied herein.
Supplementary Material
To view supplementary material for this article, please visit http://dx.doi.org/10.1017/S175173111500227X