Implications
Detection of estrus has a major impact on reproductive efficiency in dairy herds. Undetected estrous cycles leads to prolonged intercalving intervals and reduced milk production resulting in economic losses. However, detection rates are decreasing and visual observation of cows has become difficult. Dry matter intake, water intake and BW can be measured automatically and normally are indicators for early detection of cows with metabolic disorders. However, the possibility to use these traits as additional tools for identifying estrous cows – as shown in the current study – may help the herd manager to improve the detection of estrous cows and the profit of the dairy herd.
Introduction
Reproductive performance of dairy cows is largely dependent on accurate detection of estrus, especially on farms where timed artificial insemination is not applied. Because of increased milk production and less pronounced symptoms and duration of estrus, and incidence of reproductive disorders, detection of estrus is a major problem in dairy cattle (Wiltbank et al., Reference Wiltbank, Lopez, Sartori, Sangsritavong and Gümen2006). Lopez et al. (Reference Lopez, Sattler and Wiltbank2004) reported a shorter duration of estrus (6.2±0.5 h) in high-yielding cows than in cows with lower milk production (10.9±0.7 h). In addition, milk yield was associated negatively with cyclicity and health status of the ovaries (López-Gatius, Reference López-Gatius2003). With increasing herd sizes, visual observation of individual cows for signs of estrus becomes impractical. To facilitate estrus detection, numerous estrus-detection aids have been developed in improved efficiency of detecting estrus.
Studies published previously revealed that standing to be mounted was most characteristic for estrus (Hurnik et al., Reference Hurnik, King and Robertson1975; Phillips and Schofield, Reference Phillips and Schofield1990). However, Lyimo et al. (Reference Lyimo, Nielen, Kruip and Van Eerdenburg2000) reported that standing to be mounted by another cow can no more be considered a sure indication of estrus because this behavior is not found in all cows (Diskin and Sreenan, Reference Diskin and Sreenan2000; Roelofs et al., Reference Roelofs, López-Gatius, Hunter, Van Eerdenburg and Hanzen2010). Van Eerdenburg et al. (Reference Van Eerdenburg, Karthaus, Taverne, Merics and Szenci2002) observed standing estrus in only 50% of the cows. Hereof, Kerbrat and Disenhaus (Reference Kerbrat and Disenhaus2004) updated knowledge about behaviors observed during estrus. Automatic observation of secondary signs becomes increasingly important to identify estrous cows. Data can be measured automatically on a daily basis for individual cows.
It is well known that restlessness was detected to be one of the most characteristic indicators of estrus. During estrus, behavior of cows is significantly more pronounced than in diestrus (Berka et al., Reference Berka, Stípkova, Volek, Rehák, Mateju and Jílek2004; López-Gatius et al., Reference López-Gatius, Santolaria, Mundet and Yániz2005; Yániz et al., Reference Yániz, Santolaria, Giribet and López-Gatius2006). Arney et al. (Reference Arney, Kitwood and Phillips1994) observed a 300% increase in the number of steps measured by pedometers during estrus. Activity – locomotion and mounting activity – was influenced by a multitude of different factors (Orihuela, Reference Orihuela2000; Yániz et al., Reference Yániz, Santolaria, Giribet and López-Gatius2006), and seemed to have a major impact on other traits (lying time, rumination duration) during estrus (Brehme et al., Reference Brehme, Stollberg, Holz and Schleusener2006; Reith and Hoy, Reference Reith and Hoy2011 and Reference Reith and Hoy2012).
Besides these traits, dry matter intake (DMI), water intake (WI) and BW of cows can easily be recorded – daily and on an individual basis – by sensor-based technology. Actually, feed consumption and BW are used in some dairy farms to detect cows with metabolic disorders. Owing to a positive correlation, lower feed intake is mostly followed by a decrease in BW (Maltz et al., Reference Maltz, Devir, Metz and Hogeveen1997). This is particularly often the case in early lactation when cows with insufficient feed intake enter a period of negative energy balance, resulting in body tissue mobilization and BW loss, respectively (Tamminga et al., Reference Tamminga, Luteijn and Meijer1997). In an investigation conducted by Van Straten et al. (Reference Van Straten, Shpigel and Friger2008), BW decline was up to 8.5% during the first 5 weeks after calving. Apart from roughage intake, Mol et al. (Reference Mol, Ouweltjes, Kroeze and Hendriks2001) confirmed that there is also a negative association between the voluntary intake of concentrates and cow diseases.
We previously reported that rumination time is reduced during estrus (Reith and Hoy, Reference Reith and Hoy2012). Our objectives of this study were to determine whether DMI, WI or BW decrease in estrous cows. A second objective was to determine whether correlations existed among those measures and estrous behavior, as well as between DMI, WI and BW in non-estrous days.
Material and methods
Cows and study design
A total of 34 Holstein-Friesian dairy cows were included in the study. Data were recorded on the research farm ‘Haus Riswick’ of the Agricultural Chamber North Rhine-Westphalia, Germany. The animals were housed year-round in a free stall barn with cubicles equipped with rubber mats and a slatted floor with free access to the feeding area. The floor of the holding pen was covered with rubber flooring. An ad libitum partial total mixed ration (pTMR) was fed. The ration consisted of grass silage, maize silage, chopped straw and concentrated feed (rapeseed meal, maize, wheat, sugar beet molasses and urea) to fulfill the requirements for energy, protein and minerals, and was calculated to achieve daily milk yield of 25 kg (energy corrected milk) per cow. Depending on the production level, concentrates were additionally offered in a feeding station. Water was available continuously and ad libitum via a trough placed in the feeding area. The cows were milked twice daily at 0530 and 1630 h in a milking carousel with 32 milking stalls. Average daily milk yield of the analyzed cows was 30 kg/day. The cows were housed in different groups with a group size of 24 animals. Per group, 12 feeding and 2 water troughs were available. The cows were at various stages of lactation, ranging from 59 to 213 days in milk. Mean lactation number of cows was 2.5.
Activity measurement via pedometers (GEA Farm Technologies, Düsseldorf, Germany) was used for identifying cows in estrus. In the present study, the cow was considered to be in estrus (day 0) when detected by activity measurement or/and visual observation. In response to estrus, cows were inseminated artificially by an experienced insemination technician between 0900 and 1100 h. To ensure that cows showed true estrus, only cycles of cows with insemination leading to conception were included. Means of DMI, WI and BW of 3 days before and 3 days after day 0 were defined as reference period. Deviations in DMI, WI and BW during estrus were calculated by comparing the value on the day of estrus with values of the reference period (days −3, −2, −1, 1, 2, 3). The following data were recorded for each cow: date of estrus, daily DMI, daily WI and daily BW at the day of estrus, and at the days −3 to −1 and 1 to 3.
Measurements of individual DMI, WI and BW
Each cow was equipped with a tag fitted on the neck collar for identification and to save its individual data. Daily DMI of the cows was measured by a feeding trough placed on an electronic floor scale (Waagen Döhrn, Wesel, Germany). Total DMI was separated into DMI of the pTMR and DMI of concentrated feed. For analysis, DMI was defined as DMI of the pTMR in the feeding trough (excluding intake of concentrated feed from the separate feeding station). Concentrate intake (CI) was separately analyzed. Each cow had access to one feeding trough when the identification tag passed the antenna of the DMI monitoring system. The difference between the weight of the feed before entering and after leaving the trough was recorded at each individual feeding event. A grid around the feeding trough mostly prevented feed losses by throwing feed out. Via data line, data arrived at the farm computer and were retrievable from the management software.
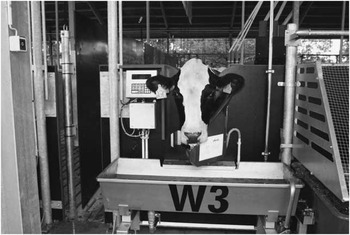
On the same technical basis, cow’s individual WI was daily registered by a scale (Waagen Döhrn) on which a trough was installed (Figure 1). Thus, the difference between the weight of water before and after WI was individually determined. On the basis of validations, WI accessed at the trough had a deviation of 0.05 kg.
Water trough for the automatic measurement of cow’s daily water intake (Source: C. Verhülsdonk).

Measurement of BW was accessed by a walk-through scale (GEA Farm Technologies). Weights were measured twice daily after milking.
The single measurements of DMI, WI and BW were summarized to one value per day by the management software. In terms of data retrieved from the computerized data storage system, a ‘day’ was defined as the calendar day (from midnight to midnight). Values for DMI and CI were indicated in kilograms of fresh matter and dry matter (DM). During the data collection, the average DM content of the ration was about 46%. Because of missing data of WI, CI and BW in the periestrous period, the sample size was different for each trait.
Statistical analysis
Data of DMI, CI, WI and BW during estrus of cows were analyzed using the program package SPSS 20.0. For all traits, descriptive statistics and correlations between traits were calculated. For the analysis of the daily measurements, the following factors were included in the model of generalized linear mixed model:
 $$Y_{{ijklm}} =\mu {\plus}{\rm day}_{i} {\plus}p_{j} {\plus}{\rm BW}_{k} {\plus}{\rm cow}_{l} \left( {p_{j} } \right){\plus}e_{{ijklm}} $$
where Y ijklm is the variable ‘DMI’, μ the overall mean, day i the fixed effect of day (i=−3 to 3), p j the fixed effect of parity group (j=1=first parity and >1=cows with greater parity), BW k the fixed effect of BW (k⩽645 and >645 kg), cow l (p j ) the random effect of cow-within parity group and e ijklm the random residual error. Similarly, the variables CI, WI and BW were analyzed with the effects explained as above. For calculation of ‘BW,’ class of BW was excluded. Correlations were calculated between the average DMI, CI, WI and BW during the reference period (days −3, −2, −1, 1, 2, 3), and the change of all traits from the reference period to day of estrus calculated as percentage from the average value in the reference period.
Results
Changes in DMI, WI and BW during estrus
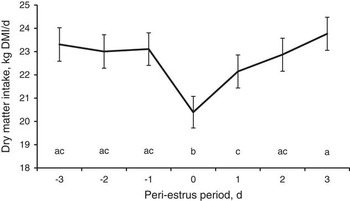
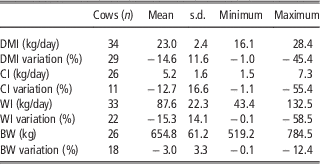
DMI, WI and BW of dairy cows were significantly influenced by the occurrence of estrus with a great variability among cows. Means, standard deviations and ranges of the traits are in Table 1. On average, cows consumed 23 kg of DM in the pTMR per day during the reference period with a maximum DMI of 28.4 kg/day. During the reference period, the amount of DMI was constant. Individual feeding behavior was altered during estrus relative to the reference period. On the day of estrus, mean DMI was 20.4 kg. The day of estrus was different (P<0.001) from all other days. From day −1 to the day of estrus, DMI was decreased about 2.9 kg. Of all 34 animals, 29 cows (85.3%) had reduced DMI by 14.6% on average. In 15 of these 29 cows, decrease in DMI was >10% (ranging from 12.8% to 45.4%). In five cases in which DMI increased during estrus, DMI ranged from 2.9% to 18.7% relative to reference values. After estrus, DMI increased from 22.2 (day 1) to 22.8 (day 2) and 23.8 kg (day 3) (Figure 2).
Changes in dry matter intake (DMI) before and after estrus (n=34). Results are given as LSQ means±s.e. a,b,cMeans with different superscripts differ significantly at P<0.01.

Number of cowsFootnote 1 , means, standard deviations, minimums and maximums of dry matter intake (DMI), concentrate intake (CI), water intake (WI) and BW during the reference period, and variations on the day of estrus compared with the reference periodFootnote 2

1 Number of cows (n) was different for the different traits because of missing values (in full or in part) resulting in a reduced data set for CI, WI and BW.
2 Reference period: means of days −3, −2, −1, 1, 2 and 3.
CI was not affected by the occurence of estrus. No clear tendency could be found around estrus. Of 26 cows, CI was reduced in 11 cows and increased in 15 cows, respectively. During the reference period, the consumption of concentrates averaged 5.2 kg/day and differed between 1.5 and 7.3 kg/day depending on the stage of lactation of the analyzed cows.
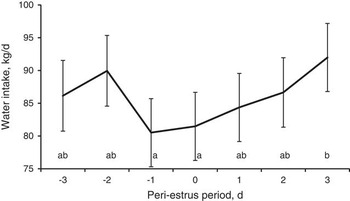
Dynamics of daily WI followed the same pattern during estrus compared with DMI. Mean daily WI during the reference period was 87.6 kg and ranged from 43.4 to 132.5 kg/day. On the day of estrus, cows drank 81.5 kg water. With 80.5 kg, the minimum level was detected on the day before estrus, yet. The decrease from day −2 to day −1 was nearly significant (P=0.07). After estrus, WI increased from 84.4 (day 1) to 86.7 (day 2) and 92 kg (day 3) (Figure 3). Of the total 33 cows, 22 (66.7%) consumed less water during estrus with a mean decrease of 15.3%.
Changes in water intake (WI) before and after estrus (n=33). Results are given as LSQ means±s.e. a,bMeans with different superscripts differ significantly at P<0.05.

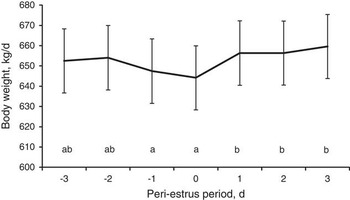
Cow’s daily BW was markedly influenced by estrus. The day of estrus was significantly (P<0.05) different from the days after estrus. Before estrus, the decrease from day −2 to the day of estrus was nearly significant (P=0.07), whereas the decrease from day −1 to the day of estrus was not found to be significant. During the reference period, BW averaged 654.8 kg and varied between 519.2 and 784.5 kg among cows. The minimum value was measured on the day of estrus with a mean BW of 644.2 kg (Figure 4). Of the total of 26 analyzed cows, BW was reduced in 18 cows (69.2%), with an average decline of 3% and a range from 0.1% to 12.4%.
Changes in BW before and after estrus (n=26). Results are given as LSQ means±s.e. a,bMeans with different superscripts differ significantly at P<0.05.

Correlations between DMI, WI, and BW and estrus
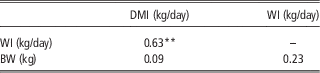
Correlations among traits are presented in Table 2. During the reference period, daily DMI and daily WI were closely related. In addition, a positive correlation existed between daily BW and daily WI. No clear relationship was found between daily BW and cow’s DMI.
Coefficients of correlation (r) between dry matter intake (DMI), water intake (WI) and BW during the reference periodFootnote 1

A significant (**P<0.01) positive relationship was found between WI and DMI of dairy cows.
1 Reference period: means of days −3, −2, −1, 1, 2 and 3.
Discussion
Changes in DMI, WI and BW during estrus
It is undisputed that accurate detection of estrus is essential for reproductive performance of dairy cows. An analysis performed by Plaizier et al. (Reference Plaizier, King, Dekkers and Lissemore1998) verified considerable economic benefits associated with improved detection rates. With the help of sensor-based monitoring systems, traits can be measured daily and on an individual basis. In the present study, DMI, WI and BW had been identified as three traits that were influenced by estrus – defined as the day of artificial insemination leading to conception – of Holstein cows.
Physiologically, estrus of cows is divided into four different stages accompanied by the display of specific behaviors. In proestrus – in the present study most probably consistent with day −1 – onset of estrous behavior is induced by the release of steroid hormones, primarily estrogens (Allrich, Reference Allrich1994). Lyimo et al. (Reference Lyimo, Nielen, Kruip and Van Eerdenburg2000) found estrus being strongly correlated with estradiol concentration reaching peak level on the day before estrus (Lopez et al., Reference Lopez, Sattler and Wiltbank2004). A reduction in feed intake could mostly be caused by estrogens (Uphouse and Maswood, Reference Uphouse and Maswood1998). Mondal et al. (Reference Mondal, Rajkhowa and Prakash2006) reported increasing quantities of estradiol-17β 6 days before estrus that reached peak level on the day of estrus and declined to basal level on day 3 of the estrous cycle. In the current study, day 1 may be characterized by the time of ovulation. Roelofs et al. (Reference Roelofs, Van Eerdenburg, Soede and Kemp2005) detected an average interval between increased activity behavior measured by pedometers and ovulation of 29.3 h. As a result, they defined optimal time for artificial insemination to be between 11 and 16 h after onset of pedometer estrus. In postestrus, activity of progesterone resulted in inhibition of estrous behavior (Allrich, Reference Allrich1994). In most cases, the day of estrus was identical with the day of artificial insemination. Our definition of ‘estrus’ referred to the calendar day when estrus was detected primary by activity measurement. However, onset of cows’ estrus occurs round the clock. Therefore, more exact classification was not possible. This fact may be one of the reasons why day −1 and day 1 also showed decreases in the analyzed traits.
During estrus, 85% of cows had less DMI with the minimum level recognized on the day of estrus (day 0) compared with the reference period. A decline in feed intake during estrus is also described by Diskin and Sreenan (Reference Diskin and Sreenan2000). In addition, estrous cows spent less time at the feeder (Hurnik et al., Reference Hurnik, King and Robertson1975). Although seemingly obvious, this was not found to be the case in other studies. On the contrary, De Silva et al. (Reference De Silva, Anderson, Gwazdauskas, McGilliard and Lineweaver1981) found no change in feed consumption during estrus, and Lukas et al. (Reference Lukas, Reneau and Linn2008), however, observed an increase in feed intake by 0.61 kg in estrous cows. Mean daily DMI obtained for the reference period in this study was similar to the result found in the studies by Dado and Allen (Reference Dado and Allen1994) and Yang and Beauchemin (Reference Yang and Beauchemin2006), in which cows had an average DMI of 22.8 kg DM/day and 23.8 kg DM/day, respectively. Using the same technique – feeding troughs as described in the current investigation – Kaufmann et al. (Reference Kaufmann, Azizi and Hasselmann2007) reported a daily DMI of 21.6 kg.
Daily CI was not clearly affected by estrus. It seemed that cows – independent of the reproductive cycle – were motivated to visit the concentrate feeding station to obtain their individual ration of the tasty concentrate mixture.
Among the analyzed cows, great variation has been found in daily water consumption. The results of the present study showed a decrease in daily WI, which is similar to that found by Meyer et al. (Reference Meyer, Everinghoff, Gädeken and Flachowsky2004) and Lukas et al. (Reference Lukas, Reneau and Linn2008). In the own investigation, the lowest value was found 1 day before the day of estrus. Compared with DMI (and BW), the low level of WI during estrus lasted for about 2 days (day −1 and day 0) after which water consumption then returned – relatively fast – to base level, and rose higher. It might be that cows have to compensate loss in WI during estrus.
Thus, the observed declines in food consumption and WI were found to be further behavioral signs of estrus. Comprehensive knowledge of traits indicate that estrus may be important for improving detection rates on dairy farms.
Decreased DMI and WI probably were consequences of increased activity behavior in estrous cows including mainly restlessness and mounting (Van Eerdenburg et al., Reference Van Eerdenburg, Karthaus, Taverne, Merics and Szenci2002). Several pedometer studies confirmed an obvious rise in the number of steps. In comparison with non-estrous days, activity behavior of cows in estrus was increased by a factor of 2.3 (Redden et al., Reference Redden, Kennedy, Ingalls and Gilson1993) to 4 (Berka et al., Reference Berka, Stípkova, Volek, Rehák, Mateju and Jílek2004). Increased levels of general activity were also found in studies by Reith and Hoy (Reference Reith and Hoy2011) and Kamphuis et al. (Reference Kamphuis, DelaRue, Burke and Jago2012), in which neck transponders attached to the neck collar of each cow were used for the automatic identification of estrus. Arney et al. (Reference Arney, Kitwood and Phillips1994) observed a stepwise increase in activity starting already 3 days before estrus. The current results indicated that gradual deviations in data were measured 1 and 2 days, respectively, before the day of estrus. Brehme et al. (Reference Brehme, Stollberg, Holz and Schleusener2006) found similar dynamics for lying time of estrous cows and reported that these cows are recumbent for 6 to 17 h. They investigated lying time in parallel to daily activity behavior and concluded that the detection of estrus can be improved by analyzing data of more than one single trait. In a previous study, we showed that time spent ruminating also correlated with cows’ estrus. Very similar to the dynamics of feed intake, the dynamics of rumination time followed nearly the same pattern in the estrous period. In contrast with the reference period in which cows ruminated on average 429 min/day, rumination time was reduced to a duration of 355 min on the day of estrus (Reith and Hoy, Reference Reith and Hoy2012). Obviously, reduced rumination time can be interpreted as the consequence of decreased DMI during estrus.
The values of DMI and WI were enormously scattered among cows. One of the greatest effects of between individual variation is age. Compared with primiparous animals, multiparous cows consumed more feed (19.2 v. 17.1 kg), and spent more time eating (260 v. 213 min/day; Maekawa et al., Reference Maekawa, Beauchemin and Christensen2002). Dado and Allen (Reference Dado and Allen1994) studied cows’ WI and added that older cows showed increased WI by about 30%. When investigating changes during estrus, age was correlated with a decrease in rumination time (Reith and Hoy, Reference Reith and Hoy2012), and the increase in activity was less pronounced in older cows (Yániz et al., Reference Yániz, Santolaria, Giribet and López-Gatius2006). In a detailed review, Orihuela (Reference Orihuela2000) listed several further reasons for inter-individual variations such as dominance order, milk yield, nutrition and a number of environmental factors. It can be assumed that ration composition as well as feeding practice additionally had a major impact on DMI and WI in a dairy herd.
The average BW (655 kg) of the cows in the current investigation was in agreement with results of other studies using Holstein cows (Maekawa et al., Reference Maekawa, Beauchemin and Christensen2002; Meyer et al., Reference Meyer, Everinghoff, Gädeken and Flachowsky2004; Kume et al., Reference Kume, Nonaka, Oshita and Kozakai2010). In the majority of cows, BW was reduced with a weak decline recorded on the day of estrus. In another investigation, we analyzed each cow’s BW data obtained by a scale installed in the automatic milking system and found the same pattern (Reith and Hoy, Reference Reith and Hoy2011). Maltz et al. (Reference Maltz, Devir, Metz and Hogeveen1997) reported that the decrease in BW near estrus lasted between 1 and 3 days. In addition, the researchers detected lower BW associated with a significant reduction in DMI and a decrease in rumen content, respectively. They indicated that in the dairy industry BW and its changes can, indeed, contribute to predict estrus. In some cases, BW responded clearly and better than milk yield in the period of estrus.
Correlations between DMI, WI, and BW and estrus
DMI is one of the most important factors affecting WI of dairy cows (Kume et al., Reference Kume, Nonaka, Oshita and Kozakai2010). In the present study, a close relationship between DMI and WI existed during the reference period, which is similar to that detected by Holter and Urban (Reference Holter and Urban1992) (r=0.69), higher to that reported by Meyer et al. (Reference Meyer, Everinghoff, Gädeken and Flachowsky2004) (r=0.107) and lower to the correlation indicated by Kume et al. (Reference Kume, Nonaka, Oshita and Kozakai2010) (r=0.83). Incidentally, further research on this could be interesting to clarify whether the causal relationship would come from both traits. On the basis of their correlation calculation, Lukas et al. (Reference Lukas, Reneau and Linn2008) and Kramer et al. (Reference Kramer, Stamer, Spilke, Thaller and Krieter2009) concluded that daily water consumption can be an indirect trait to predict individual changes in feed intake as well as to identify sick cows.
Not only DMI but also BW affected daily WI. It was detected that cows with higher BW seemed to consume more water. This would be in accordance with the results of Meyer et al. (Reference Meyer, Everinghoff, Gädeken and Flachowsky2004) and Kume et al. (Reference Kume, Nonaka, Oshita and Kozakai2010) who also obtained with r=0.417 and r=0.75 positive correlations between BW and WI. Investigating the relationship between DMI and BW, Maltz et al. (Reference Maltz, Devir, Metz and Hogeveen1997) observed a continuous increase in feed intake of cows paralleled by an increase in BW. Such relationships suggest that DMI, WI and BW (as well as milk yield) follow a specific pattern being characteristic for the different physiological states – be it the postpartum period or estrus – during cows’ lactation. Herd managers can take advantage of this knowledge for improved monitoring of individual cows. As it is described by Firk et al. (2002), detection rates for physiological disorders or estrus would be higher when different traits are considered simultaneously. More investigations are necessary to determine whether the analyzed traits are useful for combined analysis.
In the present study, it was shown that each trait was significantly (DMI: P<0.001 and BW: P<0.01) or nearly significant (WI: P=0.07) reduced during estrus. Despite the fact that the given sample size is relatively small, we are confident that DMI and WI were truly influenced by the estrous cycle of dairy cows.
Final remarks
Worldwide, numerous studies were carried out on cows’ reproductive performance and have revealed severe problems in detecting estrous cows. The results of the current study indicate that DMI, WI and BW are influenced by estrus. Actually, monitoring feed intake and WI on a daily individual basis is only practical in research farms. If the declines differ significantly from daily fluctuations, it may be possible to define an algorithm used as an additional management aid. Alerts placed on lists could then inform the herd manager about changes in DMI, WI and BW, indicating not only illness but also estrus of modern dairy cows. The results give rise to further research with the aim to analyze whether monitoring of DMI, WI and BW may help to improve the detection of estrus in practise.