Implications
A comparison of feeding level (600 v. 1200 g/day) and protein content (210 v. 270 g CP/kg dry matter) of calf milk replacer for dairy heifers found no effects on age at first service or age at successful service, and there were no milk production effects. The data provide a sound basis for developing pre-weaning feeding strategies for dairy herd replacements but they also indicate no long-term benefits of an increased level of nutrition of replacement heifers during the milk-feeding period.
Introduction
For almost 30 years, recommended growth rates for dairy heifer calves have been set at 450 to 600 g/day between birth and weaning (Garnsworthy, Reference Garnsworthy2005). This has normally been achieved by feeding a fixed level of milk replacer (MR; 500 g milk powder/calf per day) between 7 and 56 days of age. Van Amburgh et al. (Reference Van Amburgh, Tikofsky and Smith2001) and Drackley (Reference Drackley2005) questioned if restricted feeding was the most biologically sound approach to achieving optimal calf growth and health, and suggested the adoption of much higher levels of feeding. In addition to higher feeding levels, it was suggested that the MR should have a higher protein content (260 to 280 g CP/kg) in order to better meet the protein requirements of rapidly growing muscle (Van Amburgh et al., Reference Van Amburgh, Tikofsky and Smith2001). The aim of this ‘accelerated’ growth regime is to exploit the high lean tissue growth potential of young calves and promote greater lean growth without fattening. Diaz et al. (Reference Diaz, Smith and Van Amburgh1998 and Reference Diaz, Van Amburgh, Smith, Kelsey and Hutten2001) showed that feeding a MR of 300 g/kg CP increased lean tissue deposition without fattening, whereas Blome et al. (Reference Blome, Drackley, McKeith, Hutjens and McCoy2003) and Bartlett et al. (Reference Bartlett, McKeith, VandeHaar, Dahl and Drackley2006) showed that it increased MR protein concentration while maintaining a constant energy density and decreased body fat content. It is important to note that calves in these studies were offered a liquid diet with no supplementary starter concentrates.
It has been well documented that neonatal nutrition influences performance in later life in many species (e.g. Desai and Hales, Reference Desai and Hales1997), but there has been little investigation of the phenomenon in cattle. Better understanding of the direct and residual effects of nutrition during the first 60 days of life may help optimise lifetime productivity (Drackley and Bartlett, Reference Drackley and Bartlett2001), and there is considerable current interest in manipulating feeding to accelerate growth in the pre-weaning phase. Studies that have examined the long-term effects of levels of pre-weaning nutrition on the performance of dairy herd replacements have frequently had confounding factors in their design. For example, level of feeding was confounded by differences in feeding method in the study by Bar-Peled et al. (Reference Bar-Peled, Robinson, Maltz, Tagari, Folman, Bruckental, Voet, Gacitua and Lehrer1997) and by differences in feed type (whole milk compared with MR) in that by Shamay et al. (Reference Shamay, Werner, Moallem, Barash and Bruckental2005), while Blome et al. (Reference Blome, Drackley, McKeith, Hutjens and McCoy2003) and Brown et al. (Reference Brown, VandeHaar, Daniels, Liesman, Chapin, Keisler and Weber Nielsen2005) used calves with a starting age of 2 to 3 weeks.
The objective of the current study was to examine the effect of increasing MR intake and of CP content of the MR on new-born calf performance from birth to weaning (in terms of weight gain and skeletal size), and to look for residual effects on performance following calving at 24 months of age.
Material and methods
Animals
Calves used in the study were sourced from the dairy herd at the Agri-food and Biosciences Institute, Hillsborough. All were born between 8 September and 5 March and were allocated to the study following weighing at less than 12-h-old. This weight was recorded as birth weight. Calves not observed suckling their mother received 2 l of colostrum via an oesophageal tube or teated feeding bottle before transfer to the calf-rearing unit.
A total of 153 Holstein-Friesian (88 heifers, 65 bulls) calves were randomly allocated to one of four treatments at 5 days of age. The mean birth weight was 43 kg (s.d. 4.8) and the mean genetic merit (PIN2000) was £48 (s.d. = 10.7).
Treatments and experimental design
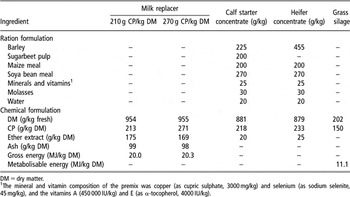
A 2 × 2 factorial design was used comprising of two levels of MR feeding: 5 or 10 l/day of reconstituted MR containing 120 g of MR powder per litre of water and two MRs containing either 210 g CP/kg dry matter (DM) or 270 g CP/kg DM (Table 1). Calves were introduced to treatments on day 5 and remained on these treatments until day 56. In total, 23 female and 15 male calves were offered MR containing 210 g CP/kg DM at 5 l/day, with 22 female and 18 male calves offered this MR at 10 l/day. Likewise, 20 female and 17 male calves were offered the MR containing 270 g CP/kg DM at 5 l/day with 23 females and 15 males offered 10 l/day. All procedures involving animals were carried out under the authority of The Animal (Scientific Procedures) Act 1986.
Formulation and chemical analysis of the milk replacers, calf starter concentrate, heifer rearing concentrate and grass silage offered post weaning

DM = dry matter.
1The mineral and vitamin composition of the premix was copper (as cupric sulphate, 3000 mg/kg) and selenium (as sodium selenite, 45 mg/kg), and the vitamins A (450 000 IU/kg) and E (as α-tocopherol, 4000 IU/kg).
Feeding and housing
On entering the rearing accommodation (at <12-h-old), calves were penned in groups of not more than three. From day 5, calves were group-housed within treatments, in straw-bedded pens and a maximum of 25 calves per pen. Calves received colostrum from a bucket for the first 4 days of life (2 l fed twice daily), and a mix of half colostrum/half MR on day 5. On day 5, calves were introduced to one of two automated feeders (operating with four holding pens), calibrated so as to provide each calf a predetermined daily amount of MR. From day 5 until weaning at 56 days, MR was fed via automatic teat feeders (Forster Technic). MR allowance was reduced in equal steps from day 49 to weaning at day 56 for the 5 l/day treatments, and from day 46 to 56 for the 10 l/day treatments. The MRs were whey-based, containing mainly milk-derived protein (1.5% non-milk protein from spray-dried, hydrolysed wheat protein), which was primarily formulated using whey-protein isolate produced by ultra filtration (Nutreco Ltd, Boxmeer, Netherlands) (Table 2). A flowing agent (aluminium silicate) was added to the MR powder to facilitate feeding through the automated machines. The flowing agent was responsible for the small increase in average ash content in the current study compared with that reported in other studies (e.g. Bartlett et al., Reference Bartlett, McKeith, VandeHaar, Dahl and Drackley2006). Drinking water was available at all times throughout the study.
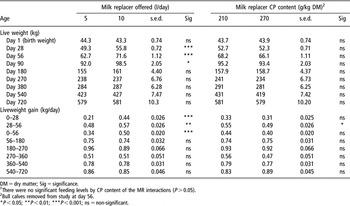
Live weight (kg) and liveweight gains (kg/day) for calves offered 5 v. 10 l milk replacer/day and either a milk powder containing 210 or 270 g CP/kg powderFootnote 1

DM = dry matter; Sig = significance.
1 There were no significant feeding levels by CP content of the MR interactions (P > 0.05).
2 Bull calves removed from study at day 56.
* P < 0.05; **P < 0.01; ***P < 0.001; ns = non-significant.
Calf starter concentrate was offered ad libitum from day 5 via feeding troughs placed at the front of the group pens. The formulation of the calf starter concentrate is shown in Table 1.
After weaning on day 56, calves were moved out of the milk-feeding pens and housed in treatment groups of not more than 25 calves until 12 weeks of age. During this period, calves were offered 2 kg concentrate/head per day, and had ad libitum access to grass silage of 202 g DM/kg (see Table 1). At 12 weeks of age, heifer calves were moved into cubicle accommodation and post-weaning performance was recorded in these female animals only. In the cubicle accommodation, calves were housed in groups of 14 with at least one cubicle per calf and were offered ad libitum grass silage and 2 kg of heifer concentrate/head per day. Calves were turned out to grass during April and May and were re-housed in cubicle accommodation during October. Heifers were offered grass silage ad libitum and concentrates at 2 kg/head per day (Table 1) from October until turnout in the following April.
Fertility management and early lactation performance
Artificial insemination (AI) was commenced at a minimum age of 13.5 months (aiming to calve at 24 months) and a minimum weight of 315 kg. Pregnancy diagnosis was performed at 42 days after AI by a veterinarian. Heifers (83) were presented for AI and full first-lactation milk production data was recorded for 81 of these animals. In all, 66 animals commenced a second lactation and 59 complete lactational records were obtained. Milk yield and composition were obtained monthly using the United Dairy Farmers’ milk recording system (accredited by the International Committee for Animal Recording).
Measurements and sampling
Individual MR intakes were recorded on 5 days/week from day 5 until weaning at day 56. Daily MR intake was noted from the automatic feeder computer program (Kalbman, supplied by Forster Technic). Intake of calf starter concentrate was based on mean group intake, calculated as amount offered per week minus refusals.
Live weight was recorded weekly and skeletal size (withers height and heart girth; Hoffman, Reference Hoffman1997) fortnightly throughout the pre-weaning phase. After weaning, live weight, skeletal size and body condition (Edmondson et al., Reference Edmondson, Lean, Weaver, Farver and Webster1989) were recorded at monthly intervals.
Single point blood samples were taken, after morning feeding, from the jugular vein using lithium heparin coated Vacutainer sample tubes (Becton Dickinson, Plymouth, UK) at fortnightly intervals from birth to weaning, with the first sample taken on day 5. After weaning, monthly blood samples were taken (between 0900 h and 1200 h) up to 12 months of age. Following centrifugation, plasma aliquots were frozen at −20°C until assayed. Plasma total protein, albumin and urea estimations were carried out using Roche Diagnostics’ (East Sussex, UK) kits on a Roche Diagnostics Hitachi 917 clinical chemistry analyser. Globulin concentration was calculated as total protein concentration minus albumin concentration. Leptin was determined (female calves only) by radioimmunoassay (RIA) (Wylie et al., Reference Wylie, Woods, Carson and McCoy2008) using an antibody raised in guinea pigs against recombinant ovine leptin (re-OL) donated by Prof. A Gertler (The Hebrew University of Jerusalem, Israel). 125I-ovine leptin was prepared from this same leptin, and re-OL from Oxford Biosystems (Oxford, UK) was used as assay standard. The final dilution of primary antibody was 1 : 160 000 and the sensitivity of the assay was 0.5 ng leptin/ml. Mean recoveries of 5 and 10 ng additions of the standard to bovine serum were 95.2% and 98.3%, respectively (range 90.8% to 101.9%). Serial dilution of a bovine sample showed parallelism to the standard curve. Mean intra-assay CVs were 6.4% and 11.9%, respectively, for high and low controls of pooled ovine sera, and inter-assay CVs were 10.98% and 12.42% for the same controls. Samples from female calves born after 1 January were assayed in a third RIA with intra-assay CVs of 9.2% and 13.2%, respectively, for the same controls. Assays were balanced for treatment (MR level and protein content).
Statistical analysis
Linear regression analysis was used to calculate liveweight gains over the various phases of rearing. Due to the unequal replication of the treatments, these, and other continuous data were analysed using the Genstat 6 (Lawes Agricultural Trust, 2002) REML procedure for the analysis of variance of unbalanced data. This fitted a fixed model with effects for sex, birth weight, month of birth and main effects and interactions for feeding level and CP concentration factorial treatments.
Average weekly milk intake values were calculated and repeated measures REML analysis was used to fit a model as detailed previously, with the additional inclusion of week and its interactions. The weekly calf concentrate intakes were analysed using a randomised block model with week as the blocking factor. Conception rates were analysed using binomial regression with birth weight and month of birth incorporated in the model fitting fixed effects for feed level, MR CP concentration and their interactions. REML variance components analysis was also carried out on the blood parameters fitting a fixed model with effects for sex, birth weight, month of birth and main effects and interactions for the feeding level and CP concentration factorial treatments. Post-calving dietary regime, month of birth, PIN value and birth weight were all included in the statistical model when analysing the effect of MR treatment on lactation performance. All statistical analyses were carried out using Genstat 6 (Lawes Agricultural Trust, 2002).
Results
Intake
Milk replacer intake
Calves offered 5 l MR/day consistently consumed their allocation, while intake for calves offered 10 l MR/day increased from 6.2 l/day in week 1 to 9.1 l/day in week 4 (s.e.d. = 0.18) (Figure 1). Between weeks 4 and 7, MR intake for calves offered 10 l MR/day remained relatively constant. Overall, there was a significant difference in MR intake (P < 0.001) between the MR level treatments with calves on the 5 and 10 l MR/day, consuming, on average, 554 and 944 g MR/day (s.e.d. = 15.3), respectively.
Intakes of milk replacer containing 210 g CP/kg dry matter (DM) or 270 g CP/kg DM during the pre-weaning phase for calves offered either 5 or 10 l/day (average s.e.d. = 0.273).

Concentrate intake (pre-weaning)
There was a significant (P < 0.001) difference in concentrate intakes between calves offered 5 l MR/day, which consumed an average of 0.43 kg concentrate DM/day, and calves offered 10 l MR/day, which consumed an average of 0.28 kg concentrate DM/day (s.e. = 0.015). There was a tendency (P = 0.105) for increased concentrate intake by calves offered the 210 g CP/kg DM MR over those offered the 270 g CP/kg DM MR. No interaction between MR CP content and MR feeding level was observed.
Growth and development characteristics
Live weight and liveweight gain
There was no significant interaction between the level of MR feeding and MR CP content for either live weight or liveweight gain responses during the period from birth to weaning. Calves offered 10 l MR/day had higher growth rates from birth to day 28 (P < 0.001), and were, on average, 6.5 kg heavier than calves offered 5 l MR/day by day 28 (P < 0.001) (Table 2). From day 28 to weaning (day 56), the liveweight gain of calves offered either 5 or 10 l MR/day remained significantly different but the magnitude of the difference was reduced. At weaning, calves reared on 5 and 10 l MR/day were 62.7 and 71.6 kg, respectively (s.e.d. = 1.12) (P < 0.001).
There was no effect of increasing MR protein content on liveweight gain between birth and day 28 or between day 28 and weaning (day 56); however, calves offered the higher protein MR tended to have a lower rate of gain (P < 0.10) than calves offered the 210 g CP/kg DM MR and, as a result, calves fed the higher protein MR were 2.1 kg (P < 0.10) lighter at weaning compared with those fed the lower protein MR.
Pre-weaning treatment had no significant effect on daily liveweight gain from weaning through to 720 days of age.
Skeletal size and body condition score
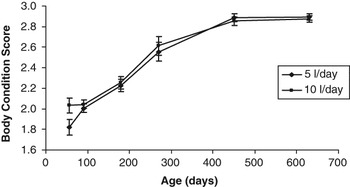
At day 56, calves offered 10 l MR/day were taller (+3 cm; P<0.001) and had a greater heart girth (+4 cm; P < 0.001) at weaning compared with calves offered 5 l MR/day. There was no effect of MR protein content on withers height (P > 0.05); however, calves offered the higher CP MR had lower heart girth at weaning (−2 cm, P < 0.05) compared with calves offered the lower CP MR. Body condition score was unaffected by MR CP content throughout the trial (Figure 2); however, feed level did have an impact, with calves offered 10 l MR/day being in higher body condition (P < 0.001) at weaning relative to those offered 5 l MR/day.
Body condition score of calves offered 5 or 10 l milk replacer/day (s.e.d. shown for each data point).

Post-weaning, no effects of either milk feeding level or MR CP content were seen either in body size measurements or in body condition score.
Blood parameters
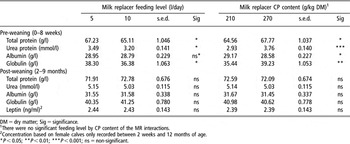
Calves offered 10 l MR/day compared with those offered 5 l MR/day had lower plasma total protein (P < 0.05), lower urea (P < 0.05) and lower globulin (P < 0.05) concentrations (Table 3) during the pre-weaning phase. Calves offered the 270 g CP/kg DM MR had higher total protein (P < 0.05), urea (P < 0.001) and globulin (P < 0.01) concentrations compared with calves offered the 210 g CP/kg DM MR. Post-weaning, there were no significant treatment effects on blood metabolite concentrations.
Plasma metabolite and leptin concentrations in calves offered the milk replacer treatmentsFootnote 1

DM = dry matter; Sig = significance.
1 There were no significant feeding level by CP content of the MR interactions.
2 Concentration based on female calves only recorded between 2 weeks and 12 months of age.
* P < 0.05; **P < 0.01; ***P < 0.001; ns = non-significant.
Treatments had no significant effects on leptin concentrations (Table 3). However, leptin concentration increased from 2.1 ng/ml at 9 months of age to 3.3 ng/ml at 12 months of age (s.e.d. = 0.18; P < 0.01).
Fertility
Ages at first mating were 434 and 430 days (s.e.d. = 4.3) and ages at first pregnancy confirmation were 448 and 449 days (s.e.d. = 7.0), respectively, for heifers offered 5 or 10 l MR/day. There were no significant differences in age at first mating (432 days; s.e.d. = 4.2) or age at first pregnancy (447 and 450 days; s.e.d. = 6.9) for calves offered MR containing 210 or 270 g CP/kg DM, respectively.
Adult performance
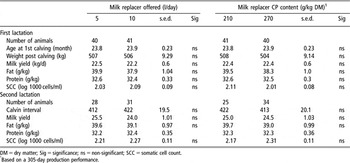
There were no treatment effects on live weight or age at calving (Table 4) or on milk yield or milk composition in the first or second lactation (Table 4). There were no treatment effects also on somatic cell count or calving interval.
Milk production of heifers offered milk replacer treatmentsFootnote 1

DM = dry matter; Sig = significance; ns = non-significant; SCC = somatic cell count.
1 Based on a 305-day production performance.
Discussion
The nutrition of dairy heifer calves during the rearing period can have significant short-term and long-term effects on their performance as herd replacements (e.g. Carson et al., Reference Carson, Dawson, McCoy, Kilpatrick and Gordon2002). In this discussion, the immediate effects of the MR treatments on performance during the pre-weaning phase will be reviewed followed by an evaluation of the longer-term effects on growth and subsequent lactational performance.
Influence of increasing milk replacer intake
In the current study, higher growth rates were achieved in calves offered 10 l MR/day compared with 5 l MR/day during the milk-feeding period, resulting in calves of greater live weights at weaning. The magnitude of the response was in line with earlier studies by Jasper and Weary (Reference Jasper and Weary2002) and Fallon et al. (Reference Fallon, Wicks and Twigge2005). Skeletal measurements and body condition score changes suggest that the live weight differences resulted from the enhanced deposition of both lean tissue and fat. Shamay et al. (Reference Shamay, Werner, Moallem, Barash and Bruckental2005) found that differences in skeletal size that occurred during the pre-weaning phase disappeared post weaning. This observation was supported by results from the current study in which calves offered higher levels of MR were significantly larger in size at weaning, only for these differences to disappear shortly after weaning. In the current study, differences in weaning weight had disappeared by 9 months of age, in line with the observations of Speijers et al. (Reference Speijers, Langa, Struthers, Twigge and Scaife2005).
It is well established that increasing the level of MR offered to calves reduces their consumption of concentrates. In the current study, concentrate consumption in the pre-weaning period was reduced by 25 g DM per 100 g increase in the level of MR offered. In the studies of Fallon et al. (Reference Fallon, Wicks and Twigge2005), concentrate consumption decreased by 17 to 53 g DM per 100 g increase in MR offered. The introduction of concentrates into the diet early in calf life is important for the stimulation of reticulo-rumen development (Williams and Frost, Reference Williams and Frost1992). Quigley et al. (Reference Quigley, Wolfe and Elsasser2006) reported an average daily intake of 0.5 kg of concentrates by 28 days of age in calves offered 454 g of MR/day and by 33 days of age in calves offered a variable amount – up to 908 g of MR/day. Based on these observations, it is likely that calves in the current study offered the lower MR feeding level commenced their intake of concentrate in significant quantities at an earlier age. This secondary nutrient source will have acted as a buffer, partially compensating for the difference in nutrient intake between the MR treatments as reflected in the reduced difference in daily liveweight gain between calves on 600 v. 1200 g MR/day during weeks 4 to 8. This highlights the balance that must exist between the level of MR needed to maximise the growth potential of the calf in early life and the amount of calf starter concentrate needed to facilitate this buffering effect, and ensure a smooth diet transition at weaning.
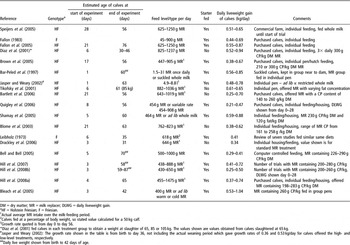
Average growth rates in the pre-weaning period were 0.3 and 0.5 kg/day for calves offered the 5 and 10 l MR/day treatments, respectively. A review of published data (Table 5) found that, on average, growth rates of 0.35 and 0.56 kg/day were achieved in earlier studies in which calves commenced the study at an age of less than 1 week old, were offered starter, and MR was offered at levels corresponding to 5 and 10 l/day, respectively. Accordingly, performance in the current study was in line with that reported elsewhere. However, these growth rates are significantly lower than the >1 kg/day claimed as achievable by Drackley (Reference Drackley2000) and observed by Diaz et al. (Reference Diaz, Van Amburgh, Smith, Kelsey and Hutten2001) when high levels of MR are offered.
Summary of studies examining daily liveweight gains during the milk-feeding period

DM = dry matter; MR = milk replacer; DLWG = daily liveweight gain.
aHF = Holstein Friesian; F = Friesian.
1Actual average MR intake over the milk-feeding period.
2Calves fed at a percentage of body weight, so stated value calculated for a 50 kg calf.
3Growth rate quoted is from day 0 to day 56.
*Diaz et al. (Reference Diaz, Van Amburgh, Smith, Kelsey and Hutten2001) fed calves in each treatment group to obtain a weight at slaughter of 65, 85 or 105 kg. The values shown are values obtained from calves slaughtered at 65 kg.
Jasper and Weary (Reference Jasper and Weary2002): The growth rate shown in the table is from birth to day 36, not including the actual weaning period which gave growth rates of 0.36 and 0.53 kg/day for calves offered the high- and low-level treatments, respectively.
Daily live weight shown from birth to 42 days of age.
Influence of increasing the crude protein content of milk replacer
Several studies have reported that calves offered a higher protein MR gain more live weight through the pre-weaning stage compared with those offered lower protein MRs. Examples of such studies include those by Blome et al. (Reference Blome, Drackley, McKeith, Hutjens and McCoy2003) and Bartlett et al. (Reference Bartlett, McKeith, VandeHaar, Dahl and Drackley2006) in which calves were offered MRs containing up to 260 g CP/kg DM. However, the response to increasing CP content does appear to decline when levels exceed approximately 220 g CP/kg DM as demonstrated by Donnelly and Hutton (Reference Donnelly and Hutton1976) and Bartlett et al. (Reference Bartlett, McKeith, VandeHaar, Dahl and Drackley2006). In agreement with data from the current study, Bell and Bell (Reference Bell and Bell2005) and Hill et al. (Reference Hill, Aldrich, Schlotterbeck and Bateman2006) reported no calf performance benefit when MR protein level was increased from 230 and 260 g/kg to 290 and 280 g/kg, respectively. Increasing the CP concentration of MR (up to 260 g CP/kg DM), while maintaining a constant energy concentration, has been shown to decrease body fat content (Bartlett et al., Reference Bartlett, McKeith, VandeHaar, Dahl and Drackley2006). In the current study, increasing MR protein content had no effect on body size, condition score or leptin concentrations, indicating similar rates of fat and protein deposition in calves offered MR containing 210 and 270 g CP/kg.
In the current study, it is likely that energy intake limited the growth of calves offered 600 g MR/day, preventing utilisation of the increased protein intake from the higher protein MR (National Research Council, 2001). However, ‘accelerated growth’ feeding regimes (Van Amburgh et al., Reference Van Amburgh, Tikofsky and Smith2001; Drackley, Reference Drackley2005), similar in formulation to the most intensive diet used in the present study, are based on elevated MR feeding levels and increased MR protein contents designed to supply adequate energy and protein for lean growth. Diaz et al. (Reference Diaz, Van Amburgh, Smith, Kelsey and Hutten2001) achieved calf growth rates exceeding 1 kg/day when calves consumed approximately 1.5 kg MR/day containing 300 g CP/kg DM. In the current study, calves offered 1200 g MR/day did not consume their full allocation, with average intakes of 962 and 925 g/day for the 210 and 270 g CP/kg DM MR groups, respectively. In addition, there was a tendency for concentrate intakes to be lower when calves were offered MR containing 270 compared with 210 g CP/kg DM. Consequently, overall protein intakes were similar for calves offered either MR at the higher feeding level. For the energy and protein intakes achieved in the current study, the NRC model (NRC, 2001) predicts growth rates of approximately 0.81 and 0.82 kg/day, respectively, for the 210 and 270 g CP/kg DM MR treatments offered at the high feeding rate (based on a 50 kg calf housed at 15°C). Using similar MR feeding levels to those in the current study and offering starter concentrate to individually penned calves, Pollard et al. (Reference Pollard, Dann and Drackley2003), Brown et al. (Reference Brown, VandeHaar, Daniels, Liesman, Chapin, Keisler and Weber Nielsen2005) and Hill et al. (Reference Hill, Bateman, Aldrich and Schlotterbeck2007) reported growth rates of 0.7 kg/day when calves consumed 924, 939 and 888 g MR/day, respectively, containing 260 to 290 g CP/kg. In the current study, calves on the ‘accelerated growth’ regime grew at 0.5 kg/day, similar to that reported by Bell and Bell (Reference Bell and Bell2005), using automatic feeding equipment through which calves were offered 1 kg/day of a MR containing 290 g CP/kg DM. The current study highlights the magnitude of the difference that can exist between growth rates predicted from nutritional requirements (NRC, 2001) and those achieved in commercial group-housed situations. As discussed previously, the growth rates achieved in the current study were close to the average values for similar feed rates determined from a review of published literature.
Influence of treatment on blood protein fractions
Blome et al. (Reference Blome, Drackley, McKeith, Hutjens and McCoy2003) demonstrated that plasma urea nitrogen (PUN) concentrations generally decreased during the first weeks of life, with calves offered MR with higher protein contents (25.8% CP) having elevated PUN concentrations. These authors suggested either that calves offered the 25.8% CP MR did not utilise the dietary nitrogen as efficiently as those offered MRs with a lower CP content (16.1% to 22.9% CP) or that calves fed lower protein MR were undersupplied with protein. Similar treatment effects were found in the current study, with calves offered higher protein MR showing higher PUN concentrations throughout the first 8 weeks of life compared with those offered lower protein MR. The growth data in the current study suggests that the higher PUN values are indicative of a lower efficiency of nitrogen use by calves offered the higher protein MR.
The range of mean treatment-related PUN concentrations measured in the current study (2.9 to 3.8 mmol/l), although higher than that (1.0 to 2.1 mmol/l) reported by Blome et al. (Reference Blome, Drackley, McKeith, Hutjens and McCoy2003) was comparable to those reported by Terosky et al. (Reference Terosky, Heinrichs and Wilson1997) and Diaz et al. (Reference Diaz, Van Amburgh, Smith, Kelsey and Hutten2001) at 2.5 to 2.9 and 3.3 to 4.7 mmol/l, respectively.
Long-term effects of pre-weaning nutrition
Bar-Peled et al. (Reference Bar-Peled, Robinson, Maltz, Tagari, Folman, Bruckental, Voet, Gacitua and Lehrer1997), Shamay et al. (Reference Shamay, Werner, Moallem, Barash and Bruckental2005), Moallem et al. (Reference Moallem, Werner, Lehrer, Katz, Livshitz, Bruckental and Shamay2006) and Drackley et al. (Reference Drackley, Pollard, Dann and Stamey2007) all found a positive relationship between level of nutrition in early life and subsequent milk production. Additionally, Shamay et al. (Reference Shamay, Werner, Moallem, Barash and Bruckental2005) reported a 23-day reduction in age at puberty and Bar-Peled et al. (Reference Bar-Peled, Robinson, Maltz, Tagari, Folman, Bruckental, Voet, Gacitua and Lehrer1997) demonstrated a 31-day reduction in first-calving age when heifer calves were offered a higher feed level up to weaning. However, many of these studies had confounding factors in their design. For example, level of feeding was confounded by feeding method in the study by Bar-Peled et al. (Reference Bar-Peled, Robinson, Maltz, Tagari, Folman, Bruckental, Voet, Gacitua and Lehrer1997) and by feed type (whole milk v. MR) in the studies by Shamay et al. (Reference Shamay, Werner, Moallem, Barash and Bruckental2005) and Moallem et al. (Reference Moallem, Werner, Lehrer, Katz, Livshitz, Bruckental and Shamay2006). Drackley et al. (Reference Drackley, Pollard, Dann and Stamey2007) demonstrated elevated milk and milk protein yields but similar milk fat yields in replacement heifers reared on an accelerated-growth regime, compared with a conventional limited-feed regime.
In contrast to studies reporting long-term benefits of accelerated feeding, Aikman et al. (Reference Aikman, Gould and Bleach2007) found no effects of increasing the level of nutrition during the pre-weaning period on first-lactation milk production characteristics. These workers offered the same MR (cold or warm), either ad libitum or at a restricted level (4 l/day), to 75 Holstein calves and followed their performance through to second calving. No significant effects of pre-weaning treatment on milk yield, age at first calving or live weight at first calving were reported. Similarly, Ballard et al. (Reference Ballard, Wolford, Sato, Uchida, Suekawa, Yabuuchi and Kobayashi2005) found no significant effect of an increased feeding rate of a 27% CP MR on 305-day fat-corrected milk yield (P > 0.10). The current study, which was longer than any previous study, found no milk production benefits from increasing either the level or the protein content of MR fed to group-fed calves receiving supplementary concentrates.
Conclusions
Calves offered high levels of MR grew significantly faster during the milk-feeding period but differences in live weight and body size at weaning (56 days) had disappeared by 3 months of age. There was no benefit, in terms of calf performance, of offering MR containing 270 g CP/kg DM compared to a MR containing 210 g CP/kg DM. Lactation performance indicated no benefit of increased MR feed level or MR CP content, suggesting that current UK feed recommendations (∼600 g MR/day; 23% CP) are appropriate for neonatal calf nutrition of dairy heifers.
Acknowledgements
The authors would like to thank Mr A Brown and the staff of the dairy heifer rearing unit for help with collection of data. Thanks are also due to Mr D Kilpatrick and staff of the Biometrics Department, Agri-Food and Biosciences Institute for assistance with the statistical analysis. This work was co-funded by the Department of Agriculture and Rural Development for Northern Ireland and AgriSearch. The authors would also like to acknowledge the support of Nutreco Ruminant Research Centre.