Management Implications
Elaeagnus angustifolia (Russian-olive) is a common invasive tree across the western United States that has profound effects on the ecology of riparian areas. There are many factors that may influence successful control of invasive plants, such as plant phenology, soil moisture, plant community, existing pest pressure, and timing of control. When biological control is being developed as a tool for integrated weed management, we should also consider the ability of biological control agents to effectively attack their host plants. In some cases, biological control agents have extreme host specificity and will attack some genotypes of an invasive plant, but not others. We expect invasions from multiple introduction events to be genetically diverse, and we want to make sure that control methods are effective on the range of diversity found in an invasion; otherwise, we run the risk of only controlling part of an invasion and potentially allowing resistant or tolerant genotypes to thrive. Here, we used genetic tools to identify the diversity of the E. angustifolia invasion and found three microsatellite genotype clusters in the U.S. invasion. We suggest accessions from the three clusters be included in preliminary host-specificity studies of agents to help ensure there is no genetically based resistance or tolerance in the plant invasion. We were not able to confirm specific Eurasian localities as origin(s) of the most common E. angustifolia genotype lineage in the United States but did confirm that that one of the rarer lineages could be from naturalized populations in Europe, and the other from native populations in central Asia, which helps identify potential sources of future coevolved, host-specific biological control agents. We identified the most genetically diverse populations across the United States and suggest these georeferenced locations be included in initial biological control agent release and monitoring so that managers can evaluate agent efficacy on representative genotypes in the field.
Introduction
Plant invasions can vary greatly in their levels of genetic diversity and distribution of diversity over space and time. Genetic diversity of invasions is driven by founding events, selection, drift, and mutation, and in some cases can have a large effect on the success or failure of an invasion (Bock et al. Reference Bock, Caseys, Cousens, Hahn, Heredia, Hübner, Turner, Whitney and Rieseberg2015). Understanding the genetic diversity of invasive populations can inform us of invasion patterns, history, and trajectories, as well as give us insights important to managing an invasion (Gaskin et al. Reference Gaskin, Bon, Cock, Cristofaro, De Biase, De Clerck-Floate, Ellison, Hinz, Hufbauer, Julien and Sforza2011; Jasieniuk et al. Reference Jasieniuk, Brûlé-Babel and Morrison1996; Müller-Schärer et al. Reference Müller-Schärer, Schaffner and Steinger2004; Roman and Darling Reference Roman and Darling2007; Ward et al. Reference Ward, Gaskin and Wilson2008). In particular, classical biological control, the management of invasive pests with specialized natural enemies from a pest’s native range, can benefit from information on the genetic diversity and genetic structure of invasive populations (Hufbauer and Roderick Reference Hufbauer and Roderick2005).
The safety and efficacy of classical biological control depend partly on the host range of biological control agents. Host range is an evolutionary trait ranging from broad, as in generalist herbivores, to narrow, as in tightly coevolved pairs of plant and herbivore species. Successful biological control agents should be specific enough to prevent non-target feeding and to have adaptations that allow them to find even rare hosts. However, it is possible for host specificity to be too narrow; in the extreme, herbivorous insects can be specific to just some genotypes of a plant species, which allows other genotypes to escape herbivory (Burdon et al. Reference Burdon, Groves and Cullen1981; Gaskin et al. Reference Gaskin, Bon, Cock, Cristofaro, De Biase, De Clerck-Floate, Ellison, Hinz, Hufbauer, Julien and Sforza2011; Goolsby et al. Reference Goolsby, De Barro, Makinson, Pemberton, Hartley and Frohlich2006; Grevstad et al. Reference Grevstad, Shaw, Bourchier, Sanguankeo, Cortat and Reardon2013; Lym et al. Reference Lym, Nissen, Rowe, Lee and Masters1996; Lym and Carlson Reference Lym and Carlson2002; Ward et al. Reference Ward, Gaskin and Wilson2008; Williams et al. Reference Williams, Friedman, Gaskin and Norton2014). If agents are highly host specific to only some invasive genotypes, we risk introducing agents that cannot help manage the whole invasion and thus select for invasive genotypes that are resistant or tolerant to that biological control agent (Burdon et al. Reference Burdon, Groves and Cullen1981), lowering overall control efficacy. Knowing the genetic diversity and its geographical distribution in an invasion can help us choose relevant plant genotypes to be tested for host specificity and agent efficacy. Here, our goal is to help insure that agents being developed for classical biological control can effectively help manage the entire plant invasion, not just a subset of the introduced plants.
Elaeagnus angustifolia L. (Russian-olive; Elaeagnaceae) is a tree species native to eastern Europe and Asia (CABI 2018; Little Reference Little1961) that was intentionally introduced to North America in the 19th century (Katz and Shafroth Reference Katz and Shafroth2003). To promote it as a shelterbelt (windbreak) tree, more than a million seedlings were planted in Canada during the second half of the 20th century, and the plantings in the United States were likely even more extensive (Collette and Pither Reference Collette and Pither2015). Elaeagnus angustifolia has escaped cultivation in western North America and is on the noxious weed lists in Colorado, Montana, New Mexico, Utah, Washington, and Wyoming. It has increased its frequency in riparian forests, wet pastures, ditches, and overflow channels (Lesica and Miles Reference Lesica and Miles1999) and is now the fourth most dominant riparian tree in the western United States (Friedman et al. Reference Friedman, Auble, Shafroth, Scott, Merigliano, Freehling and Griffin2005). Elaeagnus angustifolia fruit is distributed locally by birds (Edwards et al. Reference Edwards, Clark and Beck2014; Kindschy Reference Kindschy1998) and mammals (Olson and Knopf Reference Olson and Knopf1986). Fluvial transport is more likely to move seed longer distances, as the seed can float for up to 48 h (Lesica and Miles Reference Lesica and Miles2004). The maximum distance of seed travel is unknown, but human movement of trees for planting, ongoing since the early 1900s (Christensen Reference Christensen1963), likely moves propagules the farthest and may have the largest effect on genetic population structure across the invasion. Interstate shipment of E. angustifolia trees in many western U.S. states still occurs, especially through online nursery sales. Though this invasive tree enhances habitat for some wildlife species (Borell Reference Borell1971), it can have detrimental ecological effects, especially in riparian systems (Collette and Pither Reference Collette and Pither2015; Olson and Knopf Reference Olson and Knopf1986). Notably, many cavity-nesting and neotropical migrant bird species avoid E. angustifolia or prefer native tree species (McCarthy et al. Reference McCarthy, Pella, Link, Rumble, Uresk, Schenbeck and O’Rourke1997). Additionally, it may alter stream nutrient dynamics (DeCant Reference DeCant2008; Mineau et al. Reference Mineau, Baxter and Marcarelli2011), which can affect a broad selection of species and trophic interactions (Bateman et al. Reference Bateman, Paxton, Shafroth, Shafroth, Brown and Merritt2009; Collette and Pither Reference Collette and Pither2015).
Elaeagnus angustifolia is currently a target for biological control. Agent development is ongoing at CABI in Switzerland (co-authors US and PW; see CABI [2018] for biological control development progress). The most promising agents are a mite (Aceria eleagnicola Farkas) and a moth (Anarsia eleagnella Kuznetzov). One gap in knowledge is whether invasive E. angustifolia genotypes differ in susceptibility to these or other potential biological control agents. Elaeagnus angustifolia has six published varieties listed in its native range (Tropicos 2018) and several cultivated varieties available for purchase in North America (e.g., ‘Red King’, ‘Quicksilver’), suggesting that there might be diverse genotypes in the U.S. invasion. In the only previous genetic investigation of E. angustifolia in North America, Chowdhury et al. (Reference Chowdhury, Jana and Schroeder2000) analyzed RAPDs (randomly amplified polymorphic DNAs) and found that E. angustifolia in southwestern Saskatchewan had lower genetic diversity than its confamilial species (seaberry [Hippophae rhamnoides L.], silver buffaloberry [Shepherdia argentea (Pursh) Nutt.], and silverberry [Elaeagnus commutata (Bernh. ex Rydb.)]) and that 98% of E. angustifolia diversity was found within populations, as opposed to among populations (2%). It is not known whether E. angustifolia is self-compatible, but if it outcrosses, we expect a plant species to retain a high level of genetic diversity within populations and less differentiation among populations (Hamrick et al. Reference Hamrick, Godt, Sherman-Broyles, Adams, Strauss, Copes and Griffin1992). It also can reproduce vegetatively, but only by creating nearby shoots from regrowth after a plant is damaged (Bovey Reference Bovey1965).
Here we survey genetic variation of E. angustifolia using a chloroplast DNA region sequence and nuclear microsatellite loci to attempt to answer the following questions: (1) How diverse is the U.S. invasion? (2) How is the diversity spatially structured on a population and/or a regional scale? (3) Does variation in the markers assayed suggest linkages to a single geographic region or multiple regions in the native range? Answering these questions will provide insights into invasion dynamics and give guidance to which E. angustifolia accessions should be part of biological control host-specificity and efficacy testing.
Materials and Methods
For the simple sequence repeat (SSR) analysis we collected leaf material from a total of 584 Elaeagnus angustifolia plants: 460 individuals in the United States (46 populations; 10 plants per population) and 124 plants in Eurasia (14 locations) (Table 1; Figure 1; Supplementary Data File 1). The closest U.S. populations were 59 km apart. We strove to collect material from naturalized plants, but often it is unclear whether plants on properties are planted intentionally or naturalized. No collections were from obviously cultivated situations such as windbreaks. Plants were at least 5 m apart to minimize the probability of sampling vegetatively propagated clones. Collections in Eurasia were more irregular and opportunistic (mean = 8.8; 1 to 11 plants per location) and thus were used only in a preliminary analysis of origins and not in population level analyses. Noncultivated plants are difficult to find in Eurasia, and the only populations without a history of cultivation are thought to be the remnants of the Togai forests that exist in three valley-togai reserves, Badai-Tugai, Kyzylkum, and Zerafshan in Uzbekistan (T Rajabov, personal communication).
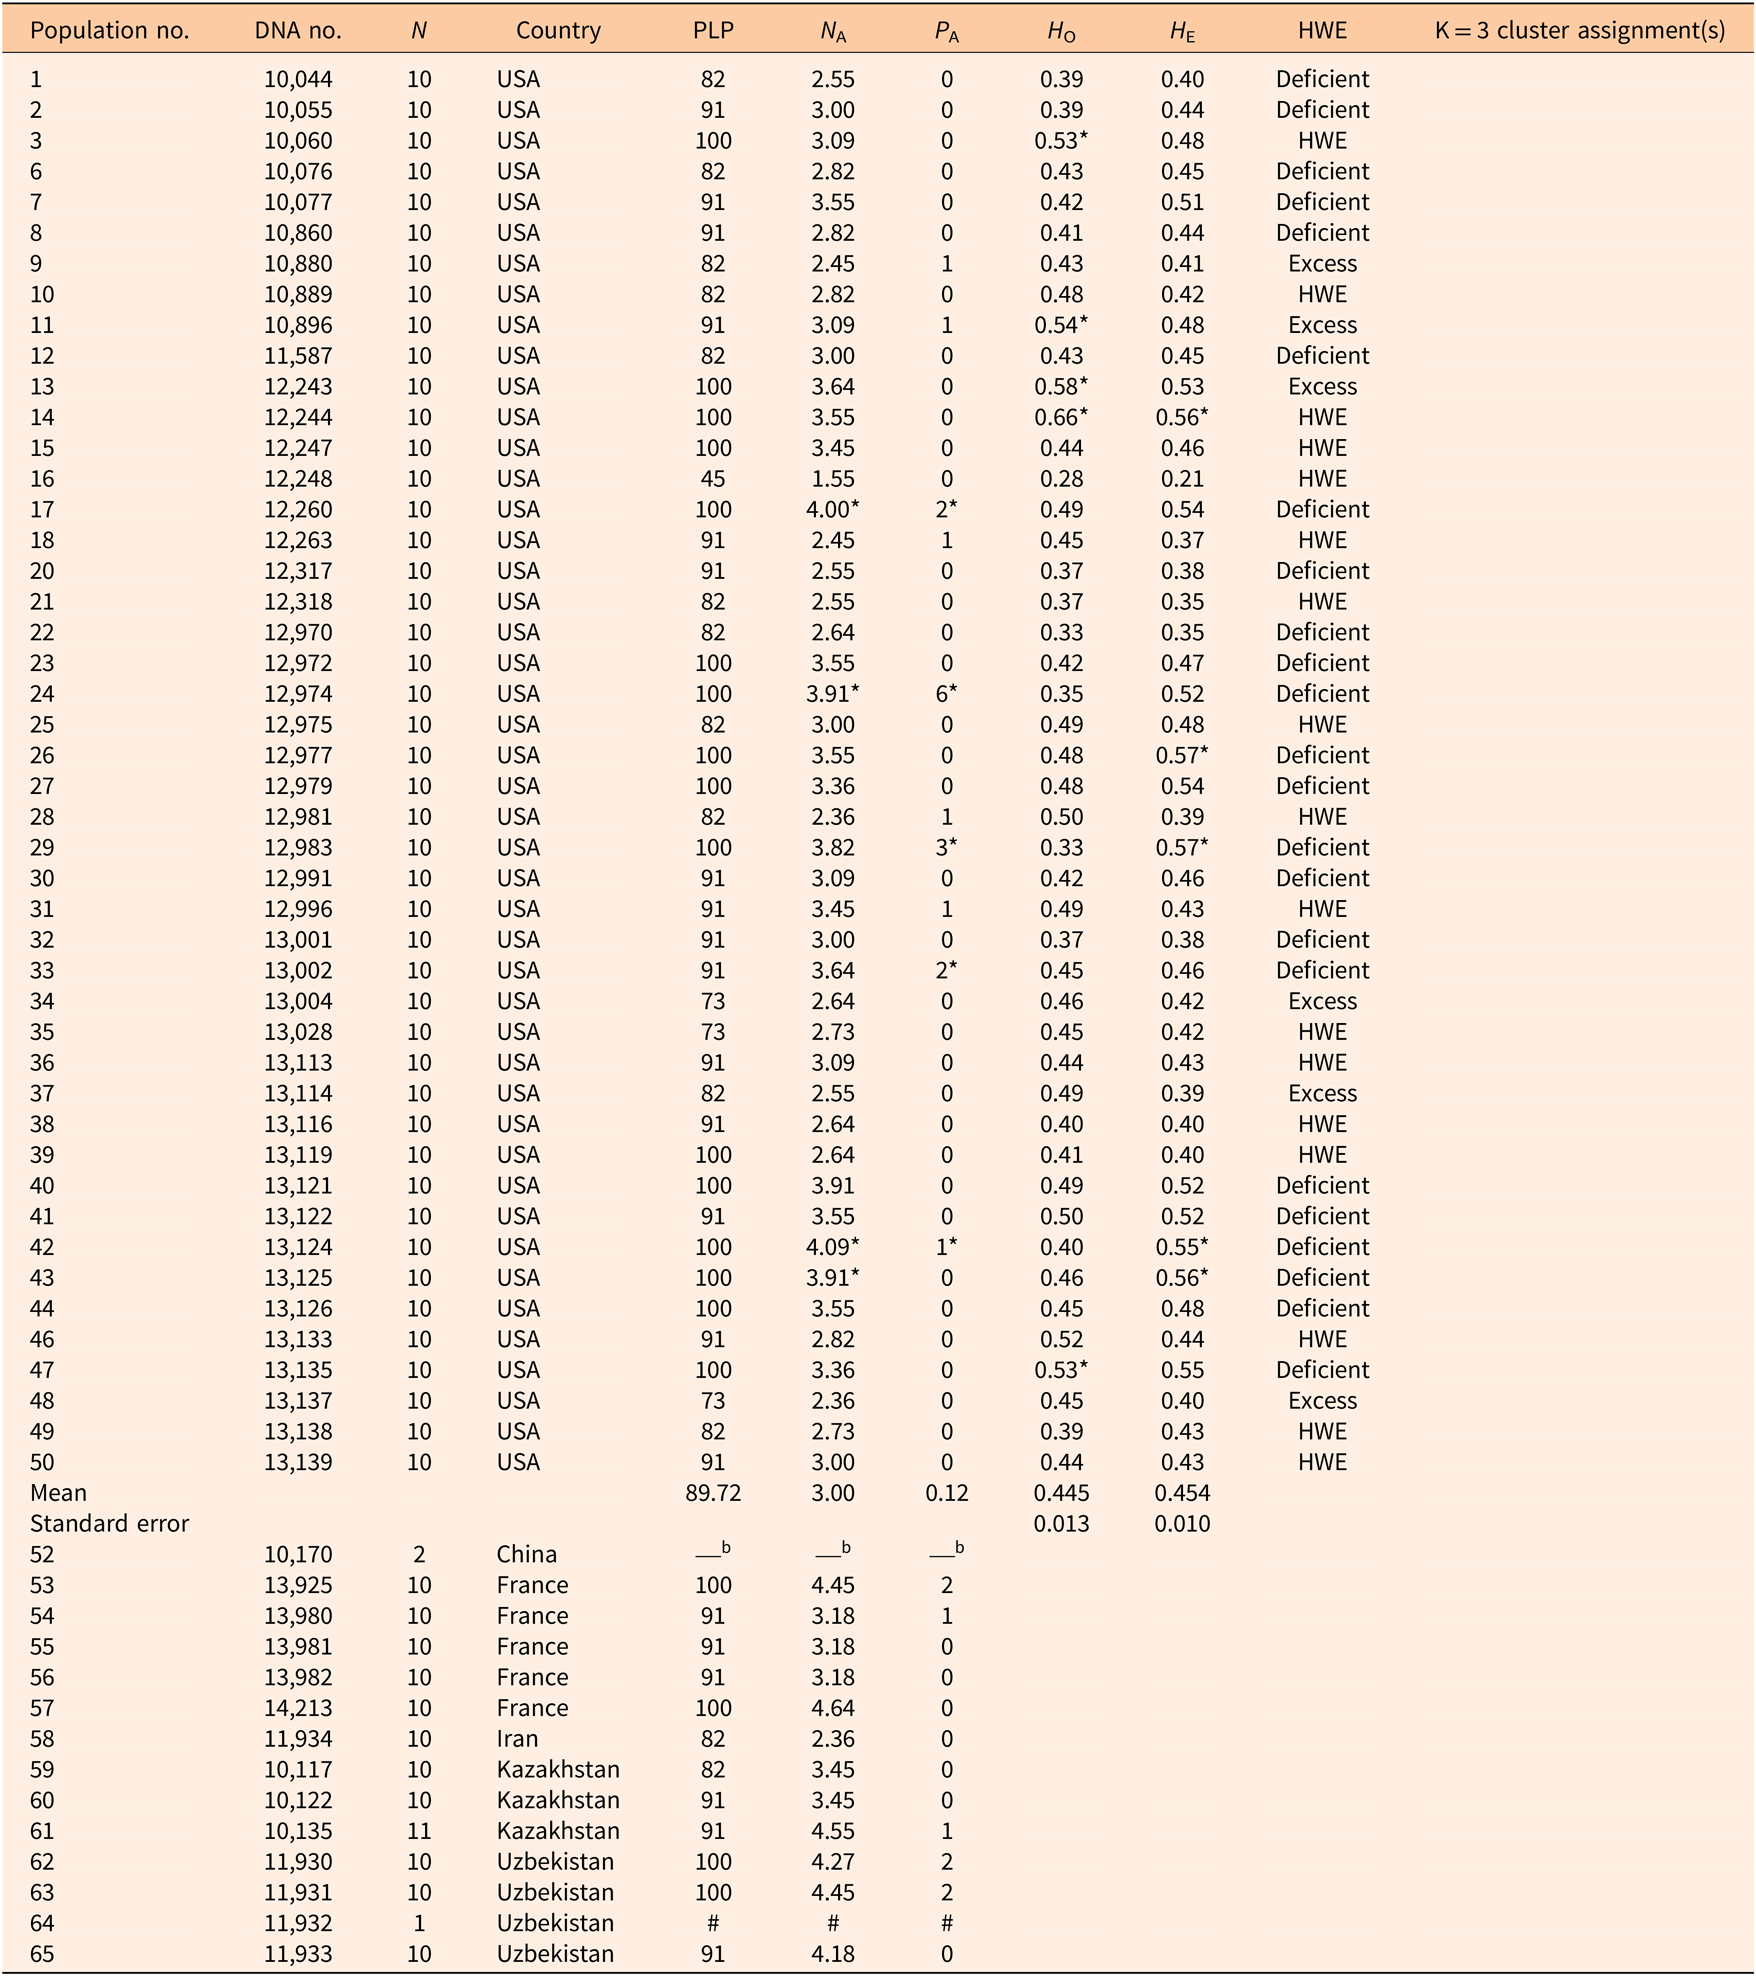
Population number, DNA number, number of plants per population, and country for Elaeagnus angustifolia collections in the United States and Eurasia, with percent of loci that are polymorphic (PLP), mean number of alleles per locus (N A), number of private alleles (P A), observed heterozygosity (H O), expected heterozygosity (H E), Hardy-Weinberg equilibrium (HWE), including note of excess or deficient heterozygosity if population not in HWE, and assignment of each U.S. population to genotype cluster by color.a

a An asterisk (*) indicates populations with the top five highest values.
b Too few individuals for useful comparison.
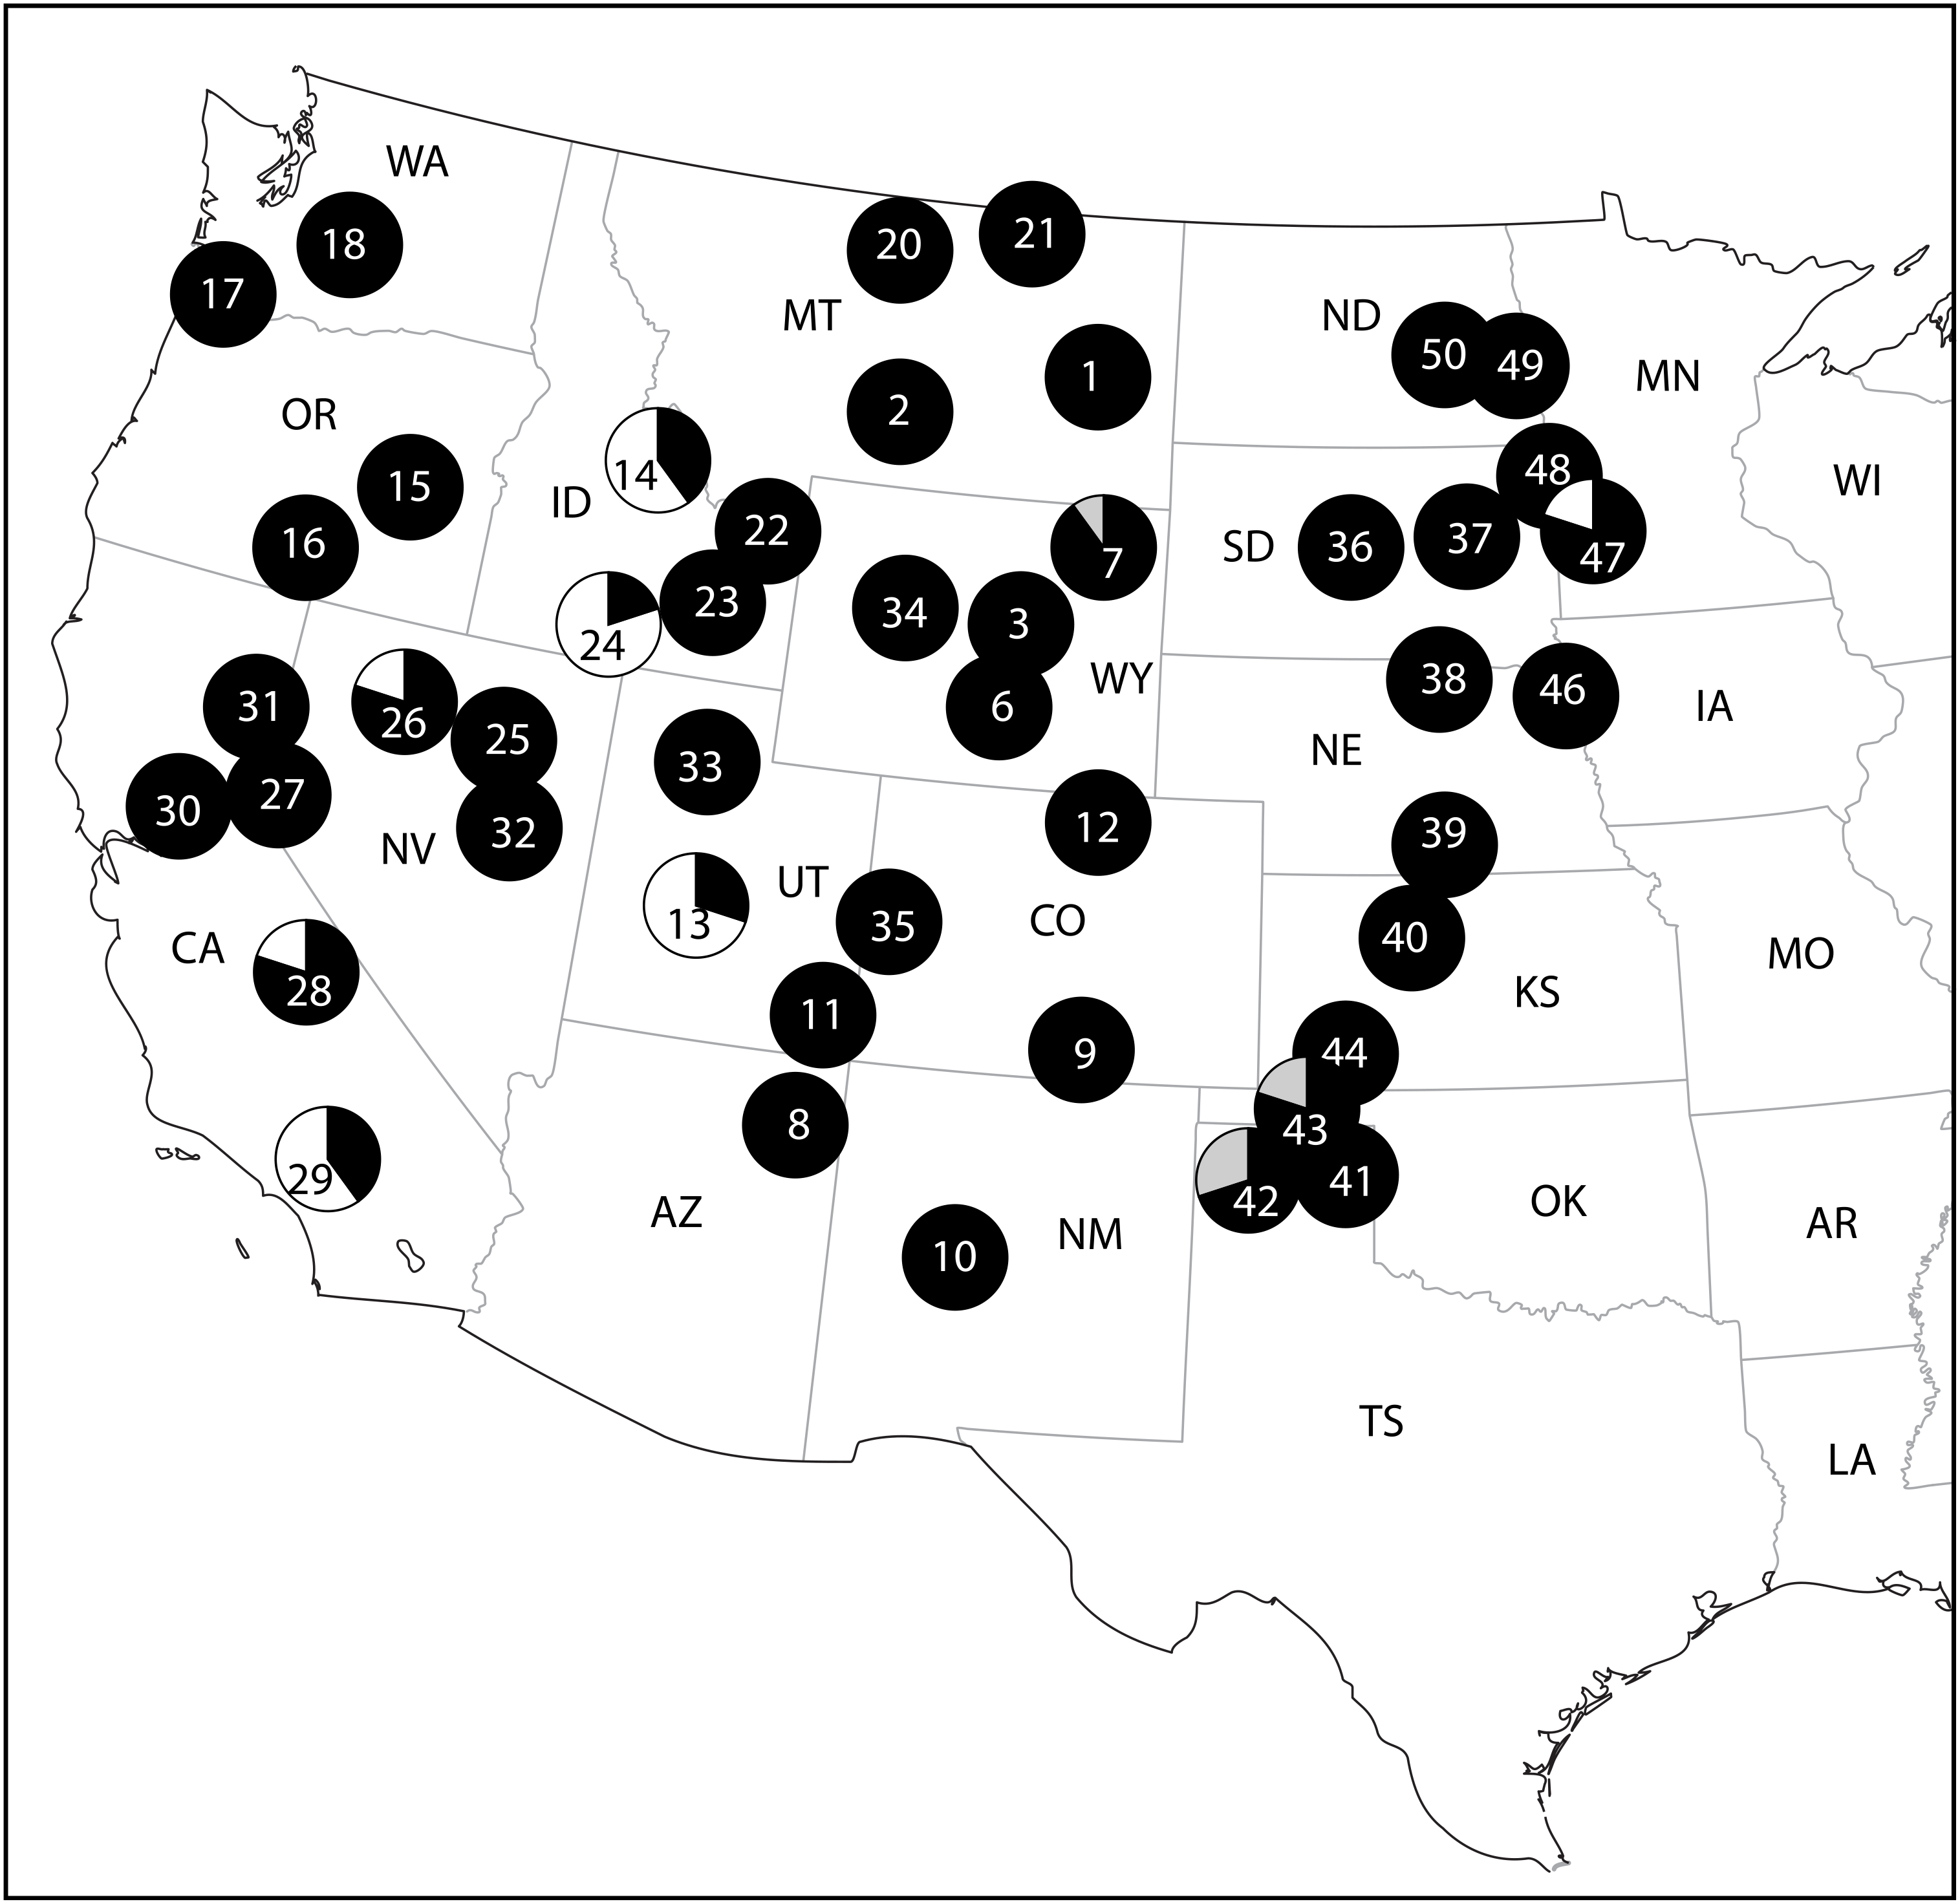
Map of collections of U.S. populations of Elaeagnus angustifolia. Each collection included 10 plants, population numbers are shown, and the colors of the circles indicate assignment of plants to one of three genetic clusters based on the results of the STRUCTURE analysis.

Genomic DNA was extracted from approximately 20 mg of silica-dried leaf material using a modified CTAB (hexadecyltrimethylammonium bromide) method (Hillis et al. Reference Hillis, Moritz and Mable1996). Eight cpDNA sequence regions were preliminarily surveyed from eight samples for variation. Seven of these regions could not be successfully sequenced (i.e., polynucleotide regions, unalignable gaps, or failed PCR), and these regions are listed in Supplementary Data File 2. The most variable region we could sequence successfully was the chloroplast intergenic region trnT-trnF (Taberlet et al. Reference Taberlet, Geilly, Pautou and Bouvet1991). Sequencing was performed as in Gaskin and Wilson (Reference Gaskin and Wilson2007) for 194 plants worldwide. This included 2 plants per each population that was included in the U.S. SSR analysis (92 plants), 14 plants from France, 22 plants from Asia, and 66 U.S. plants that were not from populations included in the SSR analysis but were from other locations (see Supplementary Data File 2) and only used in the cpDNA analysis. Sequences were aligned in MEGA (Tamura et al. Reference Tamura, Dudley, Nei and Kumar2007), and the haplotype network was constructed manually. We had originally started this study using only cpDNA data. We found limited variation in the trnT-trnF region in our preliminary cpDNA sequencing (mostly monotypic population data for five U.S. populations of 10 plants each [unpublished data] and only three haplotypes in the United States); we therefore decided that DNA sequencing was not an economical source of variable population data and switched to developing SSRs for E. angustifolia. Even though the cpDNA data were not useful at the population level, we decided to include them for just two samples per location (Supplementary Data File 2) but across a wide geographic range, giving us a view of maternal cpDNA lineage evolution above the population level, and relied on SSRs for U.S. population-level information. We amplified and scored 11 SSRs with the same amplification and analysis methods as in Gaskin et al. (Reference Gaskin, Hufbauer and Bogdanowicz2013a). For efficiency, we multiplexed the following groups of primers: (Ro20, Ro97, Ro 721, Ro887) (Ro325, Ro367, Ro833, Ro851), and (Ro218, Ro236, Ro749).
Tests of linkage disequilibrium for SSR loci were performed with Genepop v. 4.2 (Raymond and Roussett Reference Raymond and Rousset1995; Rousset Reference Rousset2008). Null allele frequency was tested in Cervus v. 3.0.7 (Kalinowski et al. Reference Kalinowski, Taper and Marshall2007). Percentage of loci that are polymorphic (PLP), alleles per locus (A) and per population (N A), private alleles per population (P A), genetic differentiation within and among populations (F ST), observed and expected heterozygosity (H O and H E), chi-square exact test of Hardy-Weinberg equilibrium (HWE), including excess or deficient heterozygosity if population is not in HWE, and analysis of molecular variance (AMOVA) were calculated in GeneAlEx (Peakall and Smouse Reference Peakall and Smouse2012). Isolation by distance was calculated in NTSYS v. 2.21c (Rohlf Reference Rohlf2009), comparing pairwise population geographic distance with F ST; significance of correlation (P < 0.05) was tested by using 1,000 random permutations.
Clustering and assignment tests were performed using the software STRUCTURE v. 2.3.3 (Falush et al. Reference Falush, Stephens and Pritchard2003, Reference Falush, Stephens and Pritchard2007; Pritchard et al. Reference Pritchard, Stephens and Donnelly2000, Reference Pritchard, Wen and Falush2007) on all 584 individuals in the SSR analysis (460 United States, 124 Eurasia). In determining the number of genetic clusters (K) represented in the SSR genotypes, no population or geographic information was included, admixture was assumed as possible, allelic frequencies were considered to be correlated in each population due to potential gene flow, and a 50,000-run burn-in (α stabilized at approximately 1,000 runs) and 100,000 run length were used. We tested for number of genetic clusters (K = 1 to 15) with 10 repetitions for each value of K. Selection of K from this output data was done with the criterion ΔK suggested by Evanno et al. (Reference Evanno, Regnaut and Goudet2005), and results were visualized in the software STRUCTURE HARVESTER Web v. 0.6.92 (Earl Reference Earl2012). To further test reliability of our results, we also assessed number of genetic clusters using the functions snapclust/snapclust.choose.k for Bayesian information criterion (BIC) and Akaike information criterion in the R package ‘adegenet’ (v. 2.1.1; Jombart Reference Jombart2008). We set max (clusters)=30, pop.ini=null, max.iter=150; remaining parameters were set to default values. While the Bayesian population analyses (e.g., STRUCTURE) are robust to the presence of null alleles, F ST estimates may be significantly overestimated in data sets with high frequencies of null alleles (Carlsson Reference Carlsson2008). Therefore, we analyzed F ST both with and without loci that had estimated null allele frequencies >0.10 and compared those results.
Results and Discussion
Molecular Markers
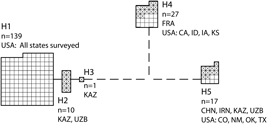
We found five haplotypes in the 833-bp chloroplast intergenic region trnT-trnF in 194 samples (Figure 2; Supplementary Data File 2). There were three haplotypes in the United States (H1, H4, H5). The most common U.S. haplotype was H1 (139/158 plants). H4 was an exact match between 13 U.S. and all 14 French plants. H5 was an exact match between six U.S. plants and 11 plants from Iran, Uzbekistan, and Kazakhstan. There was no exact match between the most common U.S. haplotype (H1) and plants from Eurasia, but H2 from Kazakhstan and Uzbekistan was the most similar at only one mutational step from H1. Haplotypes have been deposited in GenBank (accessions LC430928 to LC430932).
Elaeagnus angustifolia haplotype network for the 833-bp chloroplast intergenic region trnT-trnF for 194 plants from Eurasia and the United States. Crossed boxes indicate Eurasian plants; open boxes indicate U.S. plants. Bold outlines indicate haplotypes, and lines between haplotypes indicate single base substitutions. ISO codes indicate country and U.S. state.

A total of 106 alleles were detected among the 11 microsatellite loci from 584 U.S. and Eurasian plants. Alleles per locus (A) varied from 5 to 15. We observed missing data (no chromatogram peaks) in six instances (0.09% of data cells), indicating a low level of PCR failures. Three loci had null allele frequencies above 0.1 (Ro325, Ro833, Ro721). Linkage disequilibrium was detected in 3 out of 55 pairwise comparisons of loci (Ro218/Ro325, Ro887/Ro367, Ro887/Ro236).
SSR Genetic Diversity
The U.S. populations ranged from 45% to 100% polymorphic loci (mean PLP = 90%). Number of alleles per locus in each U.S. population (N A) ranged from 1.6 to 4.1 (mean = 3.1). Private alleles per U.S. population (P A) ranged from 0 to 6 (mean = 0.4), and private alleles were found in 10/46 U.S. populations. Observed and expected heterozygosity are reported for each U.S. population as well as when all U.S. plants are considered as one population (H O = 0.445 ± 0.013; H E = 0.454 ± 0.010). HWE was found in populations at 17/46 U.S. locations, and most U.S. populations not in HWE (23/29) had a significantly lower than expected number of heterozygotes (Table 1).
Population Structure
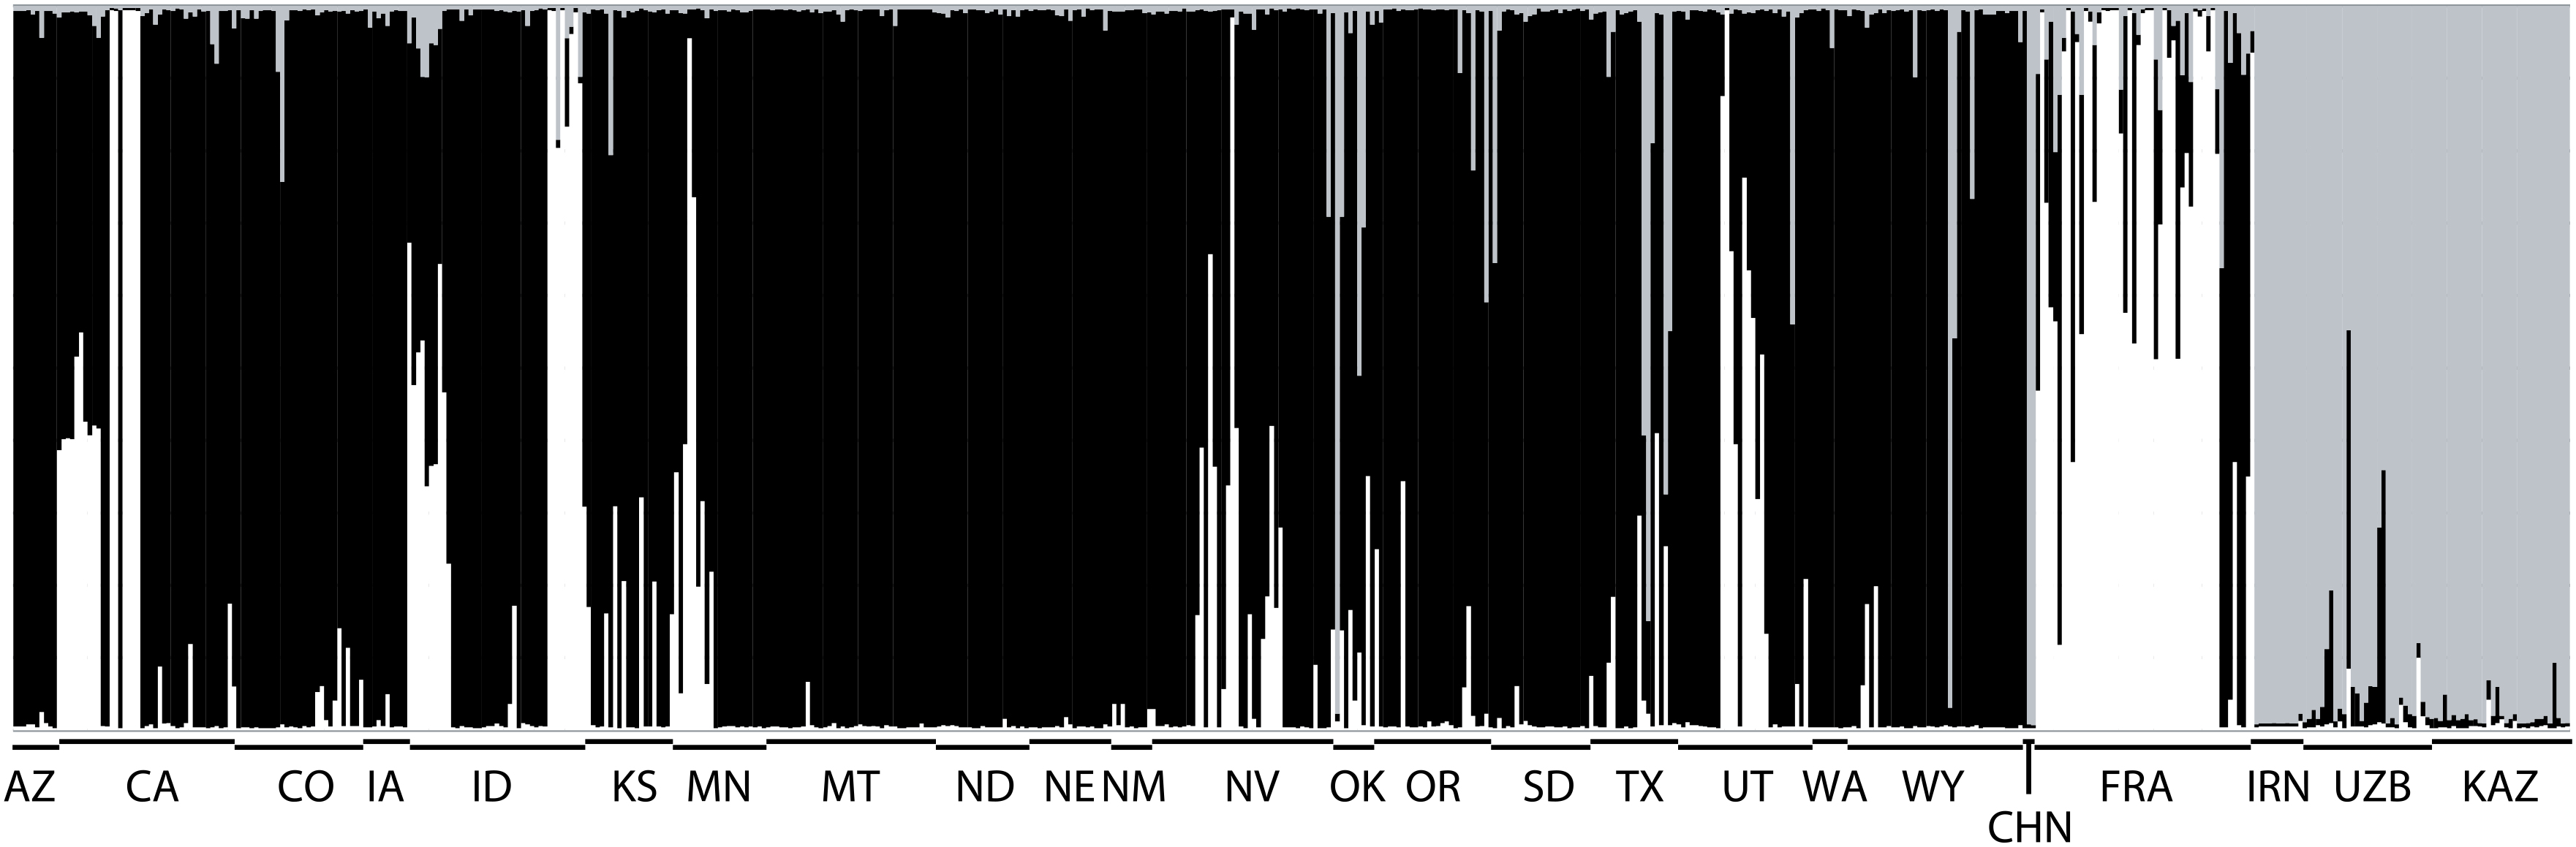
In the United States, 88% of the genetic variation was found within populations (AMOVA; P < 0.001). Without loci that exhibit null alleles (frequency > 0.10), 89% of the genetic variation was found within populations, and 11% among populations (P < 0.001). The Mantel test showed no correlation between genetic differentiation (F ST) and geographic distance between populations in the United States (r = 0.05, P = 0.18). STRUCTURE analysis determined that there are three clusters (K = 3) of SSR genotypes found in the E. angustifolia samples worldwide (Supplementary Figure 1), indicated by white, gray, and black in Figure 3 and referred to by those shades hereafter. Eurasian plants from France were predominantly assigned to the white cluster, while Asian plants were assigned mostly to the gray cluster (Figure 3). In the U.S. invasion, most plants were assigned to the black cluster, which has little representation in our Eurasian samples, though there were U.S. populations of mixed assignment (i.e., more than one color in a circle on Figure 1; Table 1). Populations with mixed assignment to the black and gray clusters were found in Texas, Oklahoma, and Wyoming (populations 7, 42, 43; Figure 1). Populations with mixed assignment to the black and white clusters were found in California, Nevada, Utah, Idaho, and Minnesota (populations 13, 14, 24, 26, 28, 29, 47; Figure 1). Mean assignment value for all U.S. and Eurasian plants was 92% for K = 3 (Supplementary Data File 3). STRUCTURE and snapclust showed a consensus of K = 3, but snapclust using BIC was able to find a clear inflection point (Supplementary Figure 2) suggesting that K = 3 through K = 6 did almost equally well at explaining patterns in the data. K = 3 and K = 6 both showed similar patterns of origins and which U.S. populations were most diverse, but at K = 6 we were also able to further parse the K = 3 black and white clusters into four clusters (red/green and orange/purple, respectively; Supplementary Figure 3). Similar to K = 3 clustering results from STRUCTURE reported earlier, at K = 6 we saw little connection between Eurasian and U.S. samples, except for the K = 3 U.S. populations that were mixed black/white assignment (populations 13, 14, 24, 26, 28, 29, 47); these populations still share cluster assignment with France in K = 6 (blue cluster in Supplementary Figures 3–5). Only populations 42 and 43 from Texas and Oklahoma have slight assignment to the K = 6 orange cluster that is dominant in Asia.
Bar charts show assignment levels of Elaeagnus angustifolia plants to the genotype clusters determined by STRUCTURE analysis (K = 3). Bar height within one column (there are 584 columns, one for each plant) can vary from 0% to 100% assignment value. Mixed colors within a column (plant) indicate assignment to multiple genotype clusters. ISO codes indicate country and U.S. state.

This is the first genetic survey of E. angustifolia across a wide geographic range. There have been site-level studies of native E. angustifolia plants in Iran and China using ISSRs and biochemical markers, respectively (Asadiar et al. Reference Asadiar, Rahmani and Siami2013; Wang et al. Reference Wang, Ruan, Huang, Xu and Yan2006). These studies focused on E. angustifolia as an ecologically and medicinally valued species in localized native ranges.
The presence of three DNA sequence haplotypes in the United States (H1, H4, H5), which were separated by 8 to 11 base substitutions, along with the K = 3 clusters of SSR genotypes, indicates that multiple lineages were introduced to the United States. Selected accessions from the K = 3 SSR clusters (black, gray, or white) may be used as a coarse-grained representation of the lineages present in the invasion, and some of these accessions are already being grown for host-specificity and efficacy tests at CABI Switzerland.
The U.S. populations with the top five values for each of the genetic diversity measurements (N A, P A, H O, and H E) are indicated by an asterisk in Table 1. These populations with the highest genetic diversity were usually (9 out of 14) assigned to two different genetic clusters (black and gray or black and white; Table 1; Figure 1). We suggest these specific populations would be useful as initial biological control–agent release sites, because there is a higher likelihood in genetically diverse populations of detecting variation in agent efficacy that may be due to plant genotype.
It is not known whether E. angustifolia is primarily outcrossing or selfing or some combination of both, though its showy and fragrant flowers (Katz and Shafroth Reference Katz and Shafroth2003) suggest that outcrossing is important. Our genetic data regarding observed versus expected heterozygosity give some insight into this topic and that of gene flow between populations. In general, when H O is the same as H E, the populations are thought to be at HWE, suggesting that mating is random rather than selfing and that there is little to no gene flow between populations. (The pattern in heterozygosity can arrive by other processes, such as no mutation, infinite population size, and no natural selection, which are being ignored here.) When we consider all U.S. plants as one population, the observed and expected heterozygosity are very similar (H O = 0.445 ± 0.013; H E = 0.454 ± 0.010), suggesting that the plants may be primarily outcrossing. The existence of private alleles in some populations suggests that there is not a high level of gene flow (via pollen, seed, or movement of whole trees) between these populations across the western United States. The moderate level of genetic differentiation (F ST = 0.11) indicates that some populations are genetically distinct from others, also suggesting that there is not a high level of gene flow across the invasion. Thus, any genetic differences between populations may persist over time, and for management, this means that there may be population-level genetic variation in response to control, and we should test biological control agents for efficacy on these different invasive lineages. In contrast, we found no evidence of isolation by geographic distance across the western United States. Thus, we cannot accurately predict which genotypes or lineages are present in ungenotyped populations or regions using our current data, as has been determined for some other invasive plant systems (e.g., rush skeletonweed [Chondrilla juncea L.] in the western United States; Gaskin et al. Reference Gaskin, Schwarzländer, Kinter, Smith and Novak2013b).
The widespread presence of cpDNA haplotype H1 compared with H4 and H5 and the predominance of the black SSR lineage suggest either that these genotype lineages were more commonly introduced (higher propagule pressure) or that they are more successful at invading, or some combination of both. This is unknowable without analyses over a time span, but managers should be aware of the predominance of the H1 and black SSR lineages, keeping in mind that other, rarer lineages do exist and might harbor variation that would affect control efficacy.
Source population locations of the invasion are a good place to search for coevolved, host-specific herbivores. We attempted to find the origins of our K = 3 U.S. genotype clusters and cpDNA haplotypes. Although our sampling in Eurasia was limited in number (n = 124) and scope (only five countries), we see an emerging pattern of plants in Asia being genetically distinct from plants in western Europe. In France, where the species is likely naturalized (CABI 2018), most populations are primarily assigned to the white cluster (Figure 3), which is rarely found in the United States. We did find one French population that is primarily assigned to the black cluster (population 57), as are most (36/46) of the U.S. populations (Figure 3). It is possible, and perhaps likely given the naturalization of this species across Europe, that the black cluster of the U.S. invasion was derived from European cultivars, and not directly from wild Asian populations. It may be useful to assess which organisms attack E. angustifolia in Europe, although naturalized European collections may not harbor herbivores and diseases, as these may have been lost when plants were imported from Asia. Asian populations are primarily assigned to the gray cluster, which is a rarer genotype cluster in the U.S. Our field experience and information from locals suggests that most of the trees in the native range are naturalized or cultivated, and the only wild native Asian trees that we collected were from Zerafshan, Uzbekistan, and these assign to the gray cluster. Clearly, we have not found the probable origin of U.S. plants assigned to the black cluster, and more collections need to be analyzed from Asia, especially from the proposed native range, in order to better understand Eurasian population structure and origins of U.S. plants. Alternatively, because most of the historical native range of E. angustifolia has likely been severely altered and the native genotypes extirpated and because this species has been in horticultural trade for centuries (Protopopova et al. Reference Protopopova, Shevera and Melnik2006), perhaps we will never find the true native wild plants but can only track the U.S. invasion back to Eurasian cultivars and naturalized plants.
In conclusion, we have now included accessions from the three U.S. genotype clusters (black, white, and gray; Figure 1) in prerelease host-specificity and efficacy testing of biological control agents. We also suggest that initial U.S. field releases of biological control agents include the georeferenced plant populations that we have identified as containing diverse mixes of genotypes and lineages in order to better monitor agent efficacy on different genotypes. This creates extra work for scientists and land managers working on the biological control releases, but increased testing on multiple diverse genotypes helps to ensure that biological control agents are effective across a genetically diverse invasion.
Author ORCIDs
John F. Gaskin, 0000-0001-7338-3880
Acknowledgments
Support for KRG was provided by the U.S. Geological Survey, Invasive Species Program. Thanks to K. Mann and J. Lassey of USDA-ARS Sidney, Montana, for generating genetic data. Funding was supplied in part by the U.S. Department of the Interior Bureau of Land Management Montana-Dakotas State Office. US and PW were supported by CABI, with core financial support from its member countries (for details, see http://www.cabi.org/about-cabi/who-we-work-with/key-donors), and by the Wyoming Biological Control Steering Committee and Montana Weed Trust Fund, through Montana State University. No conflicts of interest have been declared.
Supplementary material
To view supplementary material for this article, please visit https://doi.org/10.1017/inp.2019.16