Introduction
During external beam radiotherapy of the prostate, interfractional motion occurs due to changes in patient shape, patient positioning and internal organ motion, making the daily delivery of a uniform radiation dose to the treatment volume challenging.Reference Langen and Jones1 Interfractional motions such as variations in bladder and rectum volume have been demonstrated to have significant effects on prostate position and a negative impact on the accuracy of the treatment course.Reference Ciernik, Baumert, Egli, Glanzmann and Ltolf2
The implementation of image-guided radiation therapy in clinical practice, such as kilovoltage cone beam computed tomography (kV-CBCT) which is integrated in linear accelerators, allows the possibility of imaging the patient in the treatment position, either before or after each treatment in three dimensions with sufficient soft tissue contrast.Reference Jaffray, Siewerdsen, Wong and Martinez3
Despite the image quality improvements, CBCT still has more scatter compared with a conventional computed tomography (CT) (fan beam) due to its cone beam geometry, and this scatter depends on the scanned object size and collimator and filter used.Reference Stock, Pasler, Birkfellner, Homolka, Poetter and Georg4 In addition, limited gantry rotation speed and large field-of-view (FOV) in a single rotation worsen image quality. The image quality also depends on acquisition parameters—that is, mA, kV and the number of projections. Therefore, CBCT images provide inaccurate Hounsfield units (HUs) and, consequently, cannot be used directly for dose calculation. This means that, currently, acquiring a new ‘planning’ computed tomography (pCT) scan is necessary for accurate assessment of dose differences (DD). However, this is resource intensive and time-consuming, involving re-outlining structures in the new scan and copying the original plan onto the new scan to obtain dose–volume histogram (DVH) information, thus entailing additional dose to the patient. Many papers have studied the use of CBCT data for dose recalculation, which is still an active area for research.Reference Fotina, Hopfgartner, Stock, Steininger, Ltgendorf-Caucig and Georg5 The majority of these studies deal with adjustment techniques to correct CBCT HU values, such as mapping the HUs in CT images to the equivalent points in the CBCT image geometry after rigid registration.Reference van Zijtveld, Dirkx and Heijmen6–Reference Richter, Hu and Steglich8 In addition, image cumulative histograms can be used to adjust HU values between pCT and CBCT images.Reference Fotina, Hopfgartner, Stock, Steininger, Ltgendorf-Caucig and Georg5, Reference van Zijtveld, Dirkx and Heijmen6 Another technique uses a multilevel threshold (MLT) algorithm as proposed by Boggula et al.,Reference Boggula, Wertz and Lorenz9 where the pixel values of CBCT images were replaced with a small number of fixed HU values as in CT for air, soft tissue and bone.Reference Boggula, Wertz and Lorenz9–Reference Onozato, Kadoya and Fujita11 In addition, Fotina et al.Reference Fotina, Hopfgartner, Stock, Steininger, Ltgendorf-Caucig and Georg5 used the same technique, calling it a density override technique, but with a range of HU values for bone (soft bony structures, hard bone and teeth) and air/low-density regions (rectal balloon and lung). All other regions are assumed to be water equivalent assigned with 1 HU value. In this work, the MLT algorithm has been used to categorise pixel values into segments on a region-by-region basis and the region size changes depending on the anatomical features. Thus, the considerations of the variation in HU with position in the CBCT have been taken into account. Furthermore, the benefit of a larger number of materials has been explored.
Further novelty in this study is the use of Monte Carlo (MC) modelling in order to separate uncertainties in the dose calculation inherent in the treatment planning system, including those due to the influence of the titanium implant, from uncertainties introduced by the threshold method.
Method and Materials
CBCT image acquisition
The X-ray volumetric imaging integrated in an Elekta Synergy linear accelerator (XVITM, version 4·5; Elekta, Crawley, West Sussex, UK) was used to acquire CBCT images. The CBCT scans were acquired with an FOV (medium FOV) of 41 cm in diameter and 20·5 cm in the axial direction with a bowtie filter added (F1). The images were then transferred to the Oncentra MasterPlan (OMP) treatment planning system (version 4·3; Elekta, The Netherlands) via DICOM protocol for dose calculation.
Treatment planning system and pCT
Anthropomorphic phantom study
A male pelvis phantom was built using the multiblock phantom that was designed by Seaby et al.Reference Seaby, Thomas, Ryde, Ley and Holmes12 The blocks length is 30 cm with a square or right angle triangle cross-section with sides of 4 cm. The blocks are made of two materials as follows: WT1 for water (tissue equivalent) and IB7 for bone as shown in Figure 1. The pCT images of the phantom were acquired using a Philips Brilliance Big Bore CT scanner (version 2·3; Philips Medical Systems, Cleveland, OH, USA). Structures were drawn in the pCT to represent planning target volume (PTV), rectum and bladder. A field-in-field (FIF) plan with six 6-MV photon fields, at gantry angles of 0, 90 and 270° was performed using the OMP. The prescription dose was 74 Gy in 37 fractions. The OMP supports two types of algorithm to calculate dose distribution such as collapsed cone (CC) and pencil beam (PB) algorithms, both were used in this study for dose calculations.
Multiblock phantom scan using (a) cone beam computed tomography (CBCT) and (c) planning computed tomography and the resultant image after segmenting CBCT (b).

Patient study
This study was performed on a prostate cancer patient with a metallic prosthetic right hip replacement treated at the Department of Clinical Oncology and Radiotherapy, ABM University Health Board, Swansea, Wales. This case provides a good assessment of dose calculation using CBCT due to the difficulties presented by the metal artefacts in both pCT and CBCT images (see modification of CBCT images section). The artefacts in pCT were reassigned as water in the original patient plan using a bulk density correction. An intensity-modulated radiotherapy (IMRT) plan with five 6-MV photon fields, at gantry angles of 65, 110, 180, 225 and 325° was performed. The prescription dose was 74 Gy in 37 fractions. Dose distribution was calculated using PB and CC algorithms.
Modification of CBCT images
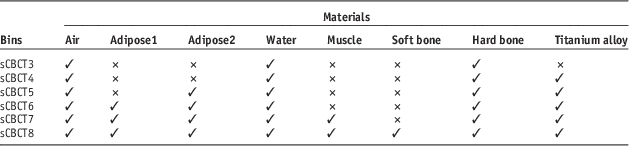
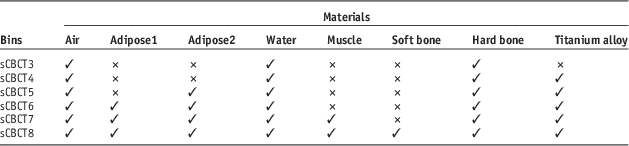
As the CBCT images contain more scatter than a conventional CT system, the CBCT HU to electron density (ED) calibration used for dose calculation is more complex, as it can vary with position and with the presence of metallic implants. The MLT algorithm involves categorising pixel values in the CBCT images into segments of homogeneous HU using MATLAB scripts (Mathworks, Natick, MA, USA) to generate segmented CBCT (sCBCT) data. For the phantom case, only two bins, where a bin is a region of a uniform HU value, were considered (sCBCT2) that represent water and hard bone. For the patient case, there is a range of soft tissue types and different materials densities, thus more bins are needed to take into account this variation. Therefore, the maximum number of bins used in this study was eight bins, sCBCT8, that represent air (−976 HU), two adipose tissues (−135 and −96 HU), water (0 HU), muscle (48 HU), soft bone (200 HU), hard bone (600 HU) and metal implants (2,976 HU) (see Table 1). Then the soft bone bin was excluded and considered as hard bone in sCBCT7 and sCBCT6 excluded the muscle bin and considered it as water. In sCBCT5, the adipose1 bin was excluded and considered as adipose2, whereas sCBCT4 excluded both adipose bins. The minimum number of bins used was three bins, sCBCT3, that represent air, water and hard bone, which are the main materials in the pelvis region. The combination of different bins in each sCBCT was chosen to create a realistic balance between the main three materials. The range of pixel values in the CBCT images were as follows: air (0–200), adipose tissue (201–600 and 601–700), water (701–800), muscle (801–875), soft bone (876–1,000), hard bone (1,001–1,600) and metal implant (1,601–8,000).
Number of bins used in segmented cone beam computed tomography (sCBCT)
The phantom materials are uniform and thus the effect of scatter in CBCT can be observed. However, one set of threshold values for each material of these intervals were broad enough to correct for scatter as well as ring artefacts, which occur due to uncorrected variations in detector defects and linearity. The method also corrected beam hardening artefacts that result in shading artefacts throughout the centre of the phantom as shown in Figure 1. For the patient case, the threshold values change geometrically as noise and scatter in CBCT is variable, dependent on position in the image, especially in the presence of high-density materials.Reference Pineda, Siewerdsen and Tward13Figures 2a and 2c show two different slices and different locations of the original CBCT images. Figure 2b shows the segmentation of the pixel values using specific threshold values, which can correct ring artefacts. These values are valid even in high-density regions. On the other hand, in the presence of the hip prosthesis (higher density region), these threshold values are no longer valid and would overestimate the HU values around that region due to the increased amount of X-ray scatter and beam hardening resulting in two forms of artefact, cupping or dark shading, and streaks as shown in Figure 2d. The artefacts affect the pixel values and therefore affect the segmentation compared with the pCT image (Figure 2e). This means that the CBCT data should be divided into regions with sets of different threshold values, which are determined on a region-by-region basis, and should be applied to these regions to accurately correct for the artefacts, as shown in Figure 2f. In general, the greater the variation in the scatter the greater the number of regions that need to be considered and the size of the region decreases as it gets closer to inhomogeneities. Thus, threshold values were highly variable across the whole CBCT dataset in this study, particularly in the presence of the hip prosthesis.
Two different locations and slices of the original cone beam computed tomography (a and c) and the resultant images after segmentation using the same threshold values in only a part of the image (b and d, respectively). In particular it is observed in (d) that the artefacts in the vicinity of the metal are erroneously corrected. Variable threshold values were then used (f), which compared well with the original planning computed tomography image (e).
MC calculation
The Elekta Synergy linear accelerator was modelled using Electron Gamma Shower (EGSnrc), which is one of the most popular MC codes for medical physics.Reference Kawrakow and Rogers14 BEAMnrc and DOSXYZnrc are two applications in EGSnrc code that are used to simulate the beam generated from the treatment head and to score dose deposition in voxel grids, respectively. In this study, 90 million particles were used for each beam to provide an accurate simulation with a low statistical uncertainty. High-performance computing (HPC Wales) was used to speed up MC calculations.15 The MC normalisation was performed by calculating the dose in a water phantom under the standard reference conditions (10×10 field size, 100 cm source-to-surface distance, 5 cm depth).
Treatment planning evaluation and comparison
The sCBCT and pCT images were fused using ProSoma software (version 3·3; MedCom, Germany) and the structure sets were then transferred to the sCBCT images without any modification except the external contour for the patient case where there are some differences. The plans were then copied to sCBCT using the same geometry and MU values and doses were recalculated using PB and CC algorithms. For MC calculation, the pCT artefacts were changed to a water material of uniform density using a MATLAB script. The MC dose calculation was then performed on pCT and sCBCT images using the same HU-ED calibration as in OMP (Figure 3). The MC dose file (.3ddose) and the DICOM-RT file were then imported into the computational environment for radiotherapy research software to compare the resultant dose distribution.Reference Deasy, Blanco and Clark16 For both studies, DVH were compared between pCT and sCBCT plans. The maximum dose (D max), mean dose (D mean) and minimum dose (D min) parameters for PTV, rectum and bladder were compared. To quantitatively appraise the differences between pCT and sCBCT plans, especially for the PTV, rectum and bladder, a γ index analysis was performed using the pCT plan as a reference. The criteria were set as 3 mm distance to agreement and 3% DD and 5% low-dose threshold.Reference Nelms and Simon17 For the patient study only, the cross-plane profiles of pCT, sCBCT3 and sCBCT8 plans at the isocentre depth were compared and the conformity index (CI) was calculated for all sCBCT plans and then compared with the pCT plans using PB, CC and MC algorithms.18 In addition, the dose at the isocentre (at the geometric centre of the prostate PTV) was compared between the pCT and sCBCT plans and plotted against the operator time required for defining the threshold values for different regions. The more the variation of scatter the more regions need to be defined. Thus, the operator time increases as the number of anatomical materials involved increases.
The computed tomography (CT) ramp for the conversion of CT values to material type and densities used in Oncentra MasterPlan. The same ramp was used in Monte Carlo, the density and composition of the material used in this ramp were included in the PEGS4 cross-section data file.
Results and Discussion
Phantom study
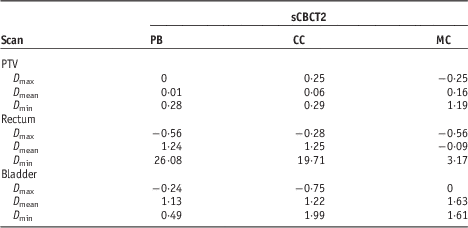
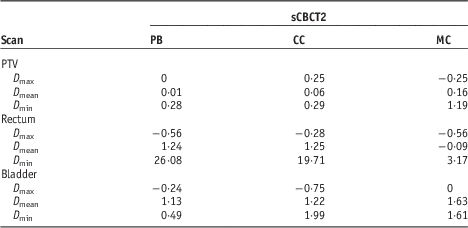
Figure 4 shows the DVH of a prostate FIF plan with a prescription dose of 74 Gy in 37 fractions. The sCBCT2 plan showed a good agreement with the pCT plan. In terms of PTV coverage, the DD in D mean between the pCT and sCBCT2 plans was 0·16% when using MC algorithm and the DD in D max was −0·25% and in D min was 1·1% (see Table A1 in the Appendix for PB and CC algorithm).
Dose–volume histograms comparison between planning computed tomography and segmented cone beam computed tomography (sCBCT2) field-in-field plans for planning target volume (PTV), rectum and bladder using Monte Carlo algorithm (prescription dose 74 Gy).
Figure 5 shows DD in D mean between pCT and sCBCT2 using PB, CC and MC algorithms. For PTV, the difference in D mean between pCT and sCBCT2 plans was 0·01, 0·06 and 0·1% using PB, CC and MC algorithm, respectively. The largest difference between pCT and sCBCT2 plans was for the bladder D mean, which was overestimated by sCBCT plan by 1·13, 1·2 and 1·6% using PB, CC and MC algorithm, respectively. γ evaluation showed that the percentage of points in the PTV, rectum and bladder with γ<1 (3%/3 mm) was 100% using all algorithms showing that two bins were enough to improve the dose accuracy for such a simple phantom.
Dose differences in mean dose between planning computed tomography and segmented cone beam computed tomography (sCBCT2) for planning target volume (PTV), bladder and rectum using pencil beam (PB), collapsed cone (CC) and Monte Carlo (MC) algorithms.
Patient study
Figure 6 shows the cross-plane profile×profile of pCT, sCBCT8 and sCBCT3 at the depth of the plan isocentre as well as the CT number of the pCT scan at that depth. Only sCBCT3 and sCBCT8 profiles were plotted to show the clear improvement in the match with the pCT profile when increasing from 3 to 8 values of HU. It can be seen that the sCBCT8 profile is in good agreement with the pCT profile compared with the sCBCT3 profile. The largest difference between the pCT and sCBCT8 plans was at the implant/tissue interface where sCBCT8 was 25·9 Gy and pCT was 29·1 Gy. This is due to the fact that the HUs in this region were affected by artefacts due to the presence of the metal. These artefacts were reassigned as water in the original patient plan using a bulk density correction, whereas sCBCT8 was segmented based on the actual HUs of pCT. On the other hand, the sCBCT3 profile overestimated the dose across the metal up to 3·96 Gy (50%). This is due to the fact that the sCBCT3 approach does not include the HU of metal and thus considers that region as hard bone.
Comparison of the dose profile of planning computed tomography (pCT), segmented cone beam computed tomography (sCBCT3) and sCBCT8 plans at the isocentre depth and the difference between sCBCT3/sCBCT8 and pCT using collapsed cone algorithm.
Figure 7 shows the DVH of a prostate IMRT plan with a prescription dose of 74 Gy. It shows the dose of sCBCT8, sCBCT5, sCBCT3 and pCT plans to the 95% volume of the PTV, rectum and bladder using the CC algorithm.
Dose–volume histograms comparison between planning computed tomography, segmented cone beam computed tomography (sCBCT8), sCBCT5 and sCBCT3 intensity-modulated radiation therapy plans for planning target volume (PTV95), rectum and bladder using collapsed cone algorithm.
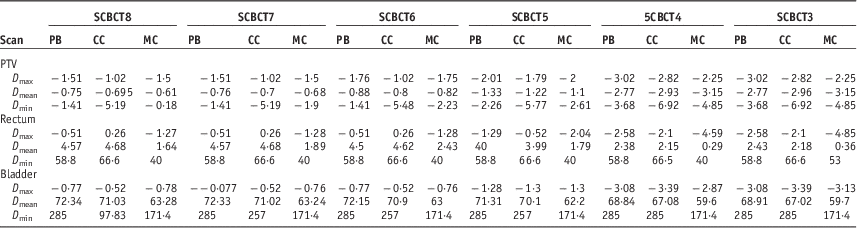
In terms of PTV coverage, the lowest difference between the pCT and sCBCT plans was achieved by the sCBCT8 plan while the largest difference was obtained by the sCBCT3 plan, which provided less anatomical materials compared with sCBCT8. The results showed that the differences between CT and sCBCT increased as the number of bins decreased (see Table A2 in the Appendix). It is worth mentioning that there are some differences in the bladder and rectal volume between the pCT and CBCT scans. The bladder volume, for example, is significantly reduced in the CBCT scan (>25% reduction). Therefore, the differences are not directly comparable indicating that deformable image registration (DIR) was needed rather than rigid image registration to correct for organ deformation between pCT and CBCT. Currently, only rigid image registration is available for clinical use. In addition, deforming the pCT to match the CBCT anatomy so that the original HU are copied onto the CBCT could be used as a benchmark for the study. Yang et al.Reference Yang, Schreibmann, Li, Wang and Xing7 used deformable ED mapping on CBCT images and reported that the DD between pCT and CBCT was within 2% in three prostate patients. More recently, Onozato et al.Reference Onozato, Kadoya and Fujita11 used the MLT algorithm as well as DIR on CBCT images of ten prostate patients and achieved better accuracy (<1%). For some patients, the accuracy was not improved mainly due to the large artefacts from gold fiducial markers and bowel gas in CBCT images, which could have been corrected if the threshold values were changeable geometrically. None of these studies used a patient with prosthesis.
Figure 8a shows the γ agreement index for the calculation points falling inside the PTV, rectum and bladder for different bins, showing the fraction of points resulting with γ<1. In general, as the number of bins decreased the number of calculation points which passed (γ<1) decreased slightly at first and then significantly when moving from five to four bins for all algorithms. The number of points that passed remained almost unchanged when going from four to three bins except for the rectum region where it dropped from 0·68 to 0·22% when using PB and from 2 to 1·8% when using CC algorithm. For the PTV and bladder region, all the calculation points passed the γ test for five up to eight bins when using the PB algorithm, while using the CC algorithm, 0·89% showed γ>1 for the PTV, and 1·5% for the bladder, when using the same bins. When using MC, the number of calculation points that showed γ<1 decreased almost linearly as the number of bins decreased. It is worth mentioning that the PB algorithm in OMP calculates dose to water, whereas the CC algorithm calculates dose to medium as does the MC algorithm.Reference Knöös, Wieslander and Cozzi19 As MC and CC algorithms calculate dose to medium, the HU of the medium must be provided precisely. Therefore, the PB algorithm would be less sensitive than CC and MC for calculating the dose using different bins as shown in Figure 8. Thus, MC and CC algorithms minimised uncertainty related to the dose calculation as well as identifying those introduced by different bins.
(a) Summary of the γ index with fixed distance to agreement=3 mm and dose differences=3% for the calculation points falling inside the planning target volume (PTV), rectum and bladder, showing the fraction of points resulting with γ<1. (b) Conformity index (CI) comparison between planning computed tomography and segmented cone beam computed tomography (sCBCT) plans using pencil beam (PB), collapsed cone (CC) and Monte Carlo (MC) algorithms against number of bins.Abbreviation: γ AI, γ agreement index.
Figure 8b shows the CI values of the sCBCT plans and the difference compared with pCT using PB, CC and MC algorithms. In the figure the three horizontal lines indicate the CI value of the pCT plan using PB, CC and MC algorithm. The CI value was almost consistent when going from the sCBCT8 to the sCBCT7 plan using all algorithms. The most significant change in the CI value was found when moving from the sCBCT5 plan to the sCBCT4 plan, going from 0·979 to 0·879 when using the CC algorithm and from 0·93 to 0·761 when using the MC algorithm. As a result, it showed that going for less than five bins for such a case would cause a difference of at least 15% in the CI values compared with pCT.
Figure 9 shows the DD between pCT and sCBCT plans at the isocentre using all algorithms plotted against the operator time needed to segment each sCBCT bin. The sCBCT5 to sCBCT8 plans showed differences of less than −2% compared with the pCT plan when using the PB and CC algorithms, which is considered to be clinically acceptable. For the MC algorithm, only the sCBCT7 and sCBCT8 plans showed similar differences. It can be clearly seen that as the number of bins increased the operator time increased as shown in Figure 9. From sCBCT7 to sCBCT8, it required 50% more operator time to improve the accuracy by 0·01% when PB and CC algorithms were used for dose calculation and 0·05% when using MC algorithm. It required about 55% less time to improve the accuracy by 1·13, 1·26 and 1·45% using PB, CC and MC algorithms, respectively. Therefore, the five bins is the optimal level which balances between the accuracy of the calculation and the time required. This time would be greatly reduced with automation, which is currently being investigated, but there is likely to be a certain amount of operator intervention and the relative amount of operator time is likely to be dependent on the number of bin chosen. Furthermore, work has been begun to examine a patient with bilateral metal hip prostheses, where the operator time would be expected to be longer.
Dose comparison between planning computed tomography and segmented cone beam computed tomography plans at the isocentre against operator time using pencil beam (PB), collapsed cone (CC) and Monte Carlo (MC) algorithms.
Conclusion
The segmentation of CBCT images using the method in this study can be used for dose calculation. For a simple phantom, the result showed that 2 values of HU would be enough to provide a good dose accuracy. For a prostate patient with hip prosthesis, the optimal level of operator effort that balances between dose accuracy and calculation time was found when only 5 values of HU, which include air, adipose, water, hard bone and metal implant HU values, was used. Thus, this method is feasible for adaptive radiotherapy (ART), as an alternative to obtaining a new pCT and re-outlining the structures, which can take up to a day in a busy radiotherapy department.
Acknowledgements
The authors gratefully acknowledge the staff of the Department of Medical Physics and Clinical Engineering, ABMU for their assistance in this study. The Ministry of Higher Education of Saudi Arabia provided sponsorship for Turki Almatani.
Appendix
Dose and coverage differences between segmented cone beam computed tomography (sCBCT2) plan and planning computed tomography plan in percentage for the planning target volume (PTV), rectum and bladder using pencil beam (PB), collapsed cone (CC) and Monte Carlo (MC) algorithms for the phantom case
Dose and coverage differences between segmented cone beam computed tomography (sCBCT) plans and planning computed tomography plan in percentage for the planning target volume (PTV), rectum and bladder using pencil beam (PB), collapsed cone (CC) and Monte Carlo (MC) algorithms for the patient case