INTRODUCTION
The 2002 World Summit on Sustainable Development (WSSD) called for the establishment of a representative network of marine protected areas (MPAs) by 2012 to help restore degraded marine ecosystems and fish stocks to sustainable levels (WSSD 2002; Pita et al. Reference Pita, Pierce, Theodossiou and Macpherson2011), and there is growing support for zoning of marine activities in the context of ecosystem-based marine management (Charles Reference Charles2001).
The term ‘MPA’ describes a broad range of marine areas established for different conservation, societal and economic objectives with different degrees and forms of protection (Gubbay Reference Gubbay2004). The activities restricted or prohibited within MPAs depend on their compatibility with specific management objectives. MPAs may be small, established to protect or manage particular species, habitats or activities, through to large multiple-use parks with a range of social, economic and conservation objectives. An initial distinction between biodiversity and fisheries management objectives of MPAs (Hilborn et al. Reference Hilborn, Stokes, Maguire, Smith, Botsford, Mangel, Orensanz, Parma, Rice, Bell, Cochrane, Garcia, Hall, Kirkwood, Sainsbury, Stefansson and Walters2004) has rather given way to MPA proponents arguing that MPAs will meet both objectives (see for example Roberts & Hawkins Reference Roberts and Hawkins2000).
Potential MPA benefits include increased density, biomass and body size of target species, increased species diversity and greater habitat protection (Lester et al. Reference Lester, Halpern, Grorud-Colvert, Lubchenco, Ruttenberg, Gaines, Airamé and Warner2009). MPAs arguably benefit fisheries in adjacent waters through export of larvae, juveniles and adults (Roberts et al. Reference Roberts, Bohnsack, Gell, Hawkins and Goodridge2001), reduce conflict among fishing sectors (Blyth et al. Reference Blyth, Kaiser, Edwards-Jones and Hart2002) and provide protection for traditional fishing rights (Day Reference Day2002). However, realization of MPA benefits for fisheries depends on fish life history characteristics (Halpern & Warner Reference Halpern and Warner2002), species mobility (Russ & Alcala Reference Russ and Alcala1996), and existing levels and patterns of exploitation and protection (Botsford et al. Reference Botsford, Micheli and Hastings2003); inherent weaknesses in the evidence base for MPA benefits have been underplayed (Kaiser Reference Kaiser2005; Sweeting & Polunin Reference Sweeting and Polunin2005). In many cases benefits have been advocated despite being based on an uncertain understanding of fish ecology, the associated fisheries (Willis et al. Reference Willis, Millar and Babcock2003), the fishers involved (Kritzer Reference Kritzer2004) and the political arena in which they are implemented (Kaiser Reference Kaiser2005; Agardy et al. Reference Agardy, di Sciara and Christie2011). Poorly informed MPA establishment risks eroding the credibility of marine science's role in resource management (Agardy et al. Reference Agardy, Bridgewater, Crosby, Day, Dayton, Kenchington, Laffoley, McConney, Murray, Parks and Peau2003; Sale et al. Reference Sale, Cowen, Danilowicz, Jones, Kritzer, Lindeman, Planes, Polunin, Russ, Sadovy and Steneck2005; Agardy et al. Reference Agardy, di Sciara and Christie2011).
Empirical evidence of fisheries benefits of MPAs is largely based on habitat-specific (for example Horwood et al. Reference Horwood, Nichols and Milligan1998) or sedentary species (for example Beukers-Stewart et al. Reference Beukers-Stewart, Vause, Mosley, Rossetti and Brand2005); positive effects have also been recorded for habitat generalists in temperate no-take MPAs (for example snapper Pagrus auratus; Willis et al. Reference Willis, Millar and Babcock2003). No-take MPAs (also ‘marine reserves’, ‘no-take zones’ or ‘highly protected marine reserves’), in which all consumptive activities are prohibited, are the most restrictive type of MPA, but rare in European waters where restrictions on specific fishing activities or gears are the predominant focus (see Rogers Reference Rogers1997; Pastoors et al. Reference Pastoors, Rijnsdorp and Van Beek2000). The value of MPAs in more dynamic temperate environments with sedimentary substrata and mobile mixed fisheries (such as the North Sea) remains equivocal (Frank et al. Reference Frank, Shackell and Simon2000; Laurel & Bradbury Reference Laurel and Bradbury2006) and constitute a very different context from that in which most MPA science has developed (Caveen et al. Reference Caveen, Sweeting, Willis and Polunin2012).
The paucity of evidence for fishery benefits of temperate European MPAs needs to be addressed given industry resistance (Dayton et al. Reference Dayton, Sala, Tegner and Thrush2000) and commitments to implement MPAs for marine conservation (for example UK Marine and Coastal Access Act 2009) and rebuild fish stocks (see WSSD 2002). MPAs require clear objectives and assessment should focus on whether an area is achieving its objectives (Grafton et al. Reference Grafton, Kompas and Schneider2005). Limiting access to resources disrupts the socioeconomic structure of user communities with costs and benefits spread unequally among stakeholders depending on what activities are excluded. Displacement of fishing effort to habitats and stocks outside of MPAs, increased competition for space, loss of earnings as a consequence of increased fishing pressure, fishing in sub-optimal areas, and greater steaming distances and thus operating costs (Hutton et al. Reference Hutton, Mardle, Pascoe and Clark2004; Kaiser Reference Kaiser2005) may all adversely affect fishing communities making MPA success less likely (Hilborn et al. Reference Hilborn, Stokes, Maguire, Smith, Botsford, Mangel, Orensanz, Parma, Rice, Bell, Cochrane, Garcia, Hall, Kirkwood, Sainsbury, Stefansson and Walters2004; Hiddink et al. Reference Hiddink, Hutton, Jennings and Kaiser2006).
Research on social implications of fisheries exclusion and interactions between MPAs, fish and resource users remains sparse (Christie et al. Reference Christie, McCay, Miller, Lowe, White, Stoffle, Fluharty, McManus, Chuenpagdee, Pomeroy, Suman, Blount, Huppert, Eisma, Oracion, Lowry and Pollnac2003; Christie Reference Christie2011; Pita et al. Reference Pita, Pierce, Theodossiou and Macpherson2011). Ecological, social and economic data are needed to inform successful MPA development (WSSD 2002; Stead Reference Stead2005; De Young et al. Reference De Young, Charles and Hjort2008). This study helps to address this gap in understanding, using a case study of two prohibited trawling areas (PTAs) in the North Sea. It combines social (fishers’ perceptions), management (fishing effort and compliance) and ecological (fish abundance and size) data to assess the PTAs against their primary societal objective of conflict resolution and secondary ecological objective of stock protection.
METHODS
Study area
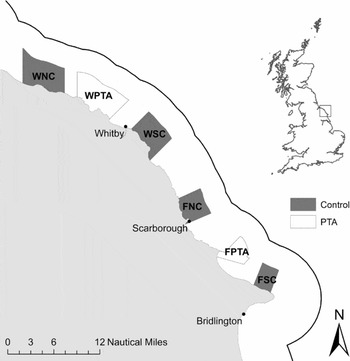
Two prohibited trawling areas (PTAs) at Whitby (WPTA, 67.8 km2) and Filey (FPTA, 27.5 km2) on the north east coast of England (UK) were established through a local bye-law of the North Eastern Inshore Fisheries and Conservation Authority (NE) (previously North Eastern Sea Fisheries Committee) (Fig. 1). The WPTA and FPTA were established >80 years ago as part of a wider ban on trawling to address increasing conflict between static (initially long-lining) and mobile (trawling) gear sectors, and prevent damage from trawling activity to static fishing gear, inshore fishing grounds and stocks (Rogers Reference Rogers1997; Traves Reference Traves2006).
Location of the Whitby (WPTA) and Filey (FPTA) prohibited trawling areas and associated control sites (Whitby north control = WNC, Whitby south control = WSC, Filey north control = FNC, and Filey south control = FSC) within the North Eastern Inshore Fisheries and Conservation Authority district (Yorkshire coast, UK); the solid line marks the 6 nautical mile seaward boundary of the district.

Fishers' perceptions
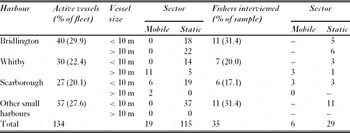
We surveyed perceptions of full-time skippers of fishing vessels holding a NE permit (trawling or shellfish) operating from harbours in close proximity (< 10 km) to the PTAs. Vessel lists were corroborated by crosschecking with fishers at each harbour. Face-to-face semi-structured interviews were conducted between September 2007 and April 2008 following a random stratified sampling strategy based on sector (static or mobile) and harbour. Opportunistic and ‘snowball’ (Goodman Reference Goodman1961) sampling of fishers was also undertaken, and composition of the sample was checked against the vessel list throughout the study to ensure that the interview population reflected the total population (Table 1).
Full time fishing vessels (2007) by sector and size, and fishers interviewed (2008) at the key harbours of Bridlington, Whitby and Scarborough and other smaller harbours combined (Withersea, Easington, Filey, Flamborough North and South Landings, Staithes, South Gare, Redcar and Marske).

Fishers were given a brief introduction to the project and assured anonymity of results on the basis that no response would specifically be linked to fishers or vessels. The questionnaire examined fishers’ perceptions of (1) PTA objectives and success in achieving its stated objectives; (2) inter- and intra-sector conflict; and (3) fisher and fish stock benefits from the PTAs (see Appendix 1, see supplementary material at Journals.cambridge.org/ENC). The questionnaire included a combination of dichotomous, open-answer and Likert-type statements.
Fishing effort and compliance
Satellite-based vessel monitoring system (VMS) data from 2007, provided by the Marine and Fisheries Agency (MFA, known as the Marine Management Organisation since April 2010), were used to estimate trawling effort in proximity to the PTAs. We estimated fishing effort based on positional (point) VMS data classified as otter trawling, using a geographic information system (GIS) ArcGIS v.9.2 (ESRI, USA) and Hawth's Analysis Tools for ArcGIS v.9 (Beyer Reference Beyer2004). Following Mills et al. (Reference Mills, Townsend, Jennings, Eastwood and Houghton2007) and Woolmer (Reference Woolmer2009), we calculated the spatial and temporal distribution of trawling effort based on 1-km2 grid cells, which we deemed appropriate to the size of the PTAs.
Fishing behaviour rules were developed to discriminate trawling and steaming activity by identifying the lower and upper trawling speed limits using speed frequency distributions (see Mills et al. Reference Mills, Townsend, Jennings, Eastwood and Houghton2007). A speed frequency distribution indicated vessels were trawling at speeds of 2–3 knots (verified by data from interviews; H.J. Bloomfield, unpublished data 2008). We estimated the temporal and spatial distribution of trawling effort by summing the number of trawling (2–3 knots) vessel positions per 1-km2 cell. Fishing effort was used as a proxy for non-compliance with PTA regulations.
Fish abundance and size
We sampled the WPTA and FPTA, and four control areas not subject to trawling restrictions, one to the north and one to the south of each PTA (Whitby north control = WNC, Whitby south control = WSC, Filey north control = FNC, and Filey south control = FSC) (Fig. 1). The control areas were comparable to each of the PTAs in terms of size, habitat composition, bathymetry and oceanography, and were located at least 3 km (1.6 nautical miles) from PTA boundaries to reduce any potential spillover influence of the PTAs. Detailed habitat information was not available prior to sampling for the majority of the study area, therefore basic habitat distributions (hard and soft ground) were obtained using local knowledge of ex-fishers, which were later found to be similar to survey data (Polunin et al. Reference Polunin, Bloomfield, Sweeting and McCandless2009).
Sampling of fish was conducted from the fisheries patrol vessel North Eastern Guardian III using baited video (BV) and baited traps (BTs). BTs were modified Norwegian pattern fish traps (Hooks and Lines Co., Waterford, Ireland and Medley Pots, Yorkshire, UK) 1.3 m long, 0.8 m wide and 1.2 m high. These were made of 20 mm square mesh and consisted of a bottom parlour (60 cm high), with one nylon monofilament entrance (15×15 cm) and a central bait bag, connected to a top parlour (60 cm high) to retain fish. Bait was a mix of chopped mackerel (Scomber scombrus), squid (Loligo sp.), and a sponge soaked in pilchard (Sardina pilchardus) oil. Steel supports were attached to the bottom parlour frame to prevent trap collapse under strong tidal conditions.
BV used hard drive high definition digital video cameras (Sony HDR-SR5 or HDR-SR12, Shasonic, Newcastle-upon-Tyne, UK) mounted in underwater housings (StingrayHD model, Light and Motion, Monterey, CA, USA) protected in double length lobster pot frames. In contrast to other studies (see Stobart et al. Reference Stobart, García-Charton, Espejo, Rochel, Goñi, Reñones, Herrero, Crec'hriou, Polti, Marcos, Planes and Pérez-Ruzafa2007), low light conditions (even in shallow waters) required illumination which was provided by a 24W HID torch (Darkbuster, Taran Microsystems Ltd, Basingstoke, UK) mounted at the top of the frame above the camera and angled slightly downwards. Bait was positioned at the opposite end of the pot, 60 cm from the camera lens; BV bait was identical to BT bait. This horizontal viewing set-up increased the stability and ruggedness of the gear, which allowed gear to be left unattended. The camera viewing angle was 65°, and we derived data from inside the pot space, with the pot frame used as a guide.
We undertook sampling in June–September 2008 (summer) and January–March 2009 (winter) and followed a stratified random design. Sampling points were located within three depth contours (10–20 m, 20–30 m and ≥ 30 m) within each area (PTA, NC, SC; Whitby and Filey) by random generation of decimal latitude and longitude (to the nearest 0.1°). Replication per depth per location was gear dependent (BT = 4, BV = 8). To limit tidally-induced variation, we only sampled during neap tides. BV units were deployed for up to 3 h, although analysis was restricted to the first 90 min of video footage. We deployed BTs overnight for c. 12 h and recorded soak duration. For each deployment, we classified habitat as hard or soft ground, as determined by echogram characteristics of the 38 kHz seabed acoustic return (SIMRAD EK500, SIMARD, Norway).
Statistical analysis
We analysed fish abundance data independently for each gear type due to differences in the way in which data were generated; BT analyses were based on Ntot, the total number of fish caught per deployment, and BV analyses were based on Nmax, the maximum number of fish within view in any one sequence, to avoid repeated counts of the same fish (also referred to as MaxN; see Willis & Babcock Reference Willis and Babcock2000).
We investigated the influence of location, depth, habitat, season and fishing effort on fish abundance (Nmax and Ntot) using log linear generalized linear models. We assigned fishing effort based on the fishing effort estimated from VMS data allocated to the 1-km2 cell in which a particular deployment was located. We also included the influence of soak time on Ntot in the BT analysis. We constructed separate models for each PTA and associated control sites because sites differed in their data distributions. Negative binomial distributions were assumed where data were found to be over dispersed. The BV data from Whitby contained an excess of zero counts, so we used a negative binomial hurdle model to model the zeros as a binomial distribution (Zuur et al. Reference Zuur, Ieno, Walker, Saveliev and Smith2009; Jackman Reference Jackman2011). We dropped non-significant explanatory variables from the model until a parsimonious model was found. In each case, we assessed the final model fit by Akaike Information Criterion (AIC) and residuals and fitted values were examined.
We used mixed effect models to investigate the size distribution of whiting (Merlangius merlangus; the dominant species) across sites, where deployment was nested in location as a random effect. The initial full model included protection, soak time, season, habitat and depth as covariates. Models were fitted using the nmle (Pinheiro et al. Reference Pinheiro, Bates, DebRoy and Sarkar2011) and pscl (Jackman Reference Jackman2011) libraries of the statistical software R (R Development Core team 2011).
RESULTS
Fishers' perceptions
All fishers interviewed said they were aware of trawling restrictions within the NE district and were most likely to name the PTA located closest to their home harbour (χ2 = 14.951, df = 4, p = 0.005; n = 35). The most frequent response of fishers (52.8%) was that the PTAs had been introduced to protect stocks, specifically lobster, shellfish and finfish, and breeding areas. The second most frequent response was that PTAs had been introduced to protect inshore static gear (38.9%). A majority of fishers (53.8%) thought that the PTAs were achieving their objective in relation to the protection of lobster stocks, breeding grounds and static gear. However, 23.1% of fishers did not think that the PTAs were achieving their objectives; this perception was commonly attributed to on-going trawling in the PTAs, with WPTA identified as experiencing a higher level of non-compliance. The remaining fishers (18.6%) echoed this perception, stating that the PTAs provided some protection for stocks and inshore fishers, but that PTA success was being compromised by on-going, albeit infrequent, trawling activity.
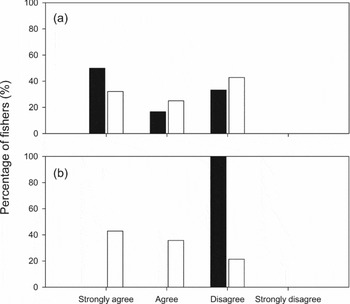
Static and mobile sector fishers did not differ in their responses to a statement regarding inter-sector conflict (Fig. 2 a; p = 0.732 Fisher's exact test). The majority of both static (55.1%) and mobile (66.6%) sector fishers indicated that they had experienced inter-sector conflict. Inter-sector conflict perceived by the static sector was commonly qualified as historical, with frequency reduced latterly due to the decline in the trawling fleet. Some static sector fishers said they had a good relationship with mobile sector fishers and that they informed local mobile sector fishers of the location of their pots in order to limit damage to both parties’ fishing gears. A significantly higher proportion of static sector fishers indicated that they had experienced intra-sector conflict compared to those operating within the mobile sector (Fig. 2 b; p = 0.002 Fisher's exact test). This perceived conflict within the static sector was most frequently voiced by skippers of small inshore vessels (< 10 m), who claimed that larger static gear vessels (> 10 m), which had more (and larger) pots, presented operational and safety issues for the smaller vessels.
Fishers' responses to perception statements (a) ‘I have experienced conflict with fishers from another sector’ and (b) ‘I have experienced conflict with fishers from the same sector’; black = mobile gear fishers (n = 6); white = static gear fishers (n = 28).

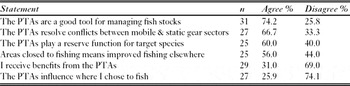
In general, there was a positive view of the role of the PTAs in managing and protecting fish stocks, and resolving conflict between static and mobile sectors (Table 2). The majority of the static sector agreed that the PTAs resolved conflicts; again there was a perception of a reduction in inter-sector conflict over time due to the decline in the trawling fleet. The majority of fishers thought the PTAs played a reserve function for target species, expressed as a build up of fish stocks inside the PTA boundaries, although fewer fishers were convinced that this improved fishing outside of the boundaries. Qualification of responses indicated a range of opinions on MPAs. One fisher commented that closing an area to fishing had to make a positive difference to fishing outside of the boundaries; others indicated that benefits may take time to accrue. Others highlighted potential impacts of fishing effort displacement and additional pressures on fish stocks (such as pollution and environmental change), and a perception that MPA stock benefits could not be guaranteed. Despite the generally positive perception of the value of the PTAs in conflict resolution, and for managing and protecting stocks, few fishers perceived that they personally received benefits from the PTAs and few indicated that the PTAs influenced where they fished (Table 2).
Summary of fishers’ responses to PTA perception statements ranked in order from highest agreement to lowest agreement (n = sample size).

Fishing effort and non-compliance
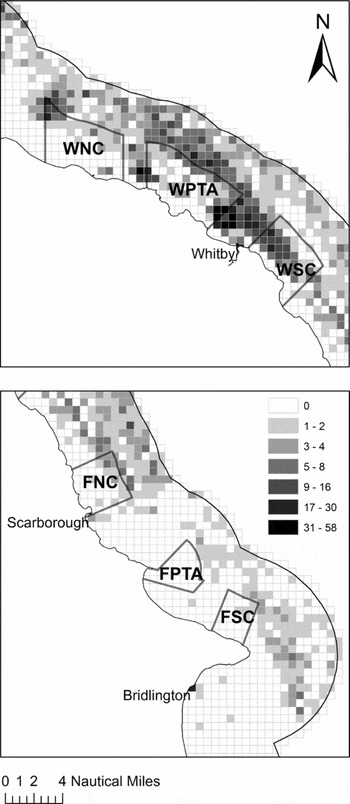
Trawling effort in 2007 was highly clustered within the NE district (Moran's Index I = 0.61, z = 50.81, p < 0.01; Fig. 3) ranging from 0 to 58 points per cell. There was a significant difference in the frequency of cells containing trawling effort between regions (χ2 = 36.182, df = 1, p < 0.001); the majority of cells (81.4%) within 5 km of the WPTA had trawling effort, compared to only c. 50% of cells in proximity of the FPTA. Intensity of trawling overall was greater in the Whitby region compared to that at Filey (H = 46.07, df = 1, p < 0.001). Trawling activity was apparent inside both PTAs; this was focused on the northern-eastern corner of the FPTA but occurred throughout the WPTA, and included a greater percentage of the area and greater frequency (Fig. 3).
Distribution of trawling effort based on Vessel Monitoring System (VMS) data in the (a) Whitby and (b) Filey regions in 2007. The scale indicates the frequency of trawling activity within each 1-km2 cell, calculated by summing the number of VMS points from vessels categorized as otter trawling with transmitted vessel speeds of 2–3 knots (indicative of trawling activity). (Abbreviations as in Figure 1.)

Fish abundance and size
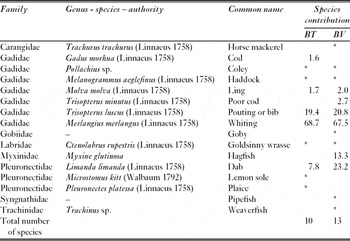
Ten fish species were recorded in BTs and 13 fish species in BV (Table 3). Both BT and BV catches were dominated by whiting (Merlangius merlangus; 68.7% and 67.5%, respectively).
Family, genus, species and common name of all fish (alphabetical by family) recorded by sampling gear and contribution to Ntot (baited trap; BT) or Nmax (baited video; BV) aggregated across seasons, locations and depths. (* indicates presence but contribution less than 1%).

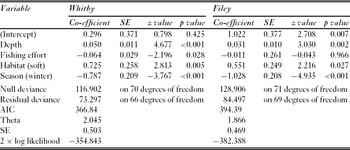
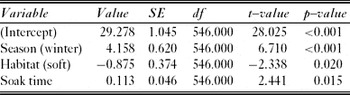
The most parsimonious negative binomial generalized linear model for BT data at Whitby indicated that depth, season, fishing effort and habitat were significant predictors of Ntot (Table 4). Location (WNC: z = -1.165, p = 0.24; WSC: z = 0.09, p = 0.927) and length of soak time (z = –0.219, p = 0.82) were not significant predictors of Ntot. Coefficients indicated that more fish were recorded at greater depths on hard ground in winter. At Filey there was some evidence of a location effect, where the FSC differed significantly (z = 2.216, p = 0.027) from the FPTA but FNC did not (z = –0.043, p = 0.966). Depth and season were important factors in this region (Table 4).
Parsimonious negative binomial generalized linear model of baited trap fish abundance data (Ntot) for Whitby and Filey.

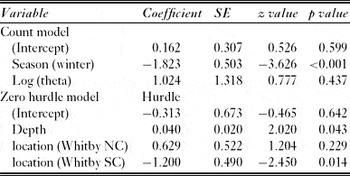
The distribution of Nmax from BV differed between Whitby and Filey. Whitby had a greater presence of zero observations and could not be modelled using a generalized linear model with a Poisson distribution. The negative binomial hurdle model, used to account for the zero counts, showed depth and location to be important in determining whether fish were observed (Table 5). Where fish were observed, season was found to be the best predictor of the number of fish observed. At Filey the distribution of zero observations was far fewer and the data were modelled using a generalized linear model with a Poisson distribution. Depth (z = 4.026, p < 0.001) and habitat (z = 3.955, p < 0.001) were found to be important predictors of Nmax. We found location (FNC: z = –0.475, p = 0.634; FSC: z = 0.520, p = 0.603) or season (z = –1.068, p = 0.286) had no effect on the model. Fishing effort improved the model fit, but the effect was not significant (z = –1.860, p = 0.063). There were no significant interactions between covariates.
Hurdle model of baited video fish abundance data (Nmax) at Whitby. Count component of the model was modelled with a truncated negative binomial distribution; the zero hurdle component was modelled with a binomial distribution with a log link. Theta count = 2.79, log-likelihood –140.6 on 7 degrees of freedom.

In the final mixed effects model with deployment nested within location as a random effect, season, habitat and soak time were all significant (Table 6). Protection, depth and fishing effort had no effect on the size of whiting caught; larger fish were more likely to be caught in winter on hard habitats when the soak duration was greater.
Mixed effects model fitted by maximum likelihood investigating whiting (Merlangius merlangus) size distribution in relation to time of year, location, protection and habitat covariates. Standardized within group variables: Min = –3.471, Q1 = -0.711, Med – 0.022, Q3 – 0.619, Max = 3.371. Number of observations = 555, number of groups = 6.

DISCUSSION
Empirical evidence for fisheries benefits from MPAs is dependent as much on socioeconomic considerations, such as compliance, and the nature of activities that are excluded, as on the ecological characteristics of protected species. If MPAs are to develop into the robust management tool envisaged, then multidisciplinary understanding is required to explore the linkages among social, economic and ecological facets, and robustly determine to what extent a given MPA is meeting its objective(s).
Do the PTAs protect static fishing gear and prevent inter-sector conflict?
Fishers perceived that the PTAs resolved conflicts between static and mobile gear sectors, despite VMS data indicating non-compliance with PTA regulations and fishers’ awareness of on-going, albeit reduced, trawling activity within the PTAs. Reduction in the trawling fleet is likely to have led to a reduction in inter-sector conflict more generally within the NE district. Marked increases in shellfish pots over the same period (H.J. Bloomfield, unpublished data 2010) may explain why static gear fishers more readily perceived intra-sector conflict, compared to their mobile gear counterparts.
The ability of the PTAs to provide protection to fishing gear and offer conflict resolution for an individual static gear fisher is dependent on whether or not the fisher perceives or experiences conflict. Inter-sector conflict was generally perceived to be historical, and the majority of static gear fishers interviewed indicated they were not affected by the PTAs because they were not located in areas where they fished. Thus, despite awareness among static gear fishers that some of their fleet benefited from PTAs through the protection of shellfish pots and stocks, few perceived benefits for themselves, suggesting that positive benefits of conflict resolution were spatially restricted.
Multiple-use MPAs like the PTAs have been advocated to manage conflicting activities (Bohnsack Reference Bohnsack1996) and are promoted for this purpose within the wider context of marine spatial planning (Gubbay Reference Gubbay2004). Zoning initiatives have been successfully implemented for conflict resolution in both the tropics (for example in the Great Barrier Reef Marine Park; Day Reference Day2002) and temperate regions (for example the Devon Inshore Potting Agreement; Blyth et al. Reference Blyth, Kaiser, Edwards-Jones and Hart2002). However, benefits from conflict resolution can be stakeholder specific and costs associated with the establishment of the MPA are frequently borne disproportionately among stakeholders depending on which activities are restricted (Holland Reference Holland2000). Benefits also depend on the distribution of activities and the placement of the MPA (such as proximity to harbours, and how far people can travel in terms of economics and safety). For example, although the exclusion of the trawl fleet from the Gulf of Castellammare reduced physical interaction among sectors within the MPA, it increased conflict outside the MPA where trawlers were displaced (Whitmarsh et al. Reference Whitmarsh, James, Pickering, Pipitone, Badalamenti and D'Anna2002).
Do the PTAs enhance mobile fish abundance or size?
There was no evidence that the PTAs enhanced mobile fish species abundances or size, although fish abundance was related to trawling effort. Non-compliance (Kritzer Reference Kritzer2004; Byers & Noonburg Reference Byers and Noonburg2007), coupled with declines in the trawling fleet in the region, serve to reduce the contrast in trawling effort between PTAs and control sites, and thus reduce potential protection effects. The VMS data indicated that non-compliance was more prevalent in WPTA and the contrast in effort between PTA and controls sites was lower at Filey; the greater contrast in Whitby is related to the greater numbers of trawling vessels operating from adjacent harbours.
Although significant, the power of trawling effort to explain fish abundance was low. Trawling effort is poorly defined by VMS data alone, particularly in inshore areas where small boats which are not subject to VMS legislation (< 15 m in 2007; EC [European Community] 2003) may exert significant effort (Woolmer Reference Woolmer2009). In the current study, a significant proportion of trawling vessels were < 15 m (NESFC [North Eastern Sea Fisheries Committee] 2008), while exploitation of whitefish stocks within PTA boundaries by static gear (nets and long-lines), predominantly by vessels < 15 m, is still permitted. Static and < 15 m trawling effort within the PTAs could not be estimated based on existing data (such as patrol sightings or over-flight data) due to poor spatial and temporal coverage. Obtaining such data may refine effort-based hypotheses further, particularly access to data on real-time compliance.
Despite assertions that MPA benefits are largely independent of MPA size (Halpern Reference Halpern2003), MPA effects on abundance, size and density of target species are strongest for site-attached species (Horwood et al. Reference Horwood, Nichols and Milligan1998). In contrast, the major target species off the north-east coast of England (such as cod, Gadus morhua, and whiting) often have dispersal distances of c. 100 km or more (Wright et al. Reference Wright, Neat, Gibb, Gibb and Thordarson2006). Given that optimum closure size increases with mobility (Laurel & Bradbury Reference Laurel and Bradbury2006; Le Quesne & Codling Reference Le Quesne and Codling2009), the potential PTA benefits for these species may be limited (Blyth-Skyrme et al. Reference Blyth-Skyrme, Kaiser, Hiddink, Edwards-Jones and Hart2006) and may have contributed to the absence of protection effects in this study. Similar soft sediment trawl exclusion zones have only exhibited positive effects for larger sites (> 200 km2) than the PTAs studied here (for example the Gulf of Castellammare; Pipitone et al. Reference Pipitone, Badalamenti, D'Anna and Patti2000). Benefits for fish stocks are unlikely to be realized unless a significant proportion of the stock remains resident within the PTAs (Roberts Reference Roberts1995) or the PTAs overlap with habitats and locations used during critical life history phases (such as spawning or juveniles phases; Caddy Reference Caddy2008), and the areas are subject to significantly reduced fishing effort compared to adjacent areas.
Consideration of null effects of protection on fish abundance
The absence of protection effects on fish abundance requires careful consideration, particularly given that bias exists in the scientific literature against publication of null results (Howard et al. Reference Howard, Hill, Maxwell, Baptista, Farias, Coelho, Coulter-Kern and Coulter-Kern2009). Measuring MPA effects on mobile fish is complex and null effects may stem, for example, from inherent limitations of sampling gears (Willis et al. Reference Willis, Millar and Babcock2000; Polunin et al. Reference Polunin, Bloomfield, Sweeting and McCandless2009), natural spatial and temporal variability of fish communities (Guidetti Reference Guidetti2002) or inadequacy of control sites. These methodological limitations are common and widely acknowledged. Studies such as this are critical to encourage debate on current approaches being used to evaluate MPAs and offer important advances into where improvements in current research on MPA impacts can be made.
Whilst the application of trawling as a survey gear is well established, trawling was not considered to be appropriate here due to potential negative impacts on habitats (Kaiser et al. Reference Kaiser, Collie, Hall, Jennings and Poiner2002), some ground being unsuitable for trawling (such as Filey Brigg; Allen Reference Allen2008), potential for conflict with excluded mobile gear users and damage to or operational limitations from static gear inside the boundaries of the PTAs. The use of baited static techniques limited the species sampled compared with both trammel netting (Polunin et al. Reference Polunin, Bloomfield, Sweeting and McCandless2009) and trawling (A.J. Caveen, personal communication 2011) and it is possible that other parts of the fish community could have demonstrated a response to the reduction in trawling effort even though whiting did not (for example plaice, Pleuronectes platessa; see Hiddink et al. Reference Hiddink, Johnson, Kingham and Hinz2011). The high natural spatial and temporal variability in fish abundance and the potential low numbers sampled using static gear also has consequences for the statistical power of any given sampling design and costs of adequate replication to detect MPA effects.
Finally, we also encountered problems identifying appropriate control areas. Habitat data and hydrodynamic data were either unavailable or of low resolution; furthermore, MPAs are often established at locations that contain special habitat features, rare species or areas of particularly high biomass, and are therefore unrepresentative of the wider region (Fernandes et al. Reference Fernandes, Day, Lewis, Slegers, Kerrigan, Breen, Cameron, Jago, Hall, Lowe, Innes, Tanzer, Chadwick, Thompson, Gorman, Simmons, Barnett, Sampson, De'ath, Mapstone, Marsh, Possingham, Ball, Ward, Dobbs, Aumend, Slater and Stapleton2005). In the case of the Filey PTA, Filey Brigg is an area dominated by very hard ground that extends from a headland (Allen Reference Allen2008). Selection of control areas was thus limited by the need to balance similar environmental conditions with the minimum distance required to assure minimal potential spillover influences.
Insights from a multidisciplinary perspective
Several factors have been highlighted as critical if MPAs are to meet their objectives, including appropriate design to meet stated objectives (Agardy et al. Reference Agardy, Bridgewater, Crosby, Day, Dayton, Kenchington, Laffoley, McConney, Murray, Parks and Peau2003), enforcement and compliance (Christie et al. Reference Christie, McCay, Miller, Lowe, White, Stoffle, Fluharty, McManus, Chuenpagdee, Pomeroy, Suman, Blount, Huppert, Eisma, Oracion, Lowry and Pollnac2003; Kritzer Reference Kritzer2004). The PTAs were not principally designed for fish stock enhancement (Rogers Reference Rogers1997; Traves Reference Traves2006), despite fishers’ beliefs to the contrary, but appear to have achieved success in their primary legislated purpose of conflict resolution between static and mobile sectors. Secondary ecological benefits may occur due to the exclusion of trawling, but should not be assumed. For example, the Devon Inshore Potting Agreement enhanced the size of some fish species (Blyth-Skyrme et al. Reference Blyth-Skyrme, Kaiser, Hiddink, Edwards-Jones and Hart2006), likely due to improvements in habitat quality (Kaiser et al. Reference Kaiser, Collie, Hall, Jennings and Poiner2002) and benthic communities upon which mobile species depend (Blyth et al. Reference Blyth, Kaiser, Edwards-Jones and Hart2004). Even low levels of trawling activity can affect habitats and benthic communities, and historical and on-going non-compliance may have limited the ability of the PTAs to deliver benefits for fish stocks (Kritzer Reference Kritzer2004; Monteiro et al. Reference Monteiro, Vázquez and Long2010). This assertion is supported by a recent study, which failed to detect differences in benthic communities across the boundaries of the PTAs (Allen Reference Allen2008).
This paper demonstrates the importance, and application, of integrating social, ecological and management data to allow meaningful interpretation of MPA assessments. Understanding fishers’ responses to existing management measures is essential to provide a solid foundation on which management decisions can be based. Whilst ecological assessments of MPAs are common, research on the social implications of MPAs remains sparse (Christie et al. Reference Christie, McCay, Miller, Lowe, White, Stoffle, Fluharty, McManus, Chuenpagdee, Pomeroy, Suman, Blount, Huppert, Eisma, Oracion, Lowry and Pollnac2003; De Young et al. Reference De Young, Charles and Hjort2008). Here, understanding of fishers’ perceptions and behaviour in response to the PTAs allows assessment of whether the PTAs are achieving their objectives and whether benefits accrue to fish, fisheries or individual fishers.
The fishers saw the PTAs to be a good tool for protecting stocks; non-compliance data and higher trawling activity at the boundaries of the PTAs may be indicative of the fishers’ perceptions of greater catch-per-unit-effort inside the PTA boundaries and potential spillover effects (Murawski et al. Reference Murawski, Wigley, Fogarty, Rago and Mountain2005), although an alternative explanation is that the grounds adjoining the PTAs are suitable for trawling.
CONCLUSION
The absence of protection effects on fish is attributable to a combination of ecological, social and gear-operation factors including: the high mobility of dominant fishes relative to the size of the protected areas; historical and on-going non-compliance with the PTAs measures; and the continued exploitation of fish resources by static gear fishers. To benefit locally targeted fish stocks, it is likely that the PTAs would need to be larger, and have higher levels of compliance and protection (as in no-take MPAs). However the limitations of the sampling gears used cannot be overlooked, and further research is required to develop the methods for use in UK waters by addressing the limitations described here, particularly given the inherent local ecological variability. We caution against the assumption that MPAs established for a particularly objective will fulfil multiple functions. While advocating MPAs as beneficial on all fronts may enhance initial support, failure to deliver promised benefits would be detrimental in the long term and may erode faith in MPAs as a management tool.
ACKNOWLEDGEMENTS
We thank the North Eastern Inshore Fisheries and Conservation Authority, the Newcastle University students who assisted with data collection and the local fishers who were interviewed. The Marine and Fisheries Agency (of the Department for Environment, Food and Rural Affairs) provided VMS data in raw, un-interpreted format. The Esmeé Fairbairn Foundation, DEFRA Fisheries Challenge Fund and a NERC quota PhD studentship funded this research. We thank the three anonymous referees for comments that improved an early draft.