Implications
Abatement of enteric methane emissions from livestock has gained interest owing to the association between greenhouse gas concentrations in the atmosphere and climate change. New technologies offer a low cost and repeatable means of assessing variation in enteric methane emissions among individual animals under commercial conditions. This study provides, for the first time, an assessment of phenotypic variation in enteric methane emissions among dairy cows on commercial farms. Variation was explained largely by animal and farm factors, but considerable residual variation remained, which suggests opportunities may exist for selection of animals and systems with lower emissions.
Introduction
Enteric methane (CH4) is produced in the digestive tract by microorganisms called Archaea as a by-product of anaerobic fermentation (methanogenesis). Enteric CH4 is a significant source of greenhouse gas (GHG) emissions from ruminant livestock, accounting for >50% of GHG emissions from milk production (FAO, 2010). Interest in measuring enteric CH4 emissions has moved from a focus on nutritional inefficiency (Blaxter and Clapperton, Reference Blaxter and Clapperton1965) to one of contributing to GHG concentrations in the atmosphere and climate change (Johnson and Johnson, Reference Johnson and Johnson1995; Intergovernmental Panel on Climate Change, 2007). Quantifying CH4 emissions accurately is important for national inventories of GHG emissions and also for evaluating mitigation strategies.
Although a large proportion of the variation in enteric CH4 emissions from dairy cows can be explained by diet composition and dry matter (DM) intake (Beauchemin et al., Reference Beauchemin, Kreuzer, O’Mara and McAllister2008; Bell and Eckard, Reference Bell and Eckard2012), there is additional variation in enteric CH4 emissions among animals (de Haas et al., Reference de Haas, Windig, Calus, Dijkstra, de Haan, Bannink and Veerkamp2011; Garnsworthy et al., Reference Garnsworthy, Craigon, Hernandez-Medrano and Saunders2012a). Manipulation of the diet can alter potential production of CH4 emissions immediately (Martin et al., Reference Martin, Morgavi and Doreau2010), whereas other mitigation options, such as breeding, may have potential to reduce CH4 emissions in the medium to long term. The extent of variation in CH4 emissions among dairy cows on commercial farms is unknown, but such information would be invaluable for calculating uncertainties associated with GHG inventories and for identifying systems with potential to mitigate CH4 emissions. Until recently, it has not been possible to measure CH4 emissions on commercial farms. Garnsworthy et al. (Reference Garnsworthy, Craigon, Hernandez-Medrano and Saunders2012b), however, developed a mobile and repeatable technique that can be used to measure enteric CH4 emissions from individual dairy cows during milking on commercial farms. A similar technique was used by Lassen et al. (Reference Lassen, Løvendahl and Madsen2012) to measure CH4 in breath of cows during robotic milking in an experimental herd. CH4 in breath of cows has also been measured using a hand-held laser CH4 detector (Chagunda, Reference Chagunda2013), but this technique is not practical for large-scale studies.
The objective of this study was to assess variation in enteric CH4 emissions among cows on commercial dairy farms and to identify major influences.
Material and methods
Data
Measurements of eructed CH4 emissions during milking were obtained from 43 820 milkings of 1964 individual cows on 21 commercial dairy farms between September 2011 and March 2013. Cows were milked individually at automatic (robotic) milking stations. During milking, cows consumed concentrates from an integral feed bin within the milking station. Concentrates were dispensed into the feed bin in small amounts, while the cow was milked, thereby ensuring the cow’s nose was within the bin during sampling. CH4 released by the cow through eructation and breathing altered CH4 concentration in the feed bin and a CH4 analyser (Guardian Plus; Edinburgh Instruments Ltd, Livingston, UK) in each milking station recorded CH4 concentration continuously for at least 7 days, as recommended by Garnsworthy et al. (Reference Garnsworthy, Craigon, Hernandez-Medrano and Saunders2012b). For a full description of the technique see Garnsworthy et al. (Reference Garnsworthy, Craigon, Hernandez-Medrano and Saunders2012b). The technique is briefly described below.
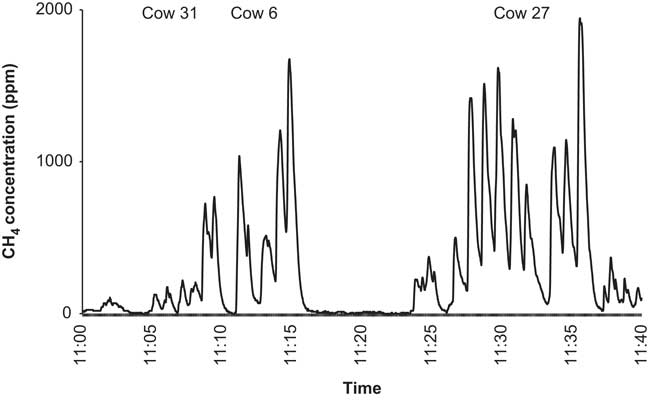
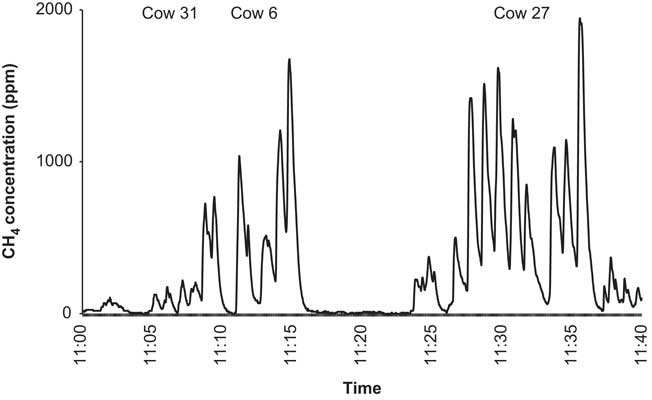
The CH4 concentration measured by the analyser was logged at 1 s intervals on data loggers (Simex SRD-99; Simex Sp. z o.o., Gdańsk, Poland) and visualised using logging software (Loggy Soft; Simex Sp. z o.o.). The CH4 analyser was calibrated using standard mixtures of CH4 in nitrogen (0.0%, 0.25%, 0.50%, 0.75% and 1.0% CH4; Thames Restek UK Ltd, Saunderton, UK). A custom-designed program was used to identify and quantify peaks for eructed CH4 concentrations during milking from raw logger data (Figure 1). Times of milking station entry and exit were recorded automatically to the nearest second and an offset applied to logger data to allow for sampling lag. For each milking, frequency of CH4 peaks (eructation rate) was multiplied by area under the curve (integral) of CH4 eructation peaks to calculate a CH4 emission index in milligrams per litre of air sampled by the analyser. The length of an eructation peak was defined as the time from start of a rapid rise in CH4 concentration until start of the next rise or return to baseline concentration, and peaks were integrated only above start and end concentrations to omit changes owing to breath or build-up of CH4 during milking. The CH4 emission index was converted to concentration of CH4 emitted by the cow by an estimate of the dilution of eructed air. The dilution factor was determined once at the end of each sampling period for each robotic milking station and varied from 11.2 to 43.7. A fixed volume (2.7 l) of 1.0% CH4 in nitrogen was released at two locations in the feed bin of the milking station, which were at the base of the trough and at the centre of the feed bin level with the sample tube. Release of CH4 was replicated three times at each location, with the dilution factor being the mean ratio of six values of CH4 concentrations in released and sampled gas. The CH4 emissions were calculated by the following equation:
 $$\eqalignno{& {\rm CH}_{{\rm 4}} ( {{\rm mg}/{\rm l}} )= ( {{\rm average \, integral \, of \, CH}_{{\rm 4}} {\rm /eructation}} \cr & \qquad \ \qquad { {\times}{\rm frequency \, of \, eructations}} ) {\times}{\rm dilution \, factor}$$
Concentration of CH4 in parts per million visualised by the data logging software during a 40 min sampling period at farm B showing eructations during milking for three cows, which milked sequentially.
Milkings with less than three eructations were excluded from the analysis as peak frequency cannot be estimated reliably from fewer eructations.
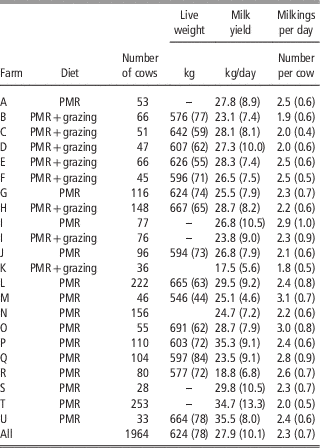
Cows were predominantly of Holstein Friesian breed and remained on the same feeding system during the sampling period. A summary for each farm of the number of cows, diet, average milk yield, live weight and CH4 records is shown in Table 1. Cows were fed ad libitum and diets fed were classified as either a partial mixed ration (PMR; i.e. conserved forage and concentrate feed) or a PMR with grazed pasture. All cows received concentrate feed during milking with the amount dependent on the cow’s daily milk yield. At farm I, CH4 emissions of cows were measured during two consecutive periods; in the first period cows were fed on a PMR while housed, and in the second period the same cows were fed on grazed pasture with free access to a PMR indoors.
Mean (s.d.) live weight, milk yield and number of milkings per day at each farm (A to U) for cows fed on diets consisting of partial mixed rations (PMR), or PMR with grazed pasture, plus concentrates

Ambient temperature was recorded in each milking station every 5 min using a data logger (MSR145-B51010; Omni Instruments Ltd, Dundee, UK). Ambient temperature did not have a significant effect on CH4 emissions.
Statistical analysis
Data were analysed using Genstat Version 15.1 (Lawes Agricultural Trust, 2012). A linear mixed model was used to assess effects of explanatory variables on average CH4 emissions (mg/l) per individual cow. Each variable was analysed in a univariate analysis. The most significant variables from the univariate analyses were added first to a multivariate model and only those variables that made a significant (P<0.05) additional contribution when fitted last were retained. Robotic milking station within farm was included as a random effect and covariates were centred to a zero mean. Variables that had confounding effects between each other were tested by running the model with and without each variable; any variable showing a significant effect when fitted last was retained. The explanatory variables assessed were: farm, season (1=October to March, 2=April to September), average number of milkings per day, lactation number (1, 2, 3, 4 and 5+), week of lactation at start of sampling (1, 2, 3,…, 50), age at calving (months), average daily concentrate DM intake, live weight, daily milk yield, diet (PMR or PMR plus grazed pasture) and average ambient temperature during milking. At farm I only, cows had CH4 emissions measured while being fed on a PMR and on grazed pasture with PMR.
Of the explanatory variables assessed, the model that best described the average CH4 emissions (Y ijk , mg/l) of individual cows was the following equation:
 $$Y_{{ijk}} =\mu {\plus}{\rm W}_{i} {\plus}{\rm b}_{{\rm 1}} {\rm M}{\times}{\rm F}_{j} {\plus}{\rm F}_{j} .{\rm R}_{k} {\plus}{\rm E}_{{ijk}} $$
where µ is the overall mean; W i the fixed effect of week of lactation; b 1M the linear regression of Y on daily milk yield; F j the fixed effect of farm; F j .R k the random effect of milking station within farm; E ijk the random error term. To account for the random effect of multiple milking stations within farms (F j .R k ) on CH4 emissions, milking stations were numbered and the station visited at each milking was recorded. Individual cows showed a strong preference to visit the same station each time, so the milking station each cow visited most frequently (modal station) was determined and included in the model as a factor. In the multivariate model, residual variance estimates were allowed to differ among farms. Using the data for farm I only, differences between cows and diets, and repeatability of CH4 emission phenotype, were assessed using equation (2) with individual cow added as a random effect and without the effect of farm fitted in the model. The repeatability of the CH4 emission phenotype was assessed by σ 2 animal/(σ 2 animal+σ 2 residual), where σ 2 is the variance component. The residual CV was calculated from variance components as the square root of residual σ 2 divided by the estimated mean.
Spearman’s rank correlation was used to assess repeatability and ranking of CH4 emissions from the same cows at farm I when fed on a PMR only or PMR with grazed pasture.
Results and discussion
Across the 21 farms studied, cows averaged 624±78 kg live weight and cows were milked 2.3±0.7 times/day, producing 27.9±10.1 kg/day of milk (mean±s.d.; Table 1). Eructed CH4 emissions during milking were measured when cows were fed a PMR at 8 of the 21 farms, with a PMR with grazed pasture being fed at the remaining 13 farms; at farm I there were 74 cows fed both a PMR and PMR with grazed pasture during consecutive periods. The number of eructations per cow averaged 0.9±0.1 min−1 across farms.
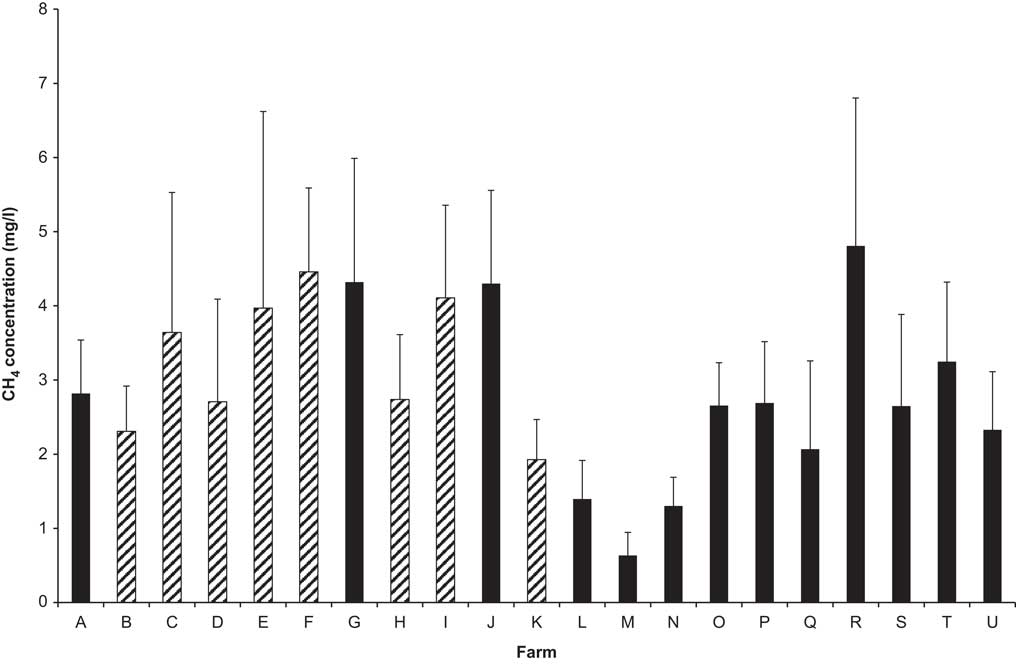
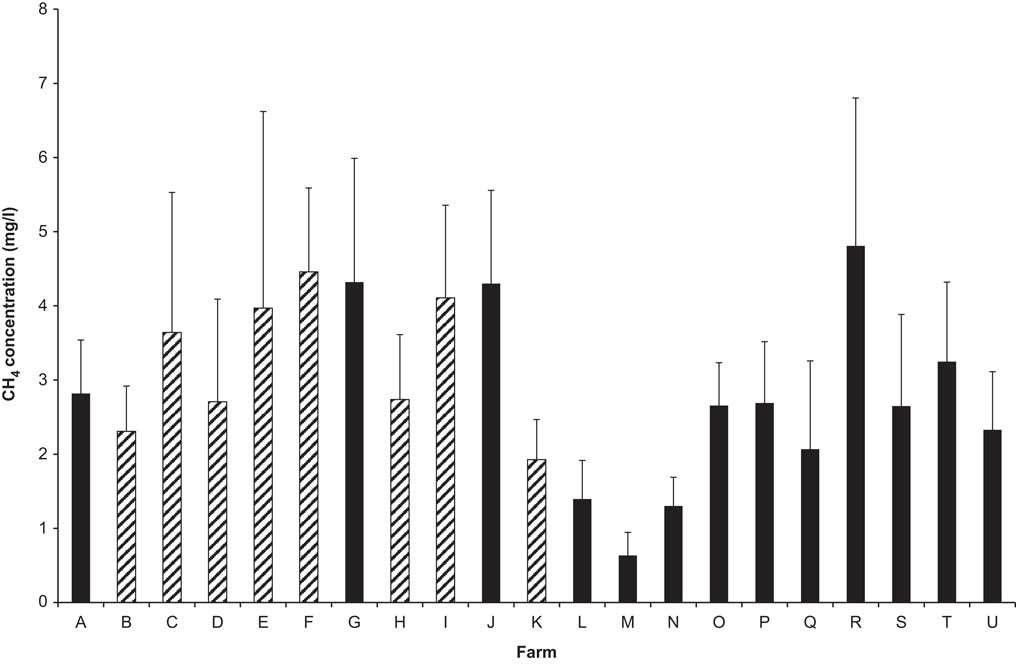
Predicted mean CH4 emissions ranged from 0.6 mg/l from cows at farm M to 4.8 mg/l for cows at farm R (Figure 2). The CV was on average slightly lower among cows fed a PMR (36.5%) compared with cows fed a PMR with grazed pasture (39.0%) (Figure 2). This is in agreement with Vlaming et al. (Reference Vlaming, Clark and Lopez-Villalobos2005), who found lower variation in enteric CH4 emissions measured using the SF6 measurement technique among individual housed dairy cows (21%) compared with grazing cows (31%). Generally, the current study found a greater CV in CH4 emissions (ranging from 21.8% to 66.8%) among lactating dairy cows on commercial farms (Figure 2) compared with the range of 3% to 34% in CV found in studies using respiration chambers to measure emissions in research herds (Ellis et al., Reference Ellis, Kebreab, Odongo, McBride, Okine and France2007; Grainger et al., Reference Grainger, Clarke, McGinn, Auldist, Beauchemin, Hannah, Waghorn, Clark and Eckard2007; Yan et al., 2010). In contrast to enteric CH4 measured in chambers, the current study used a technique that takes repeated measurements of enteric CH4 emissions from individual animals in their normal environment. It is to be expected that the controlled conditions imposed on cows in respiration chambers will reduce variation (Garnsworthy et al., Reference Garnsworthy, Craigon, Hernandez-Medrano and Saunders2012b).
Predicted mean (with s.d. bars) CH4 emissions during milking of cows at farms A to U after adjusting for effects of week of lactation, daily milk yield and farm. Diets fed at farms consisted of partial mixed rations (PMR, in black), or PMR with grazed pasture (hashed), plus concentrates. Mean for farm I is for both feeding periods combined.
Effect of week of lactation, milk yield and farm on CH4 emissions
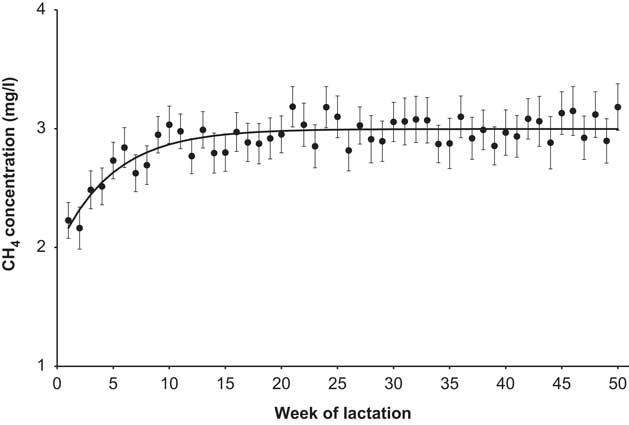
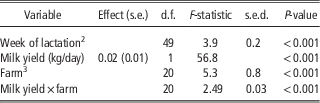
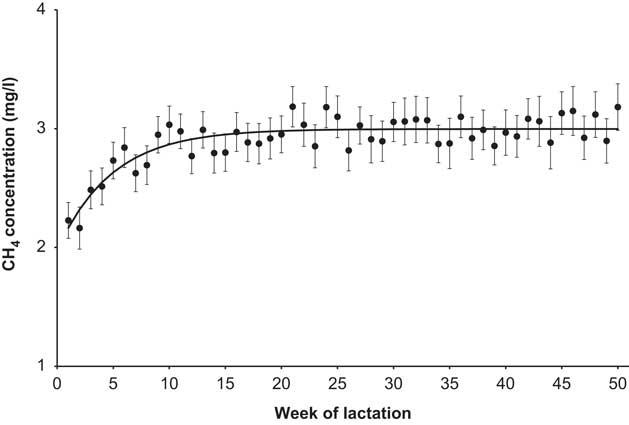
Significant effects on CH4 emissions were found for week of lactation, daily milk yield, farm, and the interaction between daily milk yield and farm (all P<0.001; Table 2). Emissions of CH4 increased over the first 20 weeks of lactation, but were relatively constant from week 21 to week 50 of lactation (Figure 3); ranging from 2.2 mg/l at week 1 to 3.2 mg/l at week 50. This is in agreement with the findings of Garnsworthy et al. (Reference Garnsworthy, Craigon, Hernandez-Medrano and Saunders2012a), although in that study CH4 decreased after week 42 of lactation. The effect of week of lactation on CH4 emissions may be explained by changes in amount and composition of feed consumed; CH4 emissions are positively related to DM intake and negatively related to proportion of concentrates in the diet (Beauchemin et al., Reference Beauchemin, McGinn, Benchaar and Holtshausen2009); DM intake is typically lower, and contains a higher proportion of concentrate feed in early lactation than later in lactation. The difference between studies might be owing to recording each cow for 7 to 14 days in the current study, but for up to 5 months in the study of Garnsworthy et al. (Reference Garnsworthy, Craigon, Hernandez-Medrano and Saunders2012a), thus altering the relative weighting of between-cow and within-cow effects of week of lactation.
Change in predicted mean (with s.e. bars) CH4 emissions during milking with week of lactation after adjusting for effects of daily milk yield and farm; the line of best fit shown by the solid line: CH4 (mg/l)=3.0−1.02×(0.81week of lactation).
Significant explanatory variables for methane emissions during milking (mg/l) among lactating dairy cows from multivariate analysisFootnote 1

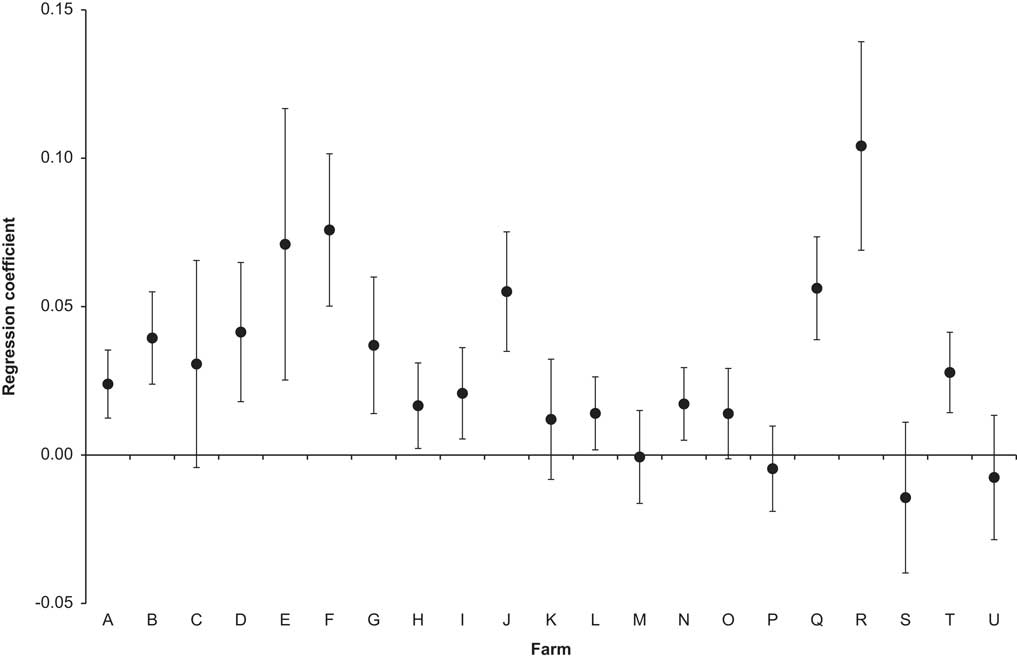
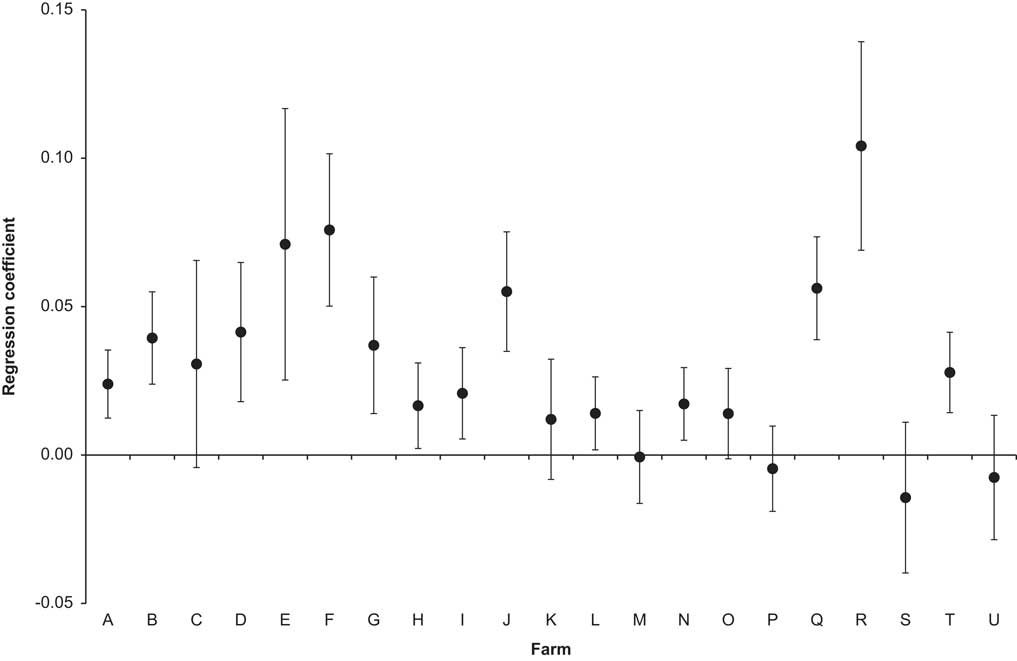
On average, mean CH4 emissions increased with increasing daily milk yield (b 1=0.02, P<0.001; Table 2), reflecting the positive relationship between milk yield and DM intake. However, there was a significant interaction between effects of daily milk yield and farm (P<0.001; Table 2, Figure 4); CH4 emissions increased with increasing daily milk yield at most farms, but decreased with increasing daily milk yield at farms M, P, S and U. Different responses among farms in CH4 emissions with increased milk yield may reflect differences in feeding regimes and energy utilisation by cows. For example, the greatest positive association between CH4 emissions and milk yield was found for farm R and the greatest negative association at farm S. On both farms the feeding regime was a PMR plus concentrates fed in the milking station according to milk yield. Concentrates with high starch or fat concentrations can reduce CH4 emissions, particularly at high feeding levels (Beauchemin et al., Reference Beauchemin, McGinn, Benchaar and Holtshausen2009); concentrates at both farms had similar starch concentrations (205 g/kg DM), but concentrates at farm R had a lower fat concentration (50 g/kg DM) than concentrates at farm S (62 g/kg DM). Furthermore, the PMR at farm R consisted of grass silage and whole-crop wheat silage, whereas the PMR at farm S was based mostly on maize silage, but also contained whole linseed meal, which is known to suppress CH4 emissions (Beauchemin et al., Reference Beauchemin, McGinn, Benchaar and Holtshausen2009). Thus, increased milk yield at farm S would result in increased DM intake, but each incremental kg of feed would contain a greater proportion of concentrates, and total intake of a CH4 inhibitor (whole linseed) would increase. Differences between farms may also be owing to the observation that effects of feeding level and energy efficiency on enteric CH4 emissions are independent (Yan et al., Reference Yan, Mayne, Gordon, Porter, Agnew, Patterson, Ferris and Kilpatrick2010).
Regression coefficient (with s.e. bars) for effect of daily milk yield on CH4 emissions during milking among individual cows at farms A to U after adjusting for the effects of week of lactation and farm.
Although CH4 emissions increased overall with increasing milk yield, emission per kg of milk decreased as milk yield increased. The reduction in emissions per unit milk may be because of a combination of a higher proportion of concentrate feed in the diet reducing CH4 per unit of feed intake (Beauchemin et al., Reference Beauchemin, Kreuzer, O’Mara and McAllister2008; Bell et al., Reference Bell, Wall, Russell, Morgan and Simm2010) and an increased efficiency of energy utilisation by dilution of maintenance energy requirements. Dillon et al. (Reference Dillon, Berry, Evans, Buckley and Horan2006) found that if cows are to meet their genetic potential for milk production, they need to maximise feed intake, which can be achieved using a more digestible total mixed ration (conserved forage and blended concentrate mix) rather than pasture. In the present study, cows were fed concentrate feed during milking in addition to the non-forage component in the PMR. The amount of concentrate fed during milking depended on the cow’s milk production. Concentrate feed is known to have a curvilinear effect on fibre digestion, resulting in a depression in CH4 emissions per unit intake (Reynolds et al., Reference Reynolds, Crompton and Mills2011).
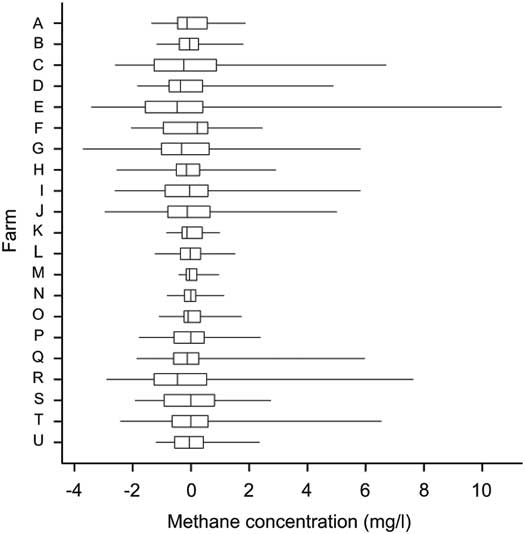
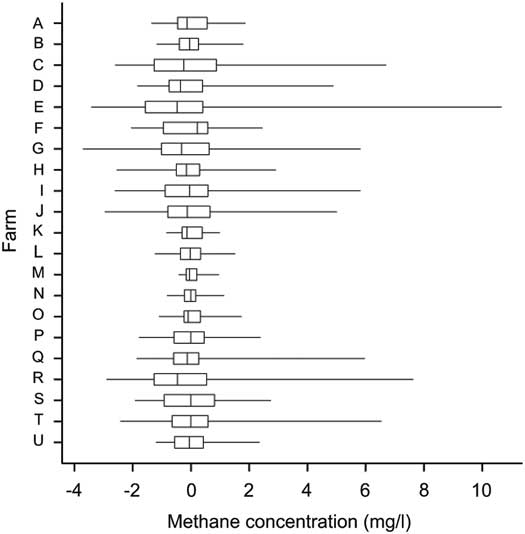
Overall, after adjusting CH4 emissions for significant fixed effects (equation (2)) there was considerable residual variation in CH4 emissions among cows within farms (Figure 5). Extent of within-farm residual variation varied between farms; notably, farms C to J and P to T were associated with a greater range of residual values compared with other farms. As many unquantified factors vary between farms, such as management practices, building design, feed sources and cow genetics, it is not possible to explain differences in residual variation. Further research is needed to explore some of these factors and thereby improve predictions of on-farm CH4 emissions.
A box and whisker diagram showing the minimum, lower quartile, median, upper quartile and maximum residual CH4 emissions during milking for individual cows after adjusting for effects of week of lactation, daily milk yield and farm at farms A to U.
Of particular interest is the possibility of a genetic influence on CH4 emissions, which would facilitate breeding animals with low emissions. Heritability of CH4 emissions estimated from short-term measurements in sheep was 0.29 (Pinares-Patiño et al., Reference Pinares-Patiño, Hickey, Young, Dodds, MacLean, Molano, Sandoval, Kjestrup, Harland, Hunt, Pickering and McEwan2013), which is similar to the estimate of 0.35 for heritability of CH4 emissions predicted from feed intake, live weight and milk yield in dairy heifers (de Haas et al., Reference de Haas, Windig, Calus, Dijkstra, de Haan, Bannink and Veerkamp2011). There has been no estimate of heritability of CH4 emissions measured in dairy cows on-farm, but within a single herd of 215 cows, a significant sire effect was observed (Garnsworthy et al., Reference Garnsworthy, Craigon, Hernandez-Medrano and Saunders2012a).
Repeatability and effect of diet on CH4 emissions
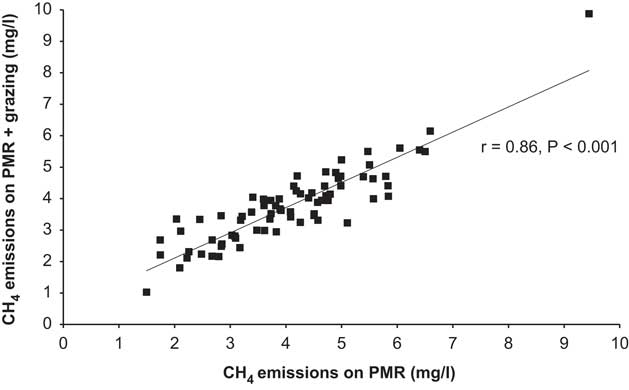
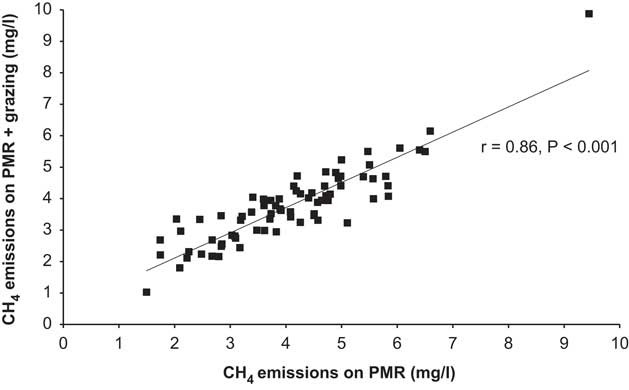
Mean CH4 emissions for 74 cows at farm I were highly repeatable, whereby cows fed on a PMR had a high and positive rank correlation (r=0.86, P<0.001) with CH4 emissions measured when the same cows were fed on a PMR with grazed pasture (Figure 6). Repeatability of the CH4 emission phenotype from variance components was high at 0.89 and the CV was 27.3%. No significant effect of diet, when classified as PMR or PMR with grazed pasture, on CH4 emissions, was found between all farms or within farm I. In the study of Garnsworthy et al. (Reference Garnsworthy, Craigon, Hernandez-Medrano and Saunders2012b), ~50% of variation in emission rate per unit intake was explained by differences between diets (effects of DM intake and diet composition). It is well recognised that DM intake and diet composition (digestibility, fat, energy and carbohydrate content) have large effects on enteric CH4 emissions (Mills et al., Reference Mills, Kebreab, Yates, Crompton, Cammell, Dhanoa, Agnew and France2003; Ellis et al., Reference Ellis, Kebreab, Odongo, McBride, Okine and France2007) and hence these are common variables in empirical prediction equations (Bell and Eckard, Reference Bell and Eckard2012). The lack of an effect of diet type on CH4 emissions in the current study would suggest that more detailed information on diets was needed; or it might be that the diets fed were of high quality and that variation in CH4 emissions was largely explained by the effect of feed intake level (described by week of lactation and milk yield).
Mean CH4 emissions during milking for the same individual cows at farm I fed on partial mixed rations (PMR) and subsequently on PMR with grazed pasture. The rank correlation (r) is shown with the line of best fit.
In the current study, we quantified CH4 concentrations (mg/l) in gas released by eructation during milking. This can be equated to rate of release (mg/min) because the analyser sampled at 1 l/min. The rate of release during milking cannot be simply scaled up to rate per day, however, because release rate during milking is faster than during the rest of the day (Garnsworthy et al. Reference Garnsworthy, Craigon, Hernandez-Medrano and Saunders2012b). Nevertheless, an approximation of daily rate can be estimated using a calibration equation linking on-farm and chamber measurements. The average CH4 concentration across farms in the current study was 2.9 mg/l (Figure 2) which, estimated by the equation of Garnsworthy et al. (Reference Garnsworthy, Craigon, Hernandez-Medrano and Saunders2012b), would equate to 418 g/day of eructed CH4 (CH4 (g/day)=252+(57.2×2.9)mg/l). This value is within the range reported for dairy cows by Grainger et al. (Reference Grainger, Clarke, McGinn, Auldist, Beauchemin, Hannah, Waghorn, Clark and Eckard2007) of 220 to 480 g/day.
In conclusion, this study demonstrates that there is considerable variation in CH4 emissions among commercial dairy cows, as estimated by measuring CH4 concentrations during milking. Differences within farms in CH4 emissions were explained by week of lactation, daily milk yield, farm, and the interaction between milk yield and farm. Differences between farms in mean CH4 emissions, and in variation within farm, are inevitably confounded by factors such as location, diet, management, genotype and instrument installation. Nevertheless, the findings of this study suggest that there is scope for selecting individual cows and systems that have the potential to produce lower enteric CH4 emissions at any level of milk output.
Acknowledgements
This work was funded by Defra, the Scottish Government, DARD and the Welsh Government as part of the UK’s Agricultural GHG Research Platform project (www.ghgplatform.org.uk). We would like to thank all the farmers who allowed us to measure methane emissions on their farms and provided data for this study.