Introduction
The mechanical or dielectric response of a material to a cyclic force is a powerful probe of relaxation mechanisms over time constants spanning many orders of magnitude. For example, the loss modulus, i.e., the imaginary part of the dynamic modulus is measured as a function of temperature and angular frequency, ω. Identification of the microscopic processes underlying observed glass behavior has been a long-term challenge.[Reference Angell, Ngai, McKenna, McMillan and Martin1] Based on the time–temperature superposition principle,[Reference Ngai, Plazek and Rendell2–Reference Jeong, Fleury, Kim, Kim and Hono5] when frequency response curves obtained at different temperature can be shifted on a ln(ω) scale to yield a single master curve, a single activated process is typically concluded. The temperature dependence of the shift factor has been used to obtain an apparent activation energy. However, it has been observed consistently that the response curves are broader than a Cauchy function, the expected shape for a single time constant. Typically, a Kohlrausch–Williams–Watts (KWW) stretched exponent, exp[−(t/τ)β],[Reference Kohlrausch6–Reference Williams, Watts, Dev and North8] where β and τ are constants, or other functions are used as empirical descriptions of time-dependent relaxation.[Reference Qiao and Pelletier4, Reference MacDonald9] This implicit a priori assumption about the shape of the relaxation-time spectrum strongly suggests a spread in activation energies. In many glasses, a tail is observed in the loss modulus or dielectric loss at fixed temperature and high frequencies, or at fixed frequency and low temperature. It has been attributed to (β) relaxation processes that differ qualitatively from those responsible for the main part of the peak, which originates from slower (α) relaxations.[Reference Johari and Goldstein10–Reference Johari and Goldstein13]
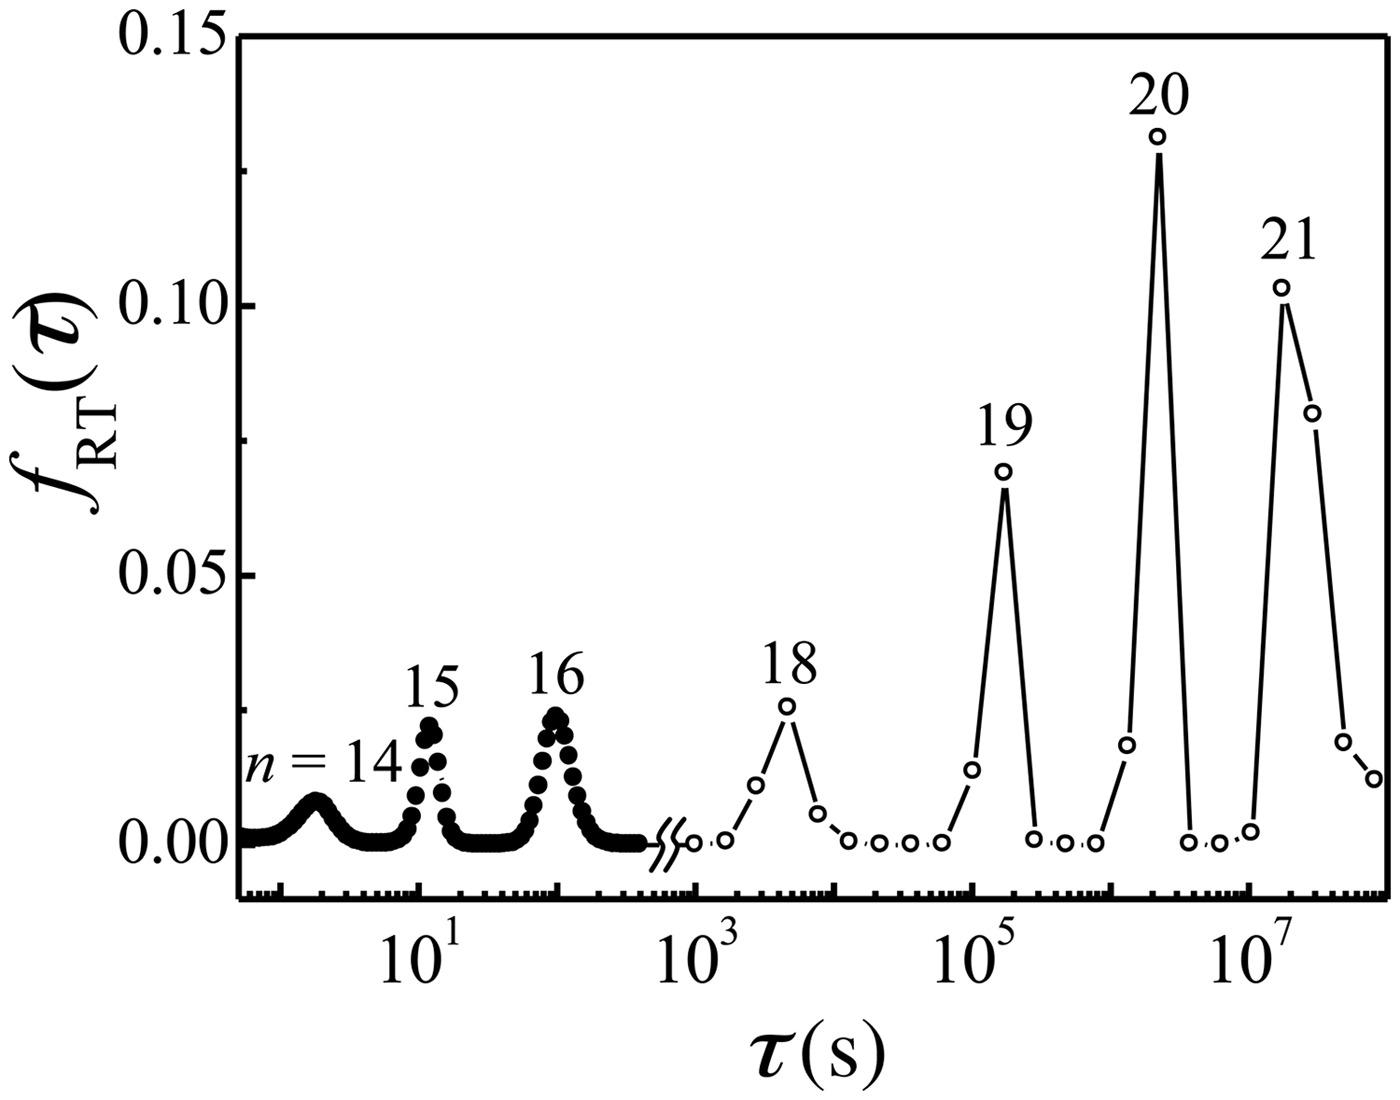
We have recently obtained[Reference Ju, Jang, Nwankpa and Atzmon14] relaxation-time spectra at room temperature, f RT(τ), directly from quasi-static anelastic relaxation measurements in amorphous Al86.8Ni3.7Y9.5 for time periods over 7 × 10⁷ s. No a priori assumption was made about the shape of the spectra. These exhibited distinct peaks (Fig. 1), which we analyzed in terms of shear transformation zones (STZs).[Reference Argon15–Reference Falk and Langer17] At low stress and strain, these are isolated, near-equiaxed clusters that undergo dissipative shear, accommodated by elastic deformation of the matrix surrounding them. Analysis according to the background section (below) yielded the STZ volume corresponding to each peak, which exhibited an increment of one atomic volume from one peak to the next. This atomically quantized hierarchy allowed us to attribute a number of atoms to each peak, indicated with n = 14–21 in Fig. 1 (see Ref. Reference Ju, Jang, Nwankpa and Atzmon14). The corresponding activation energies for shear transformation were 0.83–1.26 eV. In the picture we employed, STZs form within the fraction of the total volume that comprises potential STZs. The latter are the same as “fertile sites” in the terminology of Argon and Demkowicz.[Reference Argon and Demkowicz18] The discrete size–density distribution of potential STZs was given by
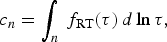 $${c_n}=\vint_n {{\,f_{{\rm RT}}}} \lpar \tau \rpar \, d\ln \tau\comma \;$$
with integration over peak n, and is consistent with our theoretical model.[Reference Atzmon and Ju19] Recently, we have also obtained equivalent results from dynamic-mechanical data.[Reference Ju and Atzmon20] We point out that while molecular dynamics simulations are useful for elucidating atomistic details, the method is impractical for the present regime of rare, thermally activated, events at low stress and strain.
Relaxation-time spectrum obtained from quasi-static anelastic relaxation at room temperature in amorphous Al86.8Ni3.7Y9.5. The method is based on Ref. Reference Ju, Jang, Nwankpa and Atzmon14, but longer initial constraining time was used. Short time constants were obtained by nanoindenter cantilever bending, and long time constants by bend-stress relaxation. The number of atoms in the corresponding STZs is indicated (see the text).

The unprecedented knowledge of detailed STZ kinetics allows us to presently calculate the dynamic-mechanical response of the same metallic glass, and evaluate the prevailing approaches to the interpretation of dynamic data. We find that the master-curve approach does not resolve the range of activation energies that govern viscoelastic flow. We also show that both slow (α) and fast (β) relaxations in glasses likely originate from shear transformations.
Background
The activation energy for a shear transformation is given by Argon and Shi[Reference Argon and Shi16]
 $$\eqalign{\Delta {E_{{\rm a\comma }n}} & =\left[{\left({\displaystyle{{\lpar 7 - 5\nu \rpar } \over {30\lpar 1 - \nu \rpar }}+\displaystyle{{2\lpar 1+\nu \rpar } \over {9\lpar 1 - \nu \rpar }}{{\bar \beta }^2}} \right)\gamma _0^T+\displaystyle{1 \over 2}\displaystyle{{{{\bar \sigma }_{{\rm STZ}}}} \over \mu }} \right]\cr & \quad \times \mu \gamma _0^T {\Omega _n}\comma \; }$$
where Ωn = n × Ω0 is the STZ volume and Ω0 the atomic volume of Al, the majority element in the alloy used. γ 0T is the transformation shear strain, and ν, the Poisson's ratio. μ is the shear modulus and  ${\bar \beta ^2}$ relates the hydrostatic to shear strain and is approximately equal to 1.[Reference Argon and Shi16]
 ${\bar {\it \sigma} _{{\rm STZ}}}$ is the resistance of the STZ itself to shear, and is small compared with the effect of the elastic stress due to the surrounding matrix.[Reference Argon and Shi16] Following Ref. Reference Ju, Jang, Nwankpa and Atzmon14, which models each STZ size class as a Voigt unit[Reference Lakes21] consisting of a spring and dashpot in parallel, the time constant for anelastic relaxation for STZs of size n is obtained:
 $${\tau _n}=\displaystyle{{3{{\eta ^{\prime}}_n}} \over {{{E^{\prime}}_n}}}=\displaystyle{{3\, k\, T} \over {2\mu \lpar 1+\nu \rpar {\nu _G}\gamma _0^C \gamma _0^T {\Omega _n}}}\exp \left[{\displaystyle{{\Delta {E_{{\rm a\comma }n}}} \over {k\, T}}} \right]\comma \;$$
where k is the Boltzmann's constant, ηn′ is the effective viscosity of the dashpot in the Voigt unit corresponding to STZs of size n, and E n′ = E 0/c n is the effective modulus of the spring. νG is the attempt frequency, E 0 is the high-frequency modulus and γ 0C = [2(4–5ν)/15(1–ν)]γ 0T is the transformation strain for an STZ constrained by the surrounding matrix.
Results and discussion
In order to evaluate the master-curve method, we computed the dynamic loss modulus as a function of ln(ω) at temperatures T i ranging from 373 to 413 K, from the experimental spectrum of Fig. 1:
 $${E^{\prime \prime}_T}\lpar \omega\comma \; T\rpar /{E_0}=\vint {{\,f_T}} \lpar \tau \rpar \displaystyle{{\omega \tau } \over {1+{{\lpar \omega \tau \rpar }^2}}}d\ln \tau$$
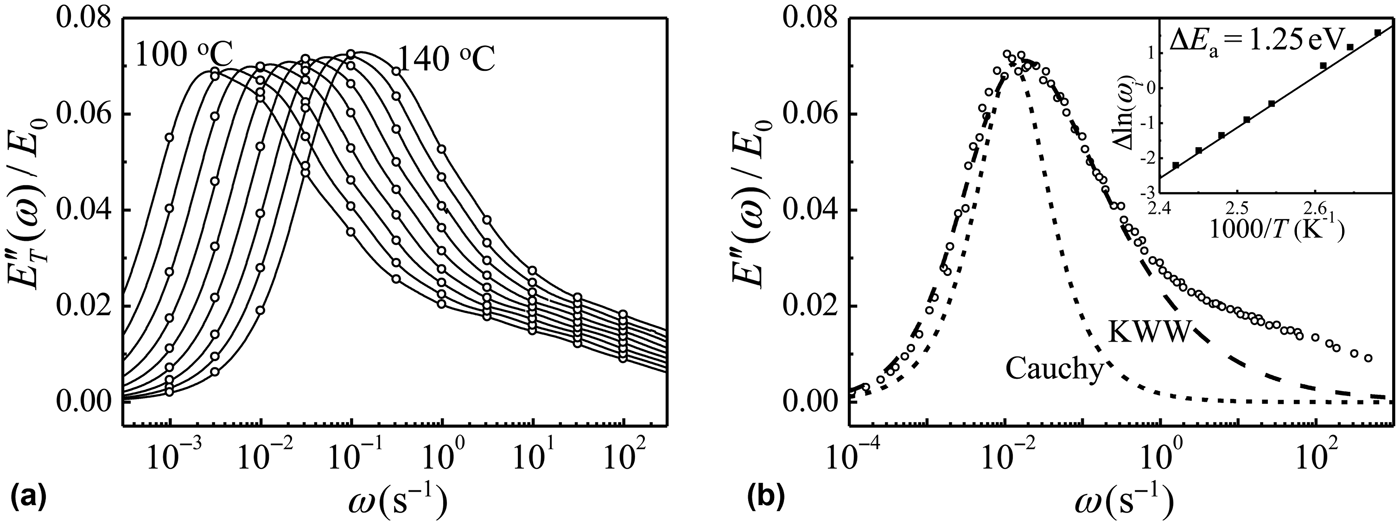
[Figure 2(a)]. The spectrum at each temperature T, f T(τ), was determined from that at room temperature (Fig. 1) by fitting each peak with a log-normal function and shifting it as a function of temperature according to Eqs. (2) and (3) for the respective n. Based on experimental observation,[Reference Ju and Atzmon20] the same upper limit on n was assumed for all temperatures. The slight increase in E T′′(ω) peak height with temperature is due to its decreasing width that follows from Arrhenius behavior. In Fig. 2(b), selected sets of points for each temperature as in Fig. 2(a), representing simulated measurements, are shifted horizontally so that the points originally at ω = 10−2 s−1 coincide with the curve computed for T ref = 388 K, chosen as reference.Footnote 1 Despite the range of activation energies for the processes used to generate the curves in Fig. 2, a single master curve is observed, i.e., the time–temperature superposition principle is obeyed. In the inset in Fig. 2(b), the shift required at temperature T i, Δln(ω i), is plotted as a function of T i−1. If a single activation energy, ΔE a, is assumed, the shift can be expressed as[Reference Ngai, Plazek and Rendell2–Reference Jeong, Fleury, Kim, Kim and Hono5]
 $$\Delta \ln \lpar {\omega _i}\rpar =\displaystyle{{\Delta {E_{\rm a}}} \over k}\left({\displaystyle{1 \over {{T_i}}} - \displaystyle{1 \over {{T_{{\rm ref}}}}}} \right).$$
The apparent value, ΔE a = 1.25 eV, obtained from a single-parameter fit in the inset, is close to that corresponding to the largest STZs observed in Ref. Reference Ju, Jang, Nwankpa and Atzmon14, 1.26 eV. It is obvious that the time–temperature superposition principle does not resolve the spread in activation energies used to obtain Fig. 2.
(a) E T′′(ω), loss modulus, calculated at T i steps of 5 K from the spectrum in Fig. 1. (b) Master curve obtained by shifting sets of points obtained at each T i to coincide with the curve at T ref = 388 K. A Cauchy function, corresponding to a single activated process, and a KWW fit to the main part of the curve, are included. The inset shows the shift factor as a function of reciprocal temperature.
The Cauchy function included in Fig. 2(b), characteristic of a single activated process, clearly does not describe the calculated E″ curves. Also included is a fit to the main part of the master curve, based on the frequency-domain expression corresponding to KWW.[Reference Bergman22] With the exception of the tail, the fit quality is good, as is often the case for experimental data.[Reference Qiao and Pelletier4, Reference Suh and Dauskardt23] The stretching exponent is β = 0.50, similar to the value obtained for a different metallic glass,[Reference Qiao and Pelletier4] but a range of values below 1 has been reported in other studies. In the present model, the value of β depends on the shape of c n. We conclude from the quality of the KWW fit that the present STZ analysis likely applies to other data sets that have been fitted with similar functions.
The slow, irreversible relaxations typically observed near the glass transition temperature, termed α relaxations, have typically been attributed[Reference Johari and Goldstein10–Reference Johari and Goldstein13] to a mechanism that is different than that of the faster β relaxations. The latter dominate at high frequency and/or low temperature, when α relaxations are frozen. We point out, however, that a tail that deviates from the phenomenological KWW curve does not in and of itself constitute evidence of a different mechanism. Since small STZs have a low ΔE a,n, they dominate as a tail at high frequencies in Fig. 2, showing deviation from the ω −1 dependence expected for a single process and from the KWW curve. This result demonstrates unequivocally that, at least in a metallic glass, one does not need to invoke separate mechanisms to explain α and β relaxations. Rather, both can be explained by STZs of different sizes. Since the volume fraction occupied by potential STZs increases with size [Fig. 1 and Eq. (1)],[Reference Ju, Jang, Nwankpa and Atzmon14] slow processes, associated with large STZs, may be irreversible if the latter interact or percolate. In contrast, small and fast STZs are isolated and (mechanically) reversible. One unique aspect of our experiments is the low strain and therefore the absence of STZ percolation for any size, leading to complete mechanical reversibility, as seen in Figure 2 of Ref. Reference Ju, Jang, Nwankpa and Atzmon14 and subsequent results.[Reference Ju and Atzmon20] This experimental regime, explored at long time, allows us to observe reversibly, well below the glass transition, the processes responsible for permanent deformation at higher strains. Consequently, the theory of isolated STZs can be applied.[Reference Argon15, Reference Argon and Shi16] Near and above the glass transition, and for activated flow states at high strain, different approaches are needed due to complications associated with strongly temperature-dependent elastic moduli[Reference Dyre, Olsen and Christensen24] and STZ interactions. For this regime, phenomenological models by Vogel–Fulcher–Tammann[Reference Vogel25–Reference Tammann and Hesse27] and Williams–Landel–Ferry[Reference Williams, Landel and Ferry28] have been widely used.
The variation in prominence of β relaxations among alloys[Reference Qiao and Pelletier29] is likely due to (a) composition effects on STZ properties[Reference Cohen, Karmakar, Procaccia and Samwer12, Reference Yu, Samwer, Wu and Wang30, Reference Delogu31]; or (b) smaller defects, as we pointed out in Ref. Reference Ju, Jang, Nwankpa and Atzmon14. Both are beyond the scope of the present work. Finally, while the present work was conducted for metallic glasses, the results may be applicable to other, e.g., covalent, glasses, for which the same deformation model has been used.[Reference Argon32] For molecular glasses, distinct relaxation mechanisms are likely, and the present simple model may be less useful.
Conclusions
We have used detailed quasi-static data on the spectrum of shear transformations in a metallic glass to calculate its dynamic-mechanical response. We find that the time–temperature superposition principle is not sufficiently sensitive to the range of activation energies corresponding to the different STZ sizes or their atomically quantized hierarchy. We also show that α and β relaxations in metallic, and possibly covalent, glasses can be attributed to the same mechanism. The present results suggest that the past interpretations of dynamic behavior of glasses may need to be re-evaluated.
Acknowledgment
This work was funded in part by U.S. NSF Grant DMR-1307884.