Introduction
The world is undergoing an extinction crisis, primarily driven by human activities (Dirzo et al. Reference Dirzo, Young, Galetti, Ceballos, Isaac and Collen2014, IUCN 2022). Climate change is widely recognized as one of the most significant threats to biodiversity (Bellard et al. Reference Bellard, Bertelsmeier, Leadley, Thuiller and Courchamp2012), with 45% of all known flowering plant species currently threatened with extinction (Antonelli et al. Reference Antonelli, Fry, Smith, Eden, Govaerts and Kersey2023). In this context, establishing priorities for biodiversity conservation becomes a necessary yet complex task due to limited funding, time constraints and challenges in implementation (Knight et al. Reference Knight, Cowling, Rouget, Balmford, Lombard and Campbell2008). Biological diversity is a fundamental driver of ecosystem functioning (Loreau & Hector Reference Loreau and Hector2001), with its effects often assessed through measures of species diversity and richness (Díaz et al. Reference Díaz, Lavorel, de Bello, Quétier, Grigulis and Robson2007).
Hotspots, traditionally defined as areas with high concentrations of endemic species facing anthropogenic threats (Myers Reference Myers1990), are widely seen as effective starting points for setting conservation priorities (Myers et al. Reference Myers, Mittermeier, Mittermeier, Da Fonseca and Kent2000). Conservation of hotspots is critical, as they contain unique species that cannot be protected anywhere else (Mittermeier et al. Reference Mittermeier, Turner, Larsen, Brooks, Gascon, Zachos and Habel2011). However, species are not genetically uniform, and intraspecific genetic variation – an essential yet often overlooked component of biodiversity – is frequently neglected in conservation planning (Coates et al. Reference Coates, Byrne and Moritz2018). Moreover, although the loss of genetic diversity can reduce evolutionary potential and hinder species’ ability to adapt to novel conditions (Doi et al. Reference Doi, Takahashi and Katano2010), limited global actions have been taken to protect it (Hoban et al. Reference Hoban, Bruford, Jackson, Lopes-Fernandes, Heuertz and Hohenlohe2020). Therefore, in the face of a global extinction crisis, it is essential to consider genetic diversity as a key dimension of biodiversity below the species level (Brum et al. Reference Brum, Graham, Costa, Hedges, Penone and Radeloff2017).
Advances in sequencing technologies have enabled accurate taxon identification and the assessment of genetic diversity using standardized DNA regions. In the context of limited conservation budgets, the use of short and diagnostic DNA fragments can be suitable for differentiating species and can support cost-effective, evidence-based decision-making (de Vere et al. Reference de Vere, Rich, Trinder and Long2015). Over the last two decades, the growing availability of DNA sequence data has greatly advanced biodiversity knowledge, which is critical for conservation planning and for long-term ecosystem resilience (Joly et al. Reference Joly, Davies, Archambault, Bruneau, Derry and Kembel2014, Sheth & Thaker Reference Sheth and Thaker2017). Barcode regions are conserved, easily amplifiable and helpful in identifying closely related species. Nevertheless, because no single barcode locus is universally applicable across all plant species, using barcode markers with high intraspecific variation can help us to detect distinct haplotypes (Letsiou et al. Reference Letsiou, Madesis, Vasdekis, Montemurro, Grigoriou and Skavdis2024). The complementary characteristics of ITS2 and rbcLa barcode markers are commonly used in plant molecular studies. ITS2, a nuclear marker, offers high interspecific divergence and good resolution at the species level (Yao et al. Reference Yao, Song, Liu, Luo, Han and Li2010), while rbcL, a chloroplast gene, is more conserved but highly amplifiable across diverse plant taxa due to the availability of universal primers (Hollingsworth et al. Reference Hollingsworth, Graham and Little2011). Both markers are also well-represented in public databases, aiding in species identification and phylogenetic analysis (Letsiou et al. Reference Letsiou, Madesis, Vasdekis, Montemurro, Grigoriou and Skavdis2024). Additionally, the use of markers with different modes of inheritance – biparental for ITS2 and uniparental for rbcL – can help us to detect conflicting phylogenetic signals (Yang et al. Reference Yang, Su, Chang, Foster, Sun and Huang2020). These markers can also be used to identify ‘genetic hotspots’ (i.e., areas characterized by high genetic diversity and unique variants) through comparing genetic patterns across populations. Genetic hotspots can be calculated involving multiple species, outlining high-genetic-diversity areas that can complement existing conservation priorities (Souto et al. Reference Souto, Mathiasen, Acosta, Quiroga, Vidal-Russell, Echeverría and Premoli2015).
Phylogenetic diversity (PD) reflects ecosystem stability and functional diversity, as morphological, physiological and behavioural traits are linked to evolutionary history (Winter et al. Reference Winter, Devictor and Schweiger2013). Estimating PD in genetic hotspots reveals shared evolutionary histories, relationships and uniqueness among species within a community (Schweiger et al. Reference Schweiger, Klotz, Durka and Kühn2008). Since PD highlights unique traits and their potential utility, it can aid conservation efforts alongside data on species richness and genetic diversity (Isaac et al. Reference Isaac, Turvey, Collen, Waterman and Baillie2007, Lean & Maclaurin Reference Lean, Maclaurin, Pellens and Grandcolas2016). Neglecting genetic and phylogenetic factors can lead to the underestimation of extinction risks and derail recovery strategies (Frankham et al. Reference Frankham, Briscoe and Ballou2010, Tucker et al. Reference Tucker, Davies, Cadotte and Pearse2018).
Drylands cover c. 41% of Earth’s surface (Reynolds et al. Reference Reynolds, Smith, Lambin, Turner, Mortimore and Batterbury2007), and, despite their high aridity and poor soils, they harbour numerous vegetation biodiversity hotspots (Maestre et al. Reference Maestre, Benito, Berdugo, Concostrina-Zubiri, Delgado-Baquerizo and Eldridge2021). However, most arid lands are currently under severe desertification and degradation due to human activity, and they require effective conservation and restoration actions to allow the recovery and re-colonization of native plant species (Morris Reference Morris2011, Pérez et al. Reference Pérez, Farinaccio and Aronson2019). In Argentina, drylands cover nearly two-thirds of the country’s territory, and they are facing an increasing desertification threat (Abraham et al. Reference Abraham, Rubio, Salomón, Soria, Torres, Abraham and Pastor2014, Busso & Pérez Reference Busso and Pérez2018, Oyarzabal et al. Reference Oyarzabal, Clavijo, Oakley, Biganzoli, Tognetti and Barberis2018). The largest South American dryland is the Monte Desert, covering 87 683 099 ha (Oyarzabal et al. Reference Oyarzabal, Clavijo, Oakley, Biganzoli, Tognetti and Barberis2018) and home to rich endemic flora and fauna (Morello Reference Morello, Morello, Matteucci, Rodriguez and Silva2012). Its vegetation is mainly dominated by xeric woody species, among which members of the Zygophyllaceae family and species of the genus Neltuma are abundant (Cabrera Reference Cabrera and WF1976). Despite its ecological significance, the Monte Desert has historically received limited attention from conservation organizations. Only 10% of its territory falls within protected areas, with just 1% under the protection of national parks (UNEP-WCMC 2023). Additionally, as in other low-productivity regions worldwide, this area is exposed to anthropogenic pressures, including overgrazing, mining, oil exploitation, urbanization and deforestation, which worsen desertification (Villagra et al. Reference Villagra, Defossé, Del Valle, Tabeni, Rostagno, Cesca and Abraham2009). As is the case in most drylands globally, which have long been regarded as barren landscapes and subjected to intensive grazing practices that have significantly reduced plant species diversity (Tadey Reference Tadey2006, Sassi et al. Reference Sassi, Taraborelli, Borghi and Ojeda2009, Souto et al. Reference Souto, Zalazar, Tadey and Premoli2024), the Monte Desert is projected to become even drier and warmer (Hurtado et al. Reference Hurtado, Calianno, Adduca and Easdale2023).
In this study, we explored the genetic biodiversity of the Monte Desert, assessing the values of genetic diversity and PD in different populations. We aimed to test the hypothesis that the genetic diversity of the Monte Desert vegetation is mostly unprotected. We expected to find several genetic hotspots outside established protected areas of the country, highlighting the relevance of such studies for conservation planning of threatened ecosystems. By mapping genetic hotspots, we sought to complement traditional conservation approaches and emphasize the relevance of conservation research in strengthening the management of protected areas in drylands.
Methods
Sampling
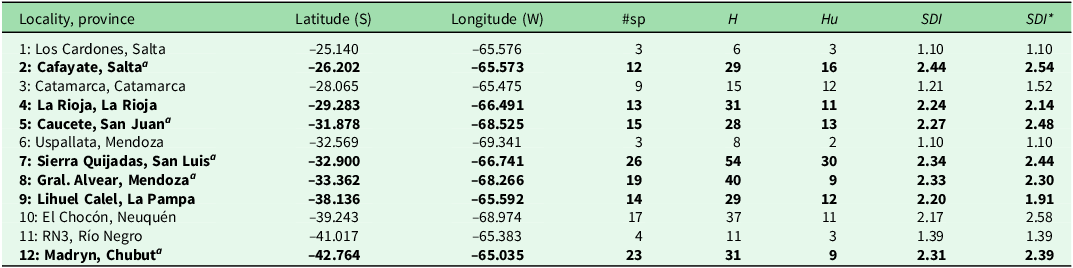
We collected twigs with fresh leaf tissue from dominant woody shrub and tree species at 12 localities across the Monte Desert of Argentina (from –25.14°S, –65.57°W to –42.76°S, –65.03°W). These localities were selected through a random sampling approach, with the additional criterion of ensuring they represented typical unmanaged sites in the region. Given the relatively low species richness in the area, we aimed to sample all dominant woody shrub species at each locality, especially the most abundant or ecologically significant within the vegetation community. To capture this diversity, sample sizes varied between one and five individuals per species, depending on their local abundance (Tables 1 & S1). To reduce the likelihood of sampling genetically related entities, we randomly sampled individuals within each species, maintaining a minimum distance of 50 m between samples. Each sample consisted of a 20 cm-long twig with fresh leaf tissue. The samples were kept dry in paper bags and later processed for DNA extraction in the laboratory. All specimens were deposited in the Herbarium BCRU, Universidad Nacional del Comahue, at Centro Regional Universitario Bariloche, Argentina.
Extraction, amplification and sequencing
DNA extraction and polymerase chain reaction (PCR) amplification of the fragments were conducted using leaf tissue following the Canadian Centre for DNA Barcoding protocols (https://ccdb.ca/resources/). We used the rbcLa-F, rbcLa-R and ITS_S2F, ITS_S2R primers (Kress et al. Reference Kress, Erickson, Jones, Swenson, Perez, Sanjur and Bermingham2009, Cheng et al. Reference Cheng, Xu, Lei, Li, Zhang and Zhou2016), sending the amplified fragments to the Canadian Centre for DNA Barcoding, where the two markers were Sanger sequenced. The forward and reverse sequences obtained for each individual were uploaded to the BOLD Systems v3 database (https://v3.boldsystems.org/). We manually aligned the sequences using MEGA version 6 (Tamura et al. Reference Tamura, Stecher, Peterson, Filipski and Kumar2013) and contrasted them with the National Center for Biotechnology Information (NCBI) database to complement the botanical identification of each sampled individual.
Genetic diversity index
We calculated the number of haplotypes (H) and unique haplotypes (Hu) for both amplified markers combined of each species in each population using GenAlEx (Peakall & Smouse Reference Peakall and Smouse2012). To estimate the genetic variation of each species, we used a genetic diversity and unique variant index (GDUVI; Souto et al. Reference Souto, Mathiasen, Acosta, Quiroga, Vidal-Russell, Echeverría and Premoli2015). We adapted this index as the sum of the rank scores (Hn and Hun for the nuclear marker, Hcp and Hucp for the chloroplast marker) weighted by the number of available parameters, as the sequences obtained sometimes belonged to only one of the molecular markers (Equation 1):
 $${\rm{GDUVI}} = {{{Hn\; + \;Hun\; + \;Hcp\; + \;Hucp}} \over {{ {\rm{\#\;available\;parameters}}}}}\;$$
If sequences for a given marker were unavailable, the argument corresponding to that marker was not included in the equation, as its value was 0. We weighted this GDUVI by ubiquity (Equation 2) to assign higher values to those species that occurred in multiple locations, as they are characteristic of the studied phytogeographic region:
 $${\rm{ubiquity}} = {{{\rm{number}}\;{\rm{of}}\;{\rm{populations}}\;{\rm{where}}\;{\rm{the}}\;{\rm{species}}\;{\rm{is}}\;{\rm{present}}} \over {\matrix{\matrix{\rm \# number\;of\;total\;populations\; \times \hfill \cr \;\# \rm number\;of\;sampled\;individuals\; \hfill \cr \rm of\;the\;species\;in\;a\;given\;population \hfill \cr} \cr } }}$$
We calculated a corrected genetic variation index (GDUVIu; Equation 3):
 $${\rm{GDUVIu}} = {\rm{GDUVI}} \times {\rm{ubiquity}}$$
As the goal of this approach is to preserve the phytogeographical region as a whole, we included ubiquity to prioritize the conservation of recurrent or common species, which might act as umbrella species, and to preserve restricted or endemic species. To test the robustness of the observed spatial pattern of genetic hotspots and to avoid species–genetic diversity correlations, we resampled the GDUVIu parameter using a simple random resampling with replacement algorithm from PopTools version 3.06 (Hood Reference Hood2008). This effectively reduced sampling biases by ensuring that each data point had an equal chance of being selected and by breaking any inherent correlations or imbalances. This led to more reliable and accurate conclusions, particularly when examining complex patterns in the genetic data.
Phylogenetic diversity
Due to the relatively low percentage of variation within species, and to consider PD at the family level, we selected one random individual per species for each hotspot. We used the software jModelTest v2.1.10 (Guindon & Gascuel Reference Guindon and Gascuel2003, Darriba et al. Reference Darriba, Taboada, Doallo and Posada2012) to select the model of sequence evolution using the Akaike information criterion corrected for small sample sizes (AICc) criteria. The best-fitting evolution models for the ITS2 and rbcLa datasets were GTR+G+I and HKY+G+I, respectively. We conducted phylogenetic reconstructions based on Bayesian inference separately on nuclear and chloroplast datasets for each hotspot using BEAST v1.10.4 (Suchard et al. Reference Suchard, Lemey, Baele, Ayres, Drummond and Rambaut2018). The tree prior was always generated under a Yule speciation process (Gernhard Reference Gernhard2008). We set 100 million generation runs, and trees were saved every 1000 generations in each run. Approximately 10% of the trees (corresponding to the burn-in period) were discarded, and a 50% majority rule consensus tree was constructed from the remaining trees. Convergence diagnostics were checked using the software Tracer v1.7.2 (Rambaut et al. Reference Rambaut, Drummond, Xie, Baele and Suchard2018), where all effective sample sizes (ESSs) obtained were higher than 1000 for the ITS tree and higher than 200 for the rbcL tree. We calculated Faith’s PD for each tree as the sum of all phylogenetic branch lengths connecting species in a hotspot, representing phylogenetic history in each locality and capturing functional and form diversity (Faith Reference Faith1992, Owen et al. Reference Owen, Gumbs, Gray and Faith2019).
Mapping hotspots
We mapped genetic hotspots using the Shannon Diversity Index (SDI) routine in DIVA-GIS 7.5.0 (Hijmans et al. Reference Hijmans, Guarino and Macathur2012). This was done by applying the point-to-grid procedure to both of the GDUVIu values of the observed and the resampled data. This procedure returned five ranges of SDI values. Genetic hotspots were defined as localities with SDI values included in the highest range. We interpolated these genetic diversity maps with that of the Monte Desert built based on Oyarzabal et al. (Reference Oyarzabal, Clavijo, Oakley, Biganzoli, Tognetti and Barberis2018; including vegetation units 6, 7, 8, 9, 10, 22, 23, 24, 25, 35, 37, 40, 58 and 61), using the inverse distance weighting interpolation feature in QGIS v 3.3 (QGIS 2024). This method estimated cell values by calculating the means of neighbouring point values, hence creating a continuous gradient between hotspots. We overlapped the resampled genetic diversity map with protected areas (UNEP-CMC 2023) and available mapped permanent plantations (IGN 2021) in the Monte Desert to observe the co-occurrence of genetic hotspots with national or provincial conservation areas and massive plantations.
Results
Genetic hotspots and phylogenetic diversity
We identified 77 species of shrubs and trees belonging to 55 genera and 25 families throughout the Monte Desert. All sampled species were accurately resolved in the phylogeny. Larrea divaricata, Larrea nitida and Larrea cuneifolia showed the highest genetic diversity index corrected by both ubiquity and resampling due to their high number of unique haplotypes and high frequency within populations. Thirty-nine plant species were sampled only once. Most of these species showed low genetic diversity, with only one or two haplotypes (Table S1). For our observation-based genetic hotspots, the highest SDI values calculated by DIVA-GIS ranged between 2.17 and 3.00. Across the Argentine Monte Desert, a total of seven localities were identified as genetic hotspots (Fig. 1a & Table 1). These hotspots mostly corresponded with the higher number of sampled species localities (Fig. S1). Localities with the highest number of haplotypes (H) or the highest number of unique haplotypes (Hu) showed the highest diversity index (Fig. S2). Hotspots with lower Hu values harboured species occurring in multiple locations, so the diversity index increased with ubiquity. For the resampled hotspots, the highest SDI values ranged between 2.10 and 3.00. Resampling showed that five out of the seven obtained hotspots were robust. However, genetic hotspots 4 (La Rioja) and 9 (La Pampa) were not supported by resampling (Fig. 1b). Although robust genetic hotspots were scattered throughout the Monte Desert, three of these hotspots (5, 7 and 8) were located close to each other, forming a ‘mega-hotspot’ in the centre of the Monte Desert.
Genetic hotspot maps showing Shannon’s Diversity Index (SDI) values based on combined nuclear and chloroplast markers for 12 localities in Argentina’s Monte Desert, numbered as in Table 1 and indicated with triangles. (a) SDI map calculated using the ubiquity-corrected genetic diversity and unique variant index (GDUVIu) metric. (b) SDI map calculated using the resampled GDUVIu metric. The sampled area within Argentina’s Monte Desert is outlined in black on the South American map in the upper-right corner.

Sampled localities, provinces and geographic coordinates. Genetic hotspots are indicated in bold.

a Hotspots supported by resampling.
#sp = number of sampled species; H = total number of haplotypes; Hu = unique haplotypes; SDI = Shannon Diversity Index per locality; SDI* = resampled Shannon Diversity Index per locality for both genetic markers combined.
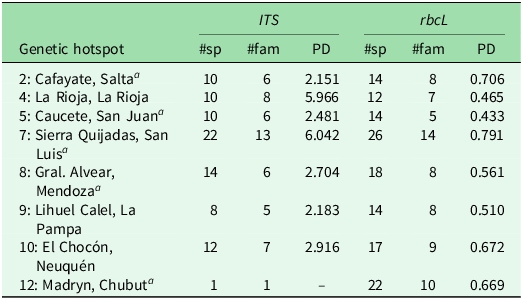
Although the nuclear and chloroplast markers showed different patterns in terms of Faith’s PD (Figs S3 & S4), a higher PD most often corresponded to a higher number of sampled families (Table 2 & Figs S5 & S6). Overall, PD was higher for ITS than for rbcLa, as the nuclear marker contains more variable sites. Consequently, chloroplast PD showed less variation among localities. Moreover, hotspot 4 (La Rioja) displayed higher nuclear PD but lower chloroplast PD than most other hotspots, along with one of the lowest genetic diversity values and the fewest species. Hotspot 7 (San Luis) demonstrated the highest nuclear and chloroplast PD values and held the highest number of sampled species.
Identified genetic hotspots.

a Hotspots supported by resampling.
#sp = total number of sampled species; #fam = number of sampled families; PD: estimated phylogenetic diversity for each barcode marker (ITS and rbcL).
Protected areas and permanent plantations
The robust genetic hotspots obtained by resampling genetic diversity did not overlap strongly with protected areas in the Monte Desert (Fig. 2). The only genetic hotspot included in a national park protected area was Sierra de las Quijadas (hotspot 7). El Chocón in Neuquén province (hotspot 10) was close to but not included in El Mangrullo and Valle Cretácico protected areas in Neuquén and Río Negro, respectively. The genetic hotspots detected in Chubut (hotspot 12) and Mendoza (hotspot 8) were located far from protected areas. Moreover, two central Monte Desert hotspots, 5 and 8, were surrounded by extensive permanent plantations.
Genetic hotspot map showing Shannon’s Diversity Index (SDI) values based on combined nuclear and chloroplast markers for 12 localities in Argentina’s Monte Desert, numbered as in Table 1 and indicated with triangles. SDI map calculated using the resampled ubiquity-corrected genetic diversity and unique variant index (GDUVIu) metric, overlapped with protected areas (in grey) and permanent plantations (in violet). The sampled area within Argentina’s Monte Desert is outlined in black on the South American map in the upper-right corner.

Discussion
Our results highlight the importance of complementing traditional biodiversity conservation planning with mapping of genetic hotspots of woody species using widely available barcode sequence data from open-access repositories such as GenBank (Sayers et al. Reference Sayers, Cavanaugh, Clark, Pruitt, Sherry, Yankie and Karsch-Mizrachi2023) and BOLD (Ratnasingham & Hebert Reference Ratnasingham and Hebert2007). We identified five genetic hotspots across the Monte Desert, suggesting that the northern, central and southern subregions harbour high genetic variation and unique genetic variants. Alarmingly, most of these genetic hotspots lie outside protected areas, with two of them located close to extensive commercial plantations. Barcode markers here represented a cost-effective tool for identifying and mapping genetic hotspots for multiple species. When combined with protected area data, they facilitate the rapid assessment of species conservation status, which complements current conservation priorities.
Widespread species with large population sizes are expected to have higher levels of genetic variation than species with smaller ranges and population sizes, which leads to greater evolutionary potential and the adaptation capability to overcome environmental changes (Hamrick & Godt Reference Hamrick, Godt, Brown, Clegg, Kahler and Weir1990, Mitton Reference Mitton1997). Among the sampled species, three members of the genus Larrea (L. divaricata, L. cuneifolia and L. nitida) demonstrated the greatest genetic diversity. Larrea species, being some of the most widespread and abundant in the Monte Desert, play a critical role in maintaining ecosystem structure and supporting other organisms that depend on them for forage and shelter (Tadey & Farji-Brener Reference Tadey and Farji-Brener2007, Pelliza et al. Reference Pelliza, Fernandez, Saiz and Tadey2021, Tadey Reference Tadey2023), and thus they may constitute keystone and umbrella species (Wilcox Reference Wilcox, McNeely and Miller1984, Bond Reference Bond1994).
In the Monte Desert, protected areas cover 9 130 000 ha, representing less than 10% of its extent. We found minimal overlap between genetic hotspots and protected areas in the studied region (Fig. 2). Although these areas are legally protected, many are severely degraded and lack effective conservation plans. As a result, they are extensively used for livestock grazing and recreational activities, often without proper management (e.g., El Mangrullo in Neuquén Province; Lavalle & Bertani Reference Lavalle and Bertani2005, Duval et al. Reference Duval, Benedetti and Campo2017). Moreover, hotspots 5 (San Juan) and 8 (Mendoza) are surrounded by plantations of intensive agricultural use in desert regions, which reduce natural vegetation and can pose additional threats to arid zones such as contamination and the invasion of alien species (Liu et al. Reference Liu, Xue, Gui, Lei, Sun, Lv and Zhang2018). The discordance found between genetic diversity and conservation efforts is especially worrisome in the Patagonian part of the Monte Desert, particularly in Chubut province (hotspot 12), as it is one of the regions most threatened by desertification (Boeri Reference Boeri2016).
Chehébar et al. (Reference Chehébar, Novaro, Iglesias, Walker, Funes, Tammone and Didier2013) identified key areas for biodiversity conservation across the Monte Desert based on the level of endemism, rarity and the threat faced by focal species. These areas are considered irreplaceable and priority sites, requiring the systematic implementation of conservation actions. Other studies focused on drylands have found similar mismatches between evolutionary hotspots and protected areas, also coupled with significant overlaps between hotspots and disturbed areas, such as major populations (e.g., in the Mojave and Sonoran deserts: Vandergast et al. Reference Vandergast, Inman, Barr, Nussear, Esque and Hathaway2013, Wood et al. Reference Wood, Vandergast, Barr, Inman, Esque, Nussear and Fisher2013). These findings underscore the importance of science-based planning when establishing and managing protected areas. Given the distribution of genetic hotspots found in this study, we recommend that each subregion of the Monte Desert should contain at least one protected area under appropriate management. While our selection is based on genetic diversity, these hotspots also represent key habitats for woody plant species in the Monte Desert, suggesting their ecological importance. Additionally, we propose involving land managers and stakeholders in protecting key species to explore feasible conservation strategies, such as private reserves, payments for ecosystem services or sustainable land-use agreements. Engaging the local community in these efforts can help ensure more effective and sustainable protection of these critical areas (Wali et al. Reference Wali, Alvira, Tallman, Ravikumar and Macedo2017).
While identifying genetic hotspots provides a valuable foundation for conservation planning in the Monte Desert, it is important to acknowledge that implementing conservation actions in these areas is limited by socio-political factors. Land tenure complexity, limited resources for protected area expansion and competing land uses such as agriculture or livestock grazing could pose challenges. The agricultural frontier in Argentina has been expanding into the Monte Desert over the last decades, leading to native vegetation loss (Volante & Paruelo Reference Volante and Paruelo2015, Huaranca et al. Reference Huaranca, Iribarnegaray, Albesa, Volante, Brannstrom and Seghezzo2019). Additionally, fragmented land ownership and varying provincial-level conservation priorities may complicate coordinated efforts. Recognizing these limitations is essential for translating genetic data into effective, context-sensitive conservation strategies and evidence-informed policymaking.
Genetic hotspots and taxonomic data can help estimate a community’s evolutionary uniqueness by calculating PD, thereby identifying areas of high evolutionary irreplaceability (Forest et al. Reference Forest, Grenyer, Rouget, Davies, Cowling and Faith2007). Our findings show that a high-PD hotspot (4) has the fewest species, indicating that PD can be independent of species richness (Forest et al. Reference Forest, Grenyer, Rouget, Davies, Cowling and Faith2007, Tucker & Cadotte Reference Tucker and Cadotte2013). This decoupling is more common in high-endemism regions such as the Monte Desert (Rodrigues et al. Reference Rodrigues, Brooks, Gaston, Purvis, Gittleman and Brooks2005). In addition, relying solely on species richness may lead us to overlook evolutionary potential, as PD does not always align with genetic diversity. For example, hotspot 2, despite having the highest genetic diversity index, had the lowest nuclear PD. This discrepancy arises because genetic diversity measures variation within species, whereas PD reflects the evolutionary relationships among species in a given locality. Specifically, hotspot 2 contained many unique haplotypes, yet the species were closely related. These differences underscore the value of incorporating PD and genetic diversity in conservation planning, particularly for preserving ecosystem functions and resilience (Faith Reference Faith1992, Tietje et al. Reference Tietje, Antonelli, Forest, Govaerts, Smith and Sun2023).
The traditional hotspot approach considers species richness in a region, whereas genetic hotspots highlight areas with high genetic diversity and unique variants, prioritizing polymorphisms. Protecting these unique genetic variants can enhance the ability of species’ populations to evolve and adapt to ongoing environmental changes and diverse selection pressures. However, this methodology is limited to organisms with DNA barcodes that allow a certain level of variation. In cases where selected barcodes are invariant, genetic hotspots should be constructed using other types of genetic markers. Nevertheless, relying on a single molecular marker may hinder the accurate estimation of genetic and taxonomic diversity within a community, as it may fail to distinguish between closely related taxa (Theissinger et al. Reference Theissinger, Fernandes, Formenti, Bista, Berg and Bleidorn2023). Using additional markers would provide more comprehensive genome coverage and a broader view of the genetic variation between individuals. In addition, more expensive, whole-genome approaches would enable the detection of single-nucleotide polymorphisms and a wider range of genetic variants.
Developing evidence-based conservation strategies to preserve genetic biodiversity is crucial in light of predicted climate change (Hartman et al. Reference Hartman, Merchant, Parton, Gutmann, Lutz and Williams2011), which could significantly affect ecosystem productivity (Ciais et al. Reference Ciais, Reichstein, Viovy, Granier, Ogée and Allard2005, Gazol et al. Reference Gazol, Camarero, Vicente-Serrano, Sánchez-Salguero, Gutiérrez and de Luis2018). As climate change is expected to generate drier and warmer conditions in the Monte Desert, Larrea species are projected to suffer habitat suitability losses or range shifts by 2070 (Souto et al. Reference Souto, Zalazar, Tadey and Premoli2024), possibly affecting the rest of the ecosystem that depends on them. Our results suggest that current protected areas poorly preserve genetic hotspots and that conducting research on dominant plant species, as well as establishing protected areas through evidence-informed policymaking, are critical to reversing the current global species extinction crisis. Recognizing genetic hotspots as a conservation priority, combined with policies aimed at slowing climate change, could aid in preserving the evolutionary potential of populations and in mitigating the projected future trends of biodiversity loss.
Conclusions
This study provides additional evidence for adopting scientifically supported and proactive conservation planning measures to cope with future environmental changes. According to the UN Environment Programme World Conservation Monitoring Centre (UNEP-WCMC 2023), only 8.69% of the terrestrial surface is under a protected area. We suggest increasing efforts to preserve as many vulnerable regions as possible, ensuring that protected areas have appropriate management to guarantee long-term ecosystem resilience. Our results confirm the urgency to build a regional action plan to preserve plant species’ genetic resources in South America’s largest dryland, the Monte Desert, and they also serve as a baseline study of these woody plants’ biodiversity. Drylands play a key role in mitigating both short- and long-term climate disruptions due to their ability to sequester carbon, and their conservation should be a priority (Meyer Reference Meyer2011). With this genetic hotspot assessment, we aim to bring attention to an understudied region of the world and to support the development of conservation and management plans. The increasing availability of DNA barcode data represents a substantial opportunity for conservation planners in other vulnerable regions across the globe to identify and focus conservation efforts on genetic hotspots.
Supplementary material
Supplementary material for this article can be found at https://doi.org/10.1017/S037689292510009X.
Acknowledgements
We thank Paula Mathiasen for statistical advice and the editor and two anonymous reviewers for their helpful comments that improved the clarity and quality of this manuscript.
Financial support
This research was carried out in the framework of the iBOL (International Barcode of Life) project funded by the National Council of Science of Argentina CONICET (projects ‘Barcoding species from the Monte Desert’ and ‘Barcoding shrub species from the Monte Desert’).
Competing interests
The authors declare that they have no known competing financial interests or personal relationships that could have appeared to influence the work reported in this paper.
Ethical standards
Not applicable.