1 Introduction
In the classical Kolmogorov–Richardson picture of turbulence, a turbulent flow is characterized by a hierarchy of self-similar scales. This picture becomes increasingly inaccurate at smaller and smaller scales, where intermittent burst of energy dissipation and transfer take place (Kolmogorov Reference Kolmogorov1962). A classical quantification of such intermittency is via the anomalous deviation of the scaling properties of the velocity structure functions from the simplistic Kolmogorov (Reference Kolmogorov1941a
) scaling. The velocity structure functions are defined as successive moments
 $S_{n}(r)=\langle |\unicode[STIX]{x1D6FF}u_{L}|^{n}\rangle$
of
 $\unicode[STIX]{x1D6FF}u_{L}=\boldsymbol{r}\boldsymbol{\cdot }(\boldsymbol{u}(x+r)-\boldsymbol{u}(x))/r$
the longitudinal velocity increments over a distance
 $r$
. In numerical simulations, the longitudinal increments are easily accessible over the whole range of scales of the simulations, but the scaling ranges and the maximal order
 $n$
are limited by numerical resources. In experiments, large Reynolds numbers and large statistics are easily accessible, but the computation of
 $S_{n}(r)$
faces practical challenges. One-point velocity measurements based e.g. on hot-wire or laser Doppler velocimetry (LDV) techniques provide time-resolved measurements over three or four decades, that can be used to compute the structure functions only via the so-called Taylor’s frozen flow hypothesis
 $r=U\unicode[STIX]{x0394}t$
, where
 $U$
is the mean flow velocity at the probe location. This rules out the use of this method in ideal homogeneous isotropic turbulence, where
 $U=0$
. Most of the experimental reports on structure function scalings relied on this method and not surprisingly, most of these results are from turbulent flows with an open geometry (e.g. turbulence downstream of grids, jets and the atmospheric boundary layer) where there is a strong mean flow. The common practice is to keep the ratio
 $u^{\prime }/U$
small, preferably less than
 $10\,\%$
(
 $u^{\prime }$
being the standard deviation of the velocity). A summary of these results could be found in e.g. Arneodo et al. (Reference Arneodo, Baudet, Belin, Benzi, Castaing, Chabaud, Chavarria, Ciliberto, Camussi, Chilla and Dubrulle1996). For closed turbulent flows such as the von Kármán swirling flows, the best attempts (Maurer, Tabeling & Zocchi Reference Maurer, Tabeling and Zocchi1994; Belin, Tabeling & Willaime Reference Belin, Tabeling and Willaime1996) were to place the point measurement probes at locations where
 $U$
is strongest, specifically where
 $U$
has a substantial azimuthal component. Even then, one had to resort to measurements with a ratio of
 $u^{\prime }/U$
of up to
 $38\,\%$
. At the same time, it is not understood how the curve geometry of the mean flow profile affects the validity of the Taylor hypothesis (this concern does not appear in open flows where
 $\boldsymbol{U}$
is predominantly rectilinear). Nevertheless, these experiments discerned a power-law regime of the velocity structure functions of comparable quality with the results from open turbulence. When the various results on the scaling exponents were compared by Arneodo et al. (Reference Arneodo, Baudet, Belin, Benzi, Castaing, Chabaud, Chavarria, Ciliberto, Camussi, Chilla and Dubrulle1996), the result from von Kármán flows gave values distinctly lower values than those of open turbulence (which are among themselves consistent). This difference, among other reasons, had prompted the suggestion that different classes of flows possess different sets of exponents (Sreenivasan & Antonia Reference Sreenivasan and Antonia1997). Besides von Kármán flow, another branch of results on closed turbulent flow of the Couette–Taylor type was carried out, also utilizing Taylor’s hypothesis, by Lewis & Swinney (Reference Lewis and Swinney1999) and Huisman, Lohse & Sun (Reference Huisman, Lohse and Sun2013). Remarkably, Lewis et al.’s results on the exponents beyond order six were also consistently lower than the open flow results, and their highest Reynolds number measurements were remarkably close to those of Belin et al. (Reference Belin, Tabeling and Willaime1996). Huisman et al. reported results up to order six that suggested universality of the exponents with respect to changing of the large scale symmetry (by changing the ratio of rotation of the cylinders) and to Reynolds number. Here, using a technique that does not rely on the Taylor hypothesis, we report scaling exponents from von Kármán flows that are consistent with the results from open flows (Anselmet et al.
Reference Anselmet, Gagne, Hopfinger and Antonia1984; Stolovitzky, Sreenivasan & Juneja Reference Stolovitzky, Sreenivasan and Juneja1993; Arneodo et al.
Reference Arneodo, Baudet, Belin, Benzi, Castaing, Chabaud, Chavarria, Ciliberto, Camussi, Chilla and Dubrulle1996), as well as the results from numerical simulations (Ishihara, Gotoh & Kaneda Reference Ishihara, Gotoh and Kaneda2000; Gotoh, Fukayama & Nakano Reference Gotoh, Fukayama and Nakano2002) and theory of (She & Leveque Reference She and Leveque1994). We close this section by noting that Pinton & Labbé (Reference Pinton and Labbé1994) had attempted to apply their original ‘local Taylor hypothesis’ to a von Kármán experiment but only reported scaling exponents of up to sixth order which they concluded to be consistent with other results of open flows and thus also with our results.
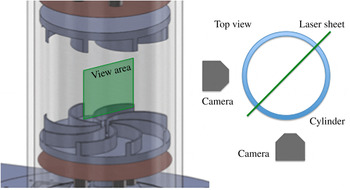
Sketch of the apparatus. Velocity fields are observed in a two-dimensional area on a laser sheet centred on the centre of the experiment (equal distance from the impellers and on the axis of the cylindrical tank). Two cameras view the observation area at angles approximately
 $45^{\circ }$
from the laser sheet.

2 Overview of methods
Direct measurement of spatial increments of velocity can be obtained via the particle image velocimetry method (PIV). A detailed description of the set-up has been previously provided in Saw et al. (Reference Saw, Kuzzay, Faranda, Guittonneau, Daviaud, Wiertel-Gasquet and Dubrulle2016); here we provide a concise description. The fluid is seeded with hollow glass particles (Dantec Dynamics) with mass density of
 $1.4~\text{g}~\text{cm}^{-3}$
and size
 $10{-}30~\unicode[STIX]{x03BC}\text{m}$
, giving particle Kolmogorov scale Stokes number, in order of increasing flow Reynolds numbers, of the order of
 $10^{-4}$
–
 $10^{-2}$
, while the settling parameter, i.e. ratio of Stokes to Froude number, is of the order of
 $10^{-3}$
or smaller. The particles are illuminated by a thin laser sheet (1 mm thick) in the centre of the cylindrical tank (see figure 1 for a sketch). Two cameras, viewing at an oblique angle from either side of the laser sheet, take successive snapshots of the flow. The velocity field is then reconstructed across the quasi-two-dimensional laser sheet using peak correlation performed over small interrogation windows. This method provides measurements of three velocity components on a two-dimensional grid. However, the limited width of the measured velocity field (due to finite camera sensor size), coarse graining of the reconstruction methods and optical noise, usually limit the range of accessible scales, making the determination of the power-law regime ambiguous, thus limiting the accuracy of the measured scaling properties of the structure functions. As we discuss in the present communication, these limitations can be overcome by combining multi-scale imaging and a universality hypothesis. In the original Kolmogorov self-similar theory (K41), for any
 $r$
in the inertial range,
 $S_{n}(r)=C_{n}\unicode[STIX]{x1D716}^{n/3}r^{n/3}$
, where
 $\unicode[STIX]{x1D716}$
is the (global) average energy dissipation and
 $C_{n}$
is a
 $n$
-dependent constant. In such a case, the function
 $S_{n}(r)/(\unicode[STIX]{x1D716}\unicode[STIX]{x1D702})^{n/3}$
is a universal function (a power law) of
 $r/\unicode[STIX]{x1D702}$
, where
 $\unicode[STIX]{x1D702}=(\unicode[STIX]{x1D708}^{3}/\unicode[STIX]{x1D716})^{1/4}$
is the Kolmogorov scale and
 $\unicode[STIX]{x1D708}$
is the liquid’s kinematic viscosity. Such a scaling is the only one compatible with the hypothesis that
 $r$
and
 $\unicode[STIX]{x1D716}$
are the only characteristic quantities in the inertial range. Following Kolmogorov (Reference Kolmogorov1962), one can take into account possible breaking of the global self-similarity by assuming that there exists an additional characteristic scale
 $\ell _{0}$
that matters in the inertial range, so that
 $S_{n}(r)=C_{n}\unicode[STIX]{x1D716}^{n/3}r^{n/3}F_{n}(r/\ell _{0})$
. If there exists a range of scales where
 $F_{n}(x)\sim x^{\unicode[STIX]{x1D6FC}_{n}}$
, then one can write
 $S_{n}(r)=C_{n}\unicode[STIX]{x1D716}^{n/3}\ell _{0}^{-(\unicode[STIX]{x1D701}_{n}-n/3)}r^{\unicode[STIX]{x1D701}_{n}}$
, where
 $\unicode[STIX]{x1D701}_{n}=n/3+\unicode[STIX]{x1D6FC}_{n}$
. In such a case,
 $G_{n}(r)=S_{n}(r)/(\unicode[STIX]{x1D716}\unicode[STIX]{x1D702})^{n/3}(\ell _{0}/\unicode[STIX]{x1D702})^{\unicode[STIX]{x1D701}_{n}-n/3}$
is a universal function (a power law) of
 $r/\unicode[STIX]{x1D702}$
. Here, we use this to rescale our measurements taken in the same geometry, but with different
 $\unicode[STIX]{x1D716}$
and
 $\unicode[STIX]{x1D702}$
. We may then collapse these in the inertial range into a single (universal) structure function by considering
 $G_{n}(r)$
as a function of
 $r/\unicode[STIX]{x1D702}$
. The quality of the collapse depends crucially on the intermittency parameter
 $(\unicode[STIX]{x1D6FC}_{n}=\unicode[STIX]{x1D701}_{n}-n/3)$
for large values of
 $n$
, as
 $\unicode[STIX]{x1D6FC}_{n}$
increases with
 $n$
: a bad choice of
 $\unicode[STIX]{x1D6FC}_{n}$
results in a strong mismatch of two measurements taken at the same
 $r/\unicode[STIX]{x1D702}$
but different
 $\unicode[STIX]{x1D702}$
. Moreover, the global slope (in a log–log plot) of the collapsed data representing
 $G_{n}(r/\unicode[STIX]{x1D702})$
can also be used to compute the effective scaling exponent
 $\unicode[STIX]{x1D701}_{n}$
(and also
 $\unicode[STIX]{x1D6FC}_{n}$
), therefore providing a strong consistency check for the estimated value of
 $\unicode[STIX]{x1D701}_{n}$
. The bonus with the computation of the global slope is that by a proper choice of
 $\unicode[STIX]{x1D716}$
(which gives
 $\unicode[STIX]{x1D702}$
via
 $(\unicode[STIX]{x1D708}^{3}/\unicode[STIX]{x1D716})^{1/4}$
) and
 $\ell _{0}$
, it can be performed over a wider inertial range, therefore allowing a more precise estimate of
 $\unicode[STIX]{x1D701}_{n}$
. In the sequel, we examine the effectiveness of this approach.
3 Experimental flow field
We use an experimental von Kármán set-up that has been especially designed to allow for long-time (up to hours) measurement of flow velocity to accumulate enough statistics for reliable data analysis. Turbulence is generated by two counter-rotating impellers, in a cylindrical vessel of radius
 $R=10~\text{cm}$
filled with a water–glycerol mixture (see Saw et al.
Reference Saw, Kuzzay, Faranda, Guittonneau, Daviaud, Wiertel-Gasquet and Dubrulle2016, for a detailed description). We perform our measurements in the centre region of the flow, with viewing areas of
 $4\times 4~\text{cm}^{2}$
(except in one case where it is
 $20\times 20~\text{cm}^{2}$
, i.e. case D in table 1), located on a meridian plane, around the symmetry point of the experimental set-up (see figure 1). At this location, a shear layer induced by the differential rotation produces strong turbulent motions. Previous study of intermittency in such a set-up has been performed via one-point velocity measurements (hot-wire method) located above the shear layer or near the outer cylinder, where the mean velocity is non-zero (Maurer et al.
Reference Maurer, Tabeling and Zocchi1994; Belin et al.
Reference Belin, Tabeling and Willaime1996). The scaling properties of structure functions up to
 $n=6$
were performed by measuring the scaling exponents
 $\unicode[STIX]{x1D701}_{n}$
via
 $S_{n}(r)\sim r^{\unicode[STIX]{x1D701}_{n}}$
, using the assumption of Taylor’s frozen turbulence hypothesis and the extended self-similarity (ESS) technique (Benzi et al.
Reference Benzi, Ciliberto, Tripiccione, Baudet, Massaioli and Succi1993). The resulting
 $\unicode[STIX]{x1D701}_{n}$
values were significantly lower than those from open turbulent flows (Arneodo et al.
Reference Arneodo, Baudet, Belin, Benzi, Castaing, Chabaud, Chavarria, Ciliberto, Camussi, Chilla and Dubrulle1996). The
 $\unicode[STIX]{x1D701}_{n}$
values from open turbulence flows summarized in Arneodo et al. (Reference Arneodo, Baudet, Belin, Benzi, Castaing, Chabaud, Chavarria, Ciliberto, Camussi, Chilla and Dubrulle1996) are reproduced here (in the next section) for comparison. Here, we use stereo PIV (SPIV) measurements of the velocities to compute the longitudinal structure function up to the ninth order without using the Taylor hypothesis (only velocity components in the measurement plane are used). Our multi-scale imaging provides the possibility to access scales of the order of (or smaller than) the dissipative scale, in a fully developed turbulent flow. The dissipative scale
 $\unicode[STIX]{x1D702}$
is proportional to the experiment size, and decreases with increasing Reynolds number. Tuning of the dissipative scale is achieved through viscosity variation, using different fluid mixtures of glycerol and water. Combined with variable optical magnifications, we may then adjust our resolution, to span a range of scales between
 $\unicode[STIX]{x1D702}$
to almost
 $10^{4}\,\unicode[STIX]{x1D702}$
, achieving approximately 1.5 decades of inertial range. Table 1 summarizes the parameters corresponding to the different cases. All cases are characterized by the same value of non-dimensional global energy dissipation
 $\unicode[STIX]{x1D716}_{g}=0.045$
(non-dimensionalized using the radius of tank
 $R$
and
 $2\unicode[STIX]{x03C0}F$
, where
 $F$
is the frequency of the impellers), measured through independent torque acquisitions. However, since the von Kármán flow is globally inhomogeneous, the local non-dimensional energy dissipation may vary from case to case (Kuzzay, Faranda & Dubrulle Reference Kuzzay, Faranda and Dubrulle2015), and has to be estimated using local measurements, as we detail below.
Parameter space describing the cases considered in this paper.
 $\unicode[STIX]{x0394}x$
is the spatial resolution of our measurements;
 $\unicode[STIX]{x1D716}_{g}$
is the global non-dimensional energy dissipation (non-dimensionalized using the radius of tank (
 $R$
) and
 $2\unicode[STIX]{x03C0}F$
, where
 $F$
is the frequency of the impellers) measured through torques, while
 $\unicode[STIX]{x1D716}_{v}$
is the local non-dimensional energy dissipation estimated via the second-order structure function (see the text for information regarding how it is estimated);
 $\unicode[STIX]{x1D702}$
is the Kolmogorov scale (estimated using
 $\unicode[STIX]{x1D708}$
and
 $\unicode[STIX]{x1D716}_{v}$
). Liquid temperature is
 $20\,^{\circ }\text{C}$
unless otherwise specified.

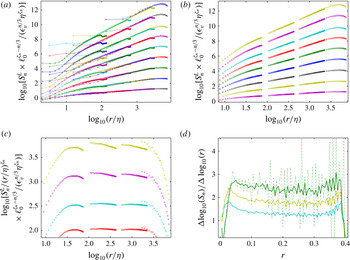
Longitudinal structure functions (up to ninth order) rescaled using the intermittent scaling relation. (a) Plots showing all data points from all cases (A though D). (b) Cropped structure functions where in each case, the segments of the data affected by measurement noise (small
 $r$
) and by finite measurement volume (large
 $r$
) are removed. (c) Same as (b) but only showing
 $S_{6}^{L}$
to
 $S_{9}^{L}$
(from bottom to top) and each curve is compensated using the global
 $\unicode[STIX]{x1D701}_{n}$
given in table 2. (d) Local slopes,
 $\unicode[STIX]{x0394}\text{log}_{10}(S_{n})/\unicode[STIX]{x0394}\text{log}_{10}(r)$
versus
 $r$
for case B. Solid lines from top to bottom are for
 $n=9,6,4$
respectively and they are smoothed by a running average method. The dashed line shows the respective un-smoothed data. The curve fitting range is selected as the intermediate part by removing the strongly varying or fluctuating parts at small and large
 $S_{3}$
.

4 Results
4.1 Velocity increments and structure functions
Local velocity measurements are performed using SPIV, providing the radial, axial and azimuthal velocity components on a meridional plane of the flow through a time series of 30 000 independent time samples. In the sequel, we work with dimensionless quantities, using
 $R$
as the unit of length, and
 $(2\unicode[STIX]{x03C0}F)^{-1}$
as the unit of time,
 $F$
being the rotational frequency of the impellers. Formally, since we use a 50 % overlapping interrogation box, the spatial resolution of our measurement is twice the grid spacing
 $\unicode[STIX]{x1D6FF}x$
, which depends on the cameras’ resolution, the field of view and the size of the windows used for velocity reconstruction. We use 2M-pixels cameras at two different optical magnifications, to obtain one set of measurements with a field of view covering the whole space between the impellers with an area of approximately
 $20\times 20~\text{cm}^{2}$
(
 $\unicode[STIX]{x1D6FF}x=2.4~\text{mm}$
,
 $32\times 32$
pixel interrogation windows), and three sets with a field of view of
 $4\times 4~\text{cm}^{2}$
centred at the centre of the experiment (cases A and C with
 $16\times 16$
pixel windows,
 $\unicode[STIX]{x1D6FF}x=0.24~\text{mm}$
, and case B with
 $32\times 32$
pixel windows,
 $\unicode[STIX]{x1D6FF}x=0.48~\text{mm}$
). The velocities measured using PIV have uncertainties due to random fluctuations (fluctuating number of particles in each interrogation window, optical noise etc.) and averaging error (velocities are smoothed over the interrogation window, thickness of laser sheet). These may result in unreliable calculation of velocity differences at the smallest distances. Thus velocity differences at the smallest distances are removed from further analysis (more on this below). Since we are interested only in statistics of the velocity field in the inertial subrange of turbulence, we remove the large scale inhomogeneous artefact of the swirling flow by subtracting the long-time average from each instantaneous velocity field. Using the in-plane components of the velocities and spatial separations, we then compute the velocity increments as
 $\unicode[STIX]{x1D6FF}\boldsymbol{u}(\boldsymbol{r})=\boldsymbol{u}(\boldsymbol{x}+\boldsymbol{r})-\boldsymbol{u}(\boldsymbol{x})$
,
 $\boldsymbol{x}$
and
 $\boldsymbol{r}$
being the position and spatial increment vectors in our measurement plane. From this, we obtain the longitudinal structure functions via the longitudinal velocity increment
 $\unicode[STIX]{x1D6FF}u_{L}(r)=\unicode[STIX]{x1D6FF}\boldsymbol{u}(\boldsymbol{r})\boldsymbol{\cdot }\boldsymbol{r}/r$
:
 $$\begin{eqnarray}S_{n}(r)=\langle (\unicode[STIX]{x1D6FF}u_{L})^{n}\rangle ,\end{eqnarray}$$
where
 $\langle \rangle$
means average over time, all directions and the whole view area. Our statistics therefore include approximately
 $10^{9}$
–
 $10^{10}$
samples (depending on the increment length), allowing convergence of the structure functions up to
 $n=9$
in the inertial ranges (more details below). The structure functions (
 $S_{n}$
) are shown in figure 2, where we have conjoined the four cases (A–D) by rescaling the structure function in each case as
 $S_{n}\times {\ell _{0}}^{\unicode[STIX]{x1D701}_{n}-n/3}/({\unicode[STIX]{x1D716}_{v}}^{n/3}\,\unicode[STIX]{x1D702}^{\unicode[STIX]{x1D701}_{n}})$
and the abscissa as
 $r/\unicode[STIX]{x1D702}$
where
 $\unicode[STIX]{x1D701}_{n}$
is the corresponding scaling exponent of the structure function in the manner
 $S_{n}(r)=C_{n}(\unicode[STIX]{x1D716}r)^{n/3}(r/\ell _{0})^{\unicode[STIX]{x1D701}_{n}-n/3}$
, with
 $\ell _{0}$
the characteristic large scale of the flow which we take as equal to the radius of the impellers (more on the computation of
 $\unicode[STIX]{x1D701}_{n}$
and the choice of
 $\ell _{0}$
in § 4.3). We note that in doing so, we have used the more general form of the scaling relation for the structure functions that takes into account turbulent intermittency (as described earlier), with the K41 theory recovered if
 $\unicode[STIX]{x1D701}_{n}=n/3$
. As illustrated in figure 2(a), in each segment of the
 $S_{n}$
curve represented by a single colour, the behaviour of
 $S_{n}$
at its large scale limit is altered by finite size effects, while at the small scale end it is polluted by measurement uncertainties or lack of statistical convergence. We thus remove these limits and keep only the intermediate power-law-like segments for the analysis of the scaling exponents below; the results are displayed in figure 2(b,c) (note: for illustrative purposes we also show the dissipative scales of case A and the largest scales of case D which would correspond to the large eddy scale). Specifically, data cropping is done by inspecting the, albeit noisy, local slope plots i.e.
 $\unicode[STIX]{x0394}\text{log}_{10}(S_{n})/\unicode[STIX]{x0394}\text{log}_{10}(r)$
versus
 $\text{log}_{10}(r)$
as exemplified by figure 2(d). We remove the strongly varying or fluctuating parts at small and large
 $r$
(based on smoothed data). However in cases B and C, further removal of points at small
 $r$
was performed in view of unsatisfactory statistical convergence (see the discussion for details on data convergence). The retained ranges are respectively for cases A–D,
 $\text{log}_{10}(r/\unicode[STIX]{x1D702})\in (1.5,1.87),(2.02,2.63),(2.75,3.35),(3.2,3.35).$
In the sequel, we discuss the computations of the kinetic energy dissipation rates and scaling exponents (
 $\unicode[STIX]{x1D701}_{n}$
) used in figure 2.
4.2 Determination of local energy dissipation rate
We use the local average kinetic energy dissipation rate,
 $\unicode[STIX]{x1D716}_{v}$
, to rescale the structure functions. For this, we need accurate measurements of
 $\unicode[STIX]{x1D716}_{v}$
. We determine
 $\unicode[STIX]{x1D716}_{v}$
for the four cases in two steps. In step one, we first determine
 $\unicode[STIX]{x1D716}_{v}$
in case A, where our data span both the dissipative and the lower inertial scales of turbulence, by constraining the value of
 $\unicode[STIX]{x1D716}_{v}$
such that both scaling laws of the second-order structure function in the inertial subrange (K41) i.e.
 $S_{2}(r)=C_{2}(\unicode[STIX]{x1D716}r)^{2/3}$
and in the dissipative scale i.e.
 $S_{2}(r)=(\unicode[STIX]{x1D716}/15\unicode[STIX]{x1D708})r^{2}$
are well satisfied.
 $C_{2}$
is the universal Kolmogorov constant with a nominally measured value of
 $C_{2}=2$
(see e.g. Pope Reference Pope2000). We note that the dissipative scaling formula implicitly assumes that the average dissipation rate can be replaced by its one-dimensional surrogate, which is expected to be accurate when at least local statistical isotropy is satisfied by the turbulent flow as in our case.
A convenient way to achieve this is by tuning the value of
 $\unicode[STIX]{x1D716}_{v}$
in order to match our
 $S_{2}$
against the form
 $S_{2}=\unicode[STIX]{x1D6FC}\,r^{2/3}/[1+(r/r_{c})^{-2}]^{2/3}$
that contains the correct asymptotic both in the inertial and dissipative limits (this would be stronger than e.g. estimating
 $\unicode[STIX]{x1D716}_{v}$
using inertial subrange data alone). This form was originally obtained by Sirovich, Smith & Yakhot (Reference Sirovich, Smith and Yakhot1994) using the Kolmogorov relation for the third-order structure function (Kolmogorov Reference Kolmogorov1941b
) (4/5-law with exact viscous correction). The constants are further determined by asymptotically matching to the above scaling laws, giving
 $\unicode[STIX]{x1D6FC}=\unicode[STIX]{x1D716}^{2/3}C_{2}$
and
 $r_{c}=(15C_{2}\unicode[STIX]{x1D708}/\unicode[STIX]{x1D716}^{1/3})^{3/4}\equiv (15C_{2})^{3/4}\unicode[STIX]{x1D702}$
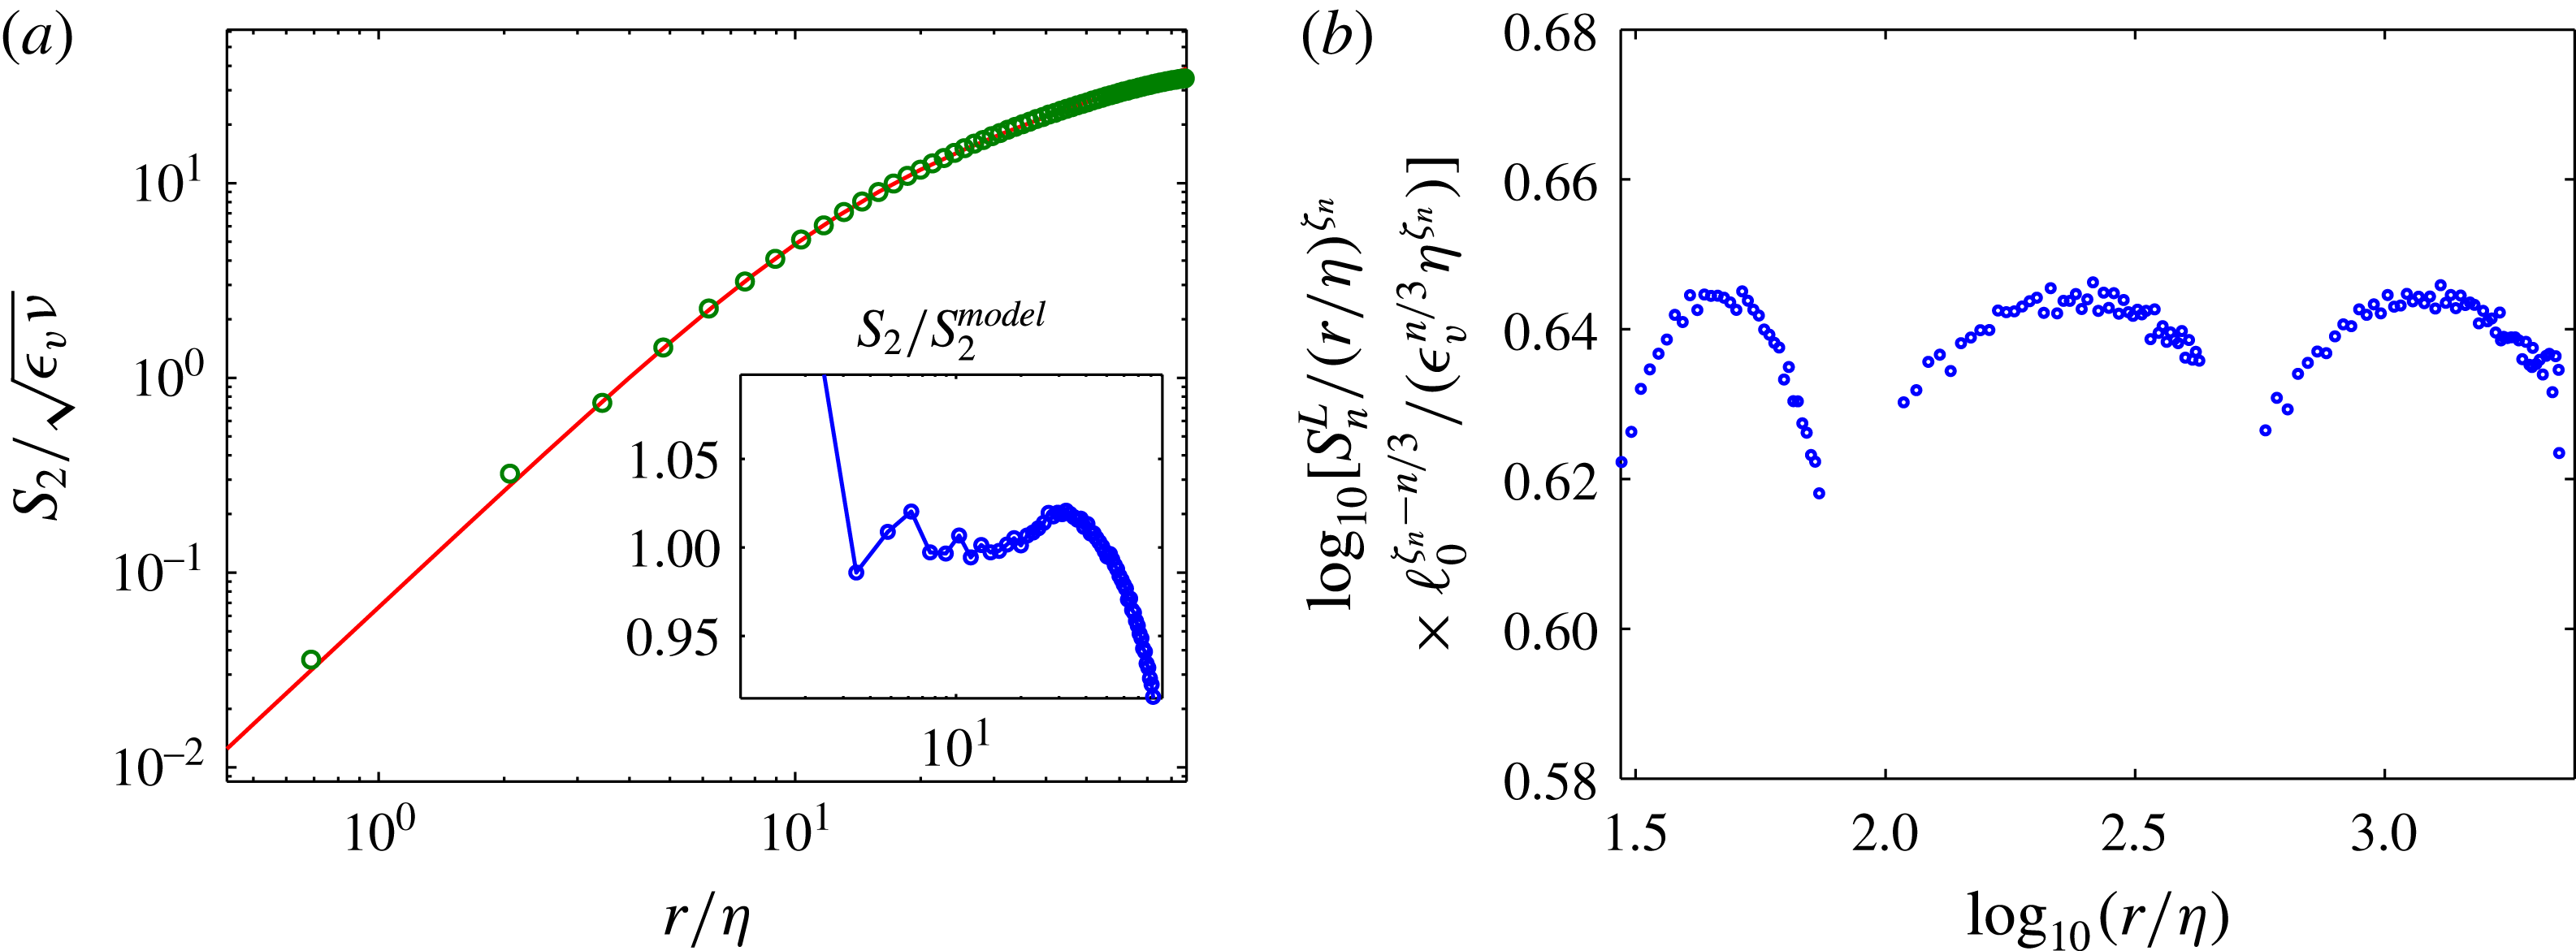
. Figure 3 shows the non-dimensionalized second-order structure function of case A,
 $S_{2}/(\unicode[STIX]{x1D716}_{v}\unicode[STIX]{x1D708})^{1/2}$
as a function of
 $(r/\unicode[STIX]{x1D702})$
compared with the Sirovich form (similarly non-dimensionalized, with
 $C_{2}=2$
) for comparison. One can see good agreement between the two curves in both the dissipative and inertial range as well as in the transition regime, with discrepancies below 5 %, excluding the far ends where data are affected by measurement uncertainties and view volume edges. This gives us confidence in regard to the estimation of
 $\unicode[STIX]{x1D716}_{v}$
for case A.
In step two, knowing the value of
 $\unicode[STIX]{x1D716}_{v}$
for case A, we determined
 $\unicode[STIX]{x1D716}_{v}$
of the other cases by constraining (assuming) that the conjoined third-order structure function of all cases, should globally scale (determined by curve fitting) as a power law with exponent
 $\unicode[STIX]{x1D701}_{3}=1$
, as is predicted by K41 and supported by experiments (e.g. Anselmet et al.
Reference Anselmet, Gagne, Hopfinger and Antonia1984) and numerical simulations (e.g. Ishihara et al.
Reference Ishihara, Gotoh and Kaneda2000). As such, we have made the same assumption as in the extended self-similarity method of Benzi et al. (Reference Benzi, Ciliberto, Tripiccione, Baudet, Massaioli and Succi1993). Figure 3(b) shows the conjoined
 $S_{3}$
rescaled using the resulting
 $\unicode[STIX]{x1D716}_{v}$
.
(a) Non-dimensionalized second-order structure function (
 $S_{2}/(\unicode[STIX]{x1D716}_{v}\unicode[STIX]{x1D708})^{1/2}$
) from case A. Comparison with the Sirovich model. Inset: discrepancy between the two curves (ratio of
 $S_{2}$
to the model). Close agreement between the two implies an accurate estimate of
 $\unicode[STIX]{x1D716}_{v}$
(for case A). The experimental noise in
 $S_{2}$
is partially removed by subtracting a value of 0.2. (b) Third-order structure function compensated by power 1.

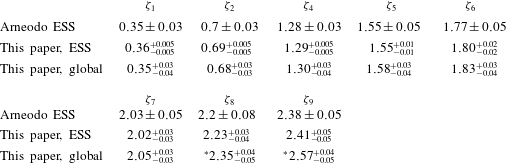
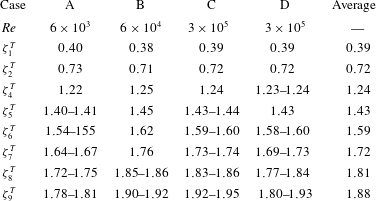
Comparison of measured scaling exponents between this paper and previous experiments. Arneodo ESS: results from various open turbulent flows in Arneodo et al. (Reference Arneodo, Baudet, Belin, Benzi, Castaing, Chabaud, Chavarria, Ciliberto, Camussi, Chilla and Dubrulle1996). This paper, ESS: results from this paper using ESS. This paper, global: results from this paper based on conjoined structure functions obtained at different Reynolds numbers. The values at highest orders marked with ‘
 $\ast$
’ are likely unreliable due to stark inconsistency with local scalings of the corresponding structure functions (details in text). The values of
 $\unicode[STIX]{x1D701}_{3}$
are not shown since they are, by assumption of the methodologies, equal to unity in all cases.

4.3 Determination of scaling exponents: ESS and global conjoint method
In table 2, we report the scaling exponents (
 $\unicode[STIX]{x1D701}_{n}$
) of the structure functions by two different methods. Firstly, we apply the extended self-similarity (ESS) method (Benzi et al.
Reference Benzi, Ciliberto, Tripiccione, Baudet, Massaioli and Succi1993) to each of the four experimental cases (A–D). This essentially involves plotting
 $S_{n}(r)$
versus
 $S_{3}(r)$
in logarithmic axes followed by curve fitting. The uncertainty of each
 $\unicode[STIX]{x1D701}_{n}$
is given as the
 $95\,\%$
confidence interval of the least-squares fitting algorithm. The fitted ranges are chosen by inspection of the, albeit noisy, local slopes plots i.e.
 $\unicode[STIX]{x0394}\text{log}_{10}(S_{n})/\unicode[STIX]{x0394}\text{log}_{10}(S_{3})$
versus
 $\text{log}_{10}(S_{3})$
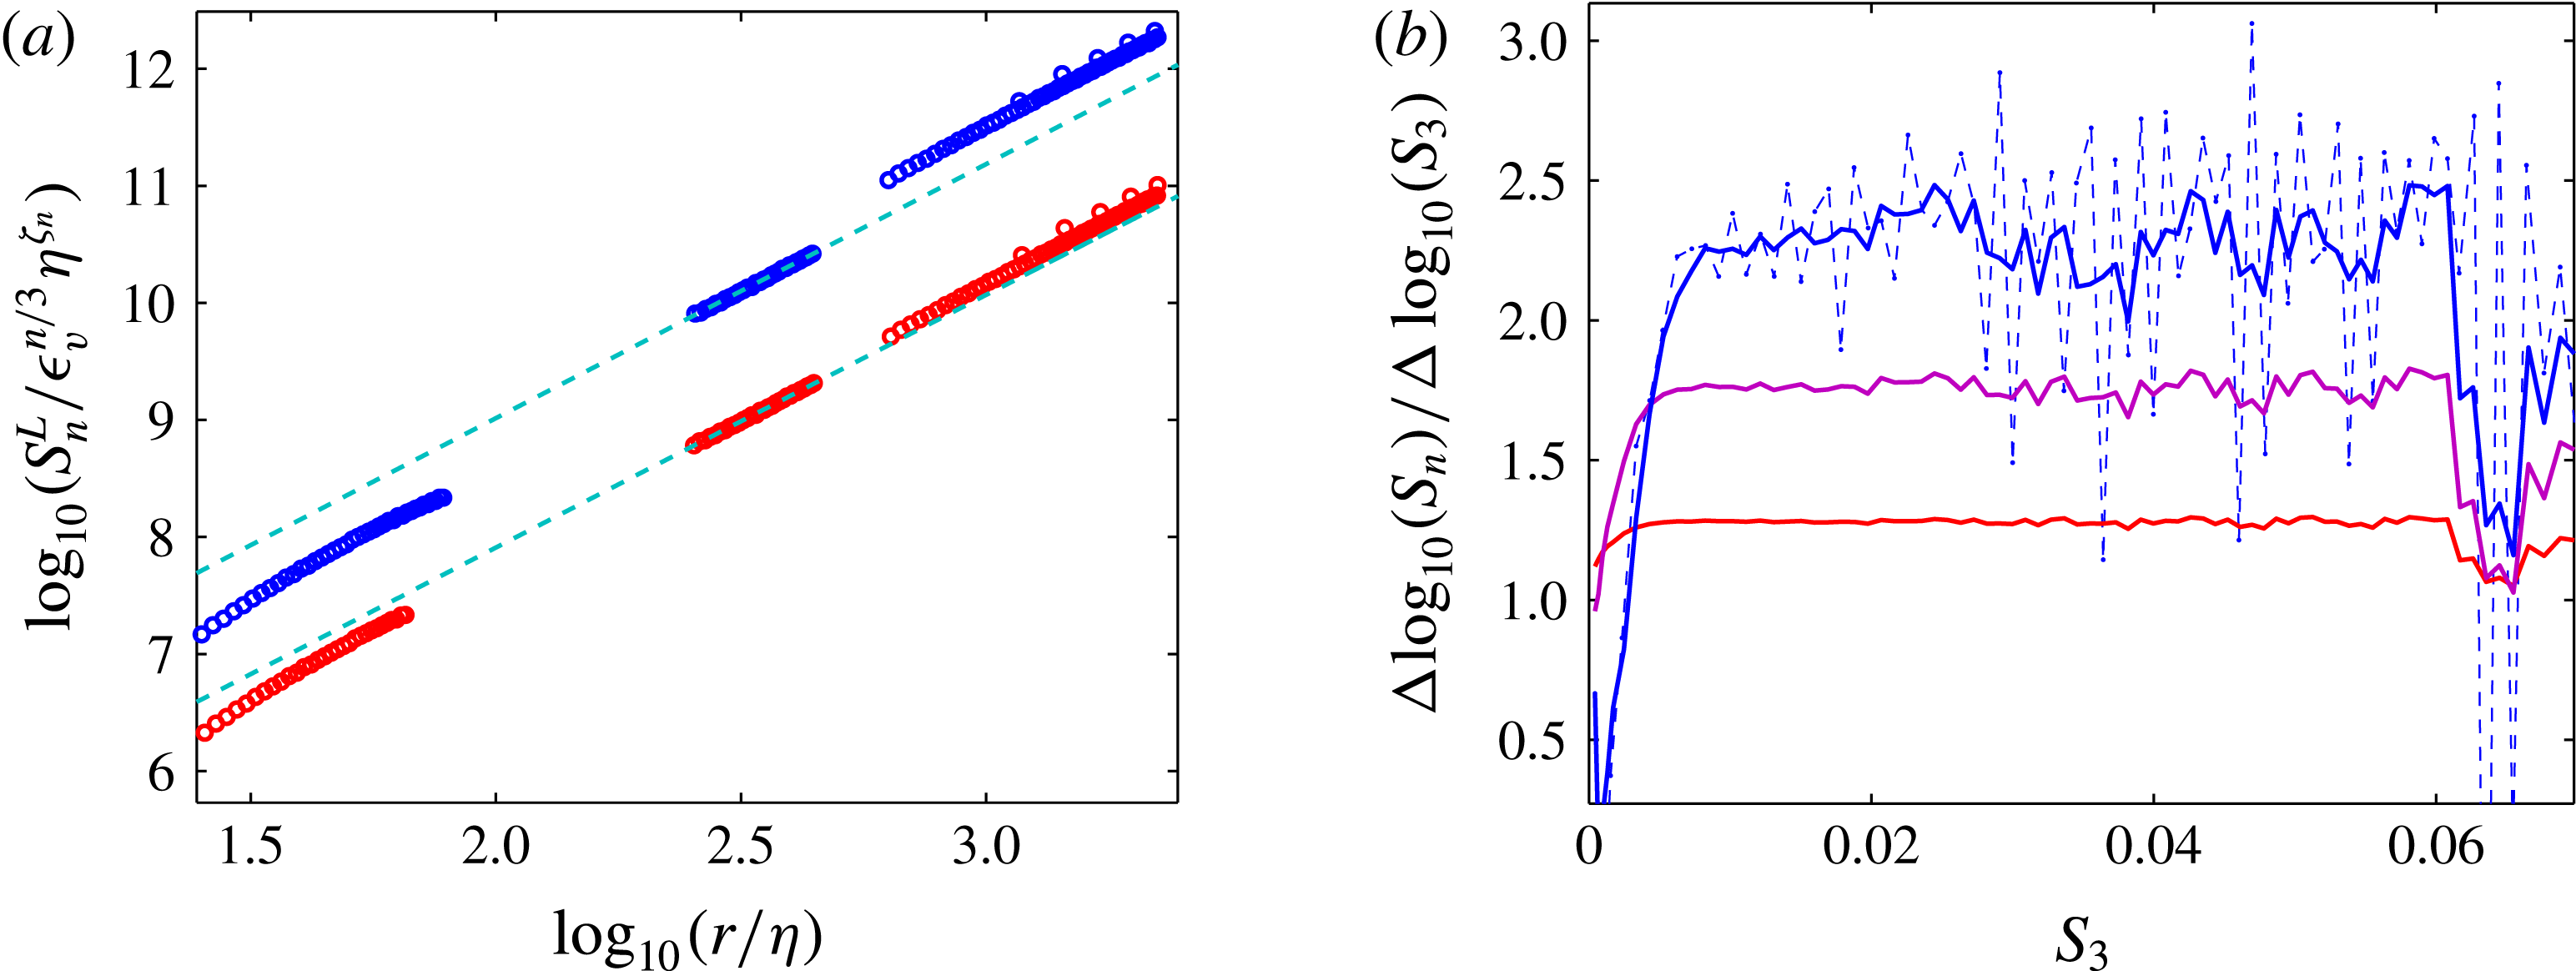
as exemplified by figure 4(b). In general, the range is selected as the intermediate part by removing the strongly varying or fluctuating parts at small and large
 $S_{3}$
. However in cases B and C, further removal of points at small
 $S_{3}$
is prompted by unsatisfactory statistical convergence (see the discussion for details on data convergence). Numerically the ranges are, respectively for cases A–D,
 $\text{log}_{10}(S_{3})\in (-1.88,-1.5),(-2.0,-1.2),(-1.9,-1.1),(-1.67,-1.21).$
Since this produces four independent measurements of
 $\unicode[STIX]{x1D701}_{n}$
for each order (owing to the 4 cases), we report their averages in table 2.
Secondly, we conjoin the non-dimensionalized structure functions (using
 $\unicode[STIX]{x1D716}_{v}$
and
 $\unicode[STIX]{x1D702}$
) from the four cases and apply curve fitting to the combined structure functions to obtain the global estimates of
 $\unicode[STIX]{x1D701}_{n}$
. As shown in figure 4(a), we found that structure functions join significantly better when they are rescaled based on the scaling relation that takes into account intermittency, namely,
 $S_{n}\times {\ell _{0}}^{\unicode[STIX]{x1D701}_{n}-n/3}/({\unicode[STIX]{x1D716}_{v}}^{n/3}\,\unicode[STIX]{x1D702}^{\unicode[STIX]{x1D701}_{n}})$
versus
 $r/\unicode[STIX]{x1D702}$
(as discussed above). We take
 $\ell _{0}=R$
(equal to the impeller radius) in the current analysis; any global refinement in the magnitude of
 $\ell _{0}$
will not affect our estimate of
 $\unicode[STIX]{x1D701}_{n}$
, as it only multiplies all
 $S_{n}$
by a constant factor. Specifically, the combined structure functions, thus rescaled, exhibit significantly better continuity as compared to their K41 scaled counterparts. The non-dimensional structure functions
 $S_{n}(\hat{r})\times {\ell _{0}}^{\unicode[STIX]{x1D701}_{n}-n/3}/({\unicode[STIX]{x1D716}_{v}}^{n/3}\,\unicode[STIX]{x1D702}^{\unicode[STIX]{x1D701}_{n}})$
as such are dependent on values of
 $\unicode[STIX]{x1D701}_{n}$
, thus in order to improve accuracy, we iterate between rescaling and curve fitting to arrive at a set of self-consistent
 $\unicode[STIX]{x1D701}_{n}$
. However, we observe that the self-consistency of this method gradually deteriorates at higher orders, essentially giving global iterated
 $\unicode[STIX]{x1D701}_{n}$
values that are highly inconsistent with their piecewise estimates. One plausible cause of this could be the possibility that the relevant external scale
 $\ell _{0}$
varies between the different sets of experiments. Unfortunately we do not have a way to independently measure
 $\ell _{0}$
, but we note that allowing
 $\ell _{0}$
to vary up to 20 % could remove such inconsistency. In view of this, for the eighth and ninth orders, such self-iterative results are less reliable, hence our best estimates for
 $\unicode[STIX]{x1D701}_{8}$
and
 $\unicode[STIX]{x1D701}_{9}$
should still be the EES results.
(a) Comparing the consistency of the structure functions rescaled using K41 and the intermittent scaling relations. From top to bottom: blue circles show the eighth-order structure function (
 $S_{8}$
) rescaled using the K41 scaling (
 $\unicode[STIX]{x1D701}_{8}=8/3\approx 2.667$
); red circles show
 $S_{8}$
rescaled via the intermittent relation with
 $\unicode[STIX]{x1D701}_{8}=2.35$
. Cyan dashed lines are best fits to each set of data in the range
 $r/\unicode[STIX]{x1D702}=2.4-2.6$
. The intermittent case is found to show a higher general level of consistency (continuity) among the higher-order structure functions (the difference is insignificant at lower orders). (b) Local slopes,
 $\unicode[STIX]{x0394}\text{log}_{10}(S_{n})/\unicode[STIX]{x0394}\text{log}_{10}(S_{3})$
versus
 $S_{3}$
for case B. Solid lines from top to bottom are for
 $n=9,6,4$
respectively and they are smoothed by the running average method. The dashed line is the respective un-smoothed data. The ESS curve fitting range is selected as the intermediate part by removing the strongly varying or fluctuating parts at small and large
 $S_{3}$
.

4.4 Transversal scaling exponents
While the main focus of the current paper is on the comparison of longitudinal structure functions, we briefly present the results on transversal structure functions here. Unlike their longitudinal counterparts, past results on scaling exponents of the transversal structure functions (
 $\unicode[STIX]{x1D701}_{n}^{T}$
) do not inspire strong consensus. There are conflicting results on whether they are equivalent to the longitudinal ones and some works suggest that they might depend significantly on large scale shear (for details see e.g. the discussion by Iyer, Sreenivasan & Yeung (Reference Iyer, Sreenivasan and Yeung2017) and references therein). However, the recent results of Iyer et al. (Reference Iyer, Sreenivasan and Yeung2017) strongly suggest that, when large scale inhomogeneities are absent, the two sets of exponents (longitudinal and transversal) are equivalent and subject to a single similarity hypothesis. Their findings also imply that previous conflicting results could be explained by the relatively much slower approach of the higher-order transversal exponents to their ultimate large Reynolds number limits and possibly by the presence of large scale shear. Further work is required to substantiate this important finding. In view of this, here we present only the ESS results on the transversal exponents, as their strong dependence on Reynolds number precludes any attempts to conjoin them using our global method described previously. The ESS results are shown in table 3. The values for
 $\unicode[STIX]{x1D701}_{n}^{T}$
at higher orders are lower than their longitudinal counterparts, consistent with some previous experiments, e.g. Dhruva, Tsuji & Sreenivasan (Reference Dhruva, Tsuji and Sreenivasan1993), Shen & Warhaft (Reference Shen and Warhaft2002). Our results show weak evidence that
 $\unicode[STIX]{x1D701}_{n}^{T}$
increases with Reynolds number for
 $n>6$
.
Scaling exponents of the transversal structure functions of velocity.
 $\unicode[STIX]{x1D701}_{n}^{T}$
values that are not presented as ranges imply uncertainties of
 $\pm 0.005$
, except the last column (Average) which shows simple averages of the mid-values of each row.

5 Discussion
Statistical convergence of data. There exist various ways of characterizing statistical convergence of structure functions. We follow the method used in Gotoh et al. (Reference Gotoh, Fukayama and Nakano2002), as it reveals directly the possible rate of change of the moments with respect to increasing statistics. This involves plotting
 $C_{n}(v)=\int _{0}^{v}{v^{\prime }}^{n}P(v^{\prime })\,\text{d}z^{\prime }$
where
 $v$
and
 $v^{\prime }$
are moduli of velocity differences and
 $P$
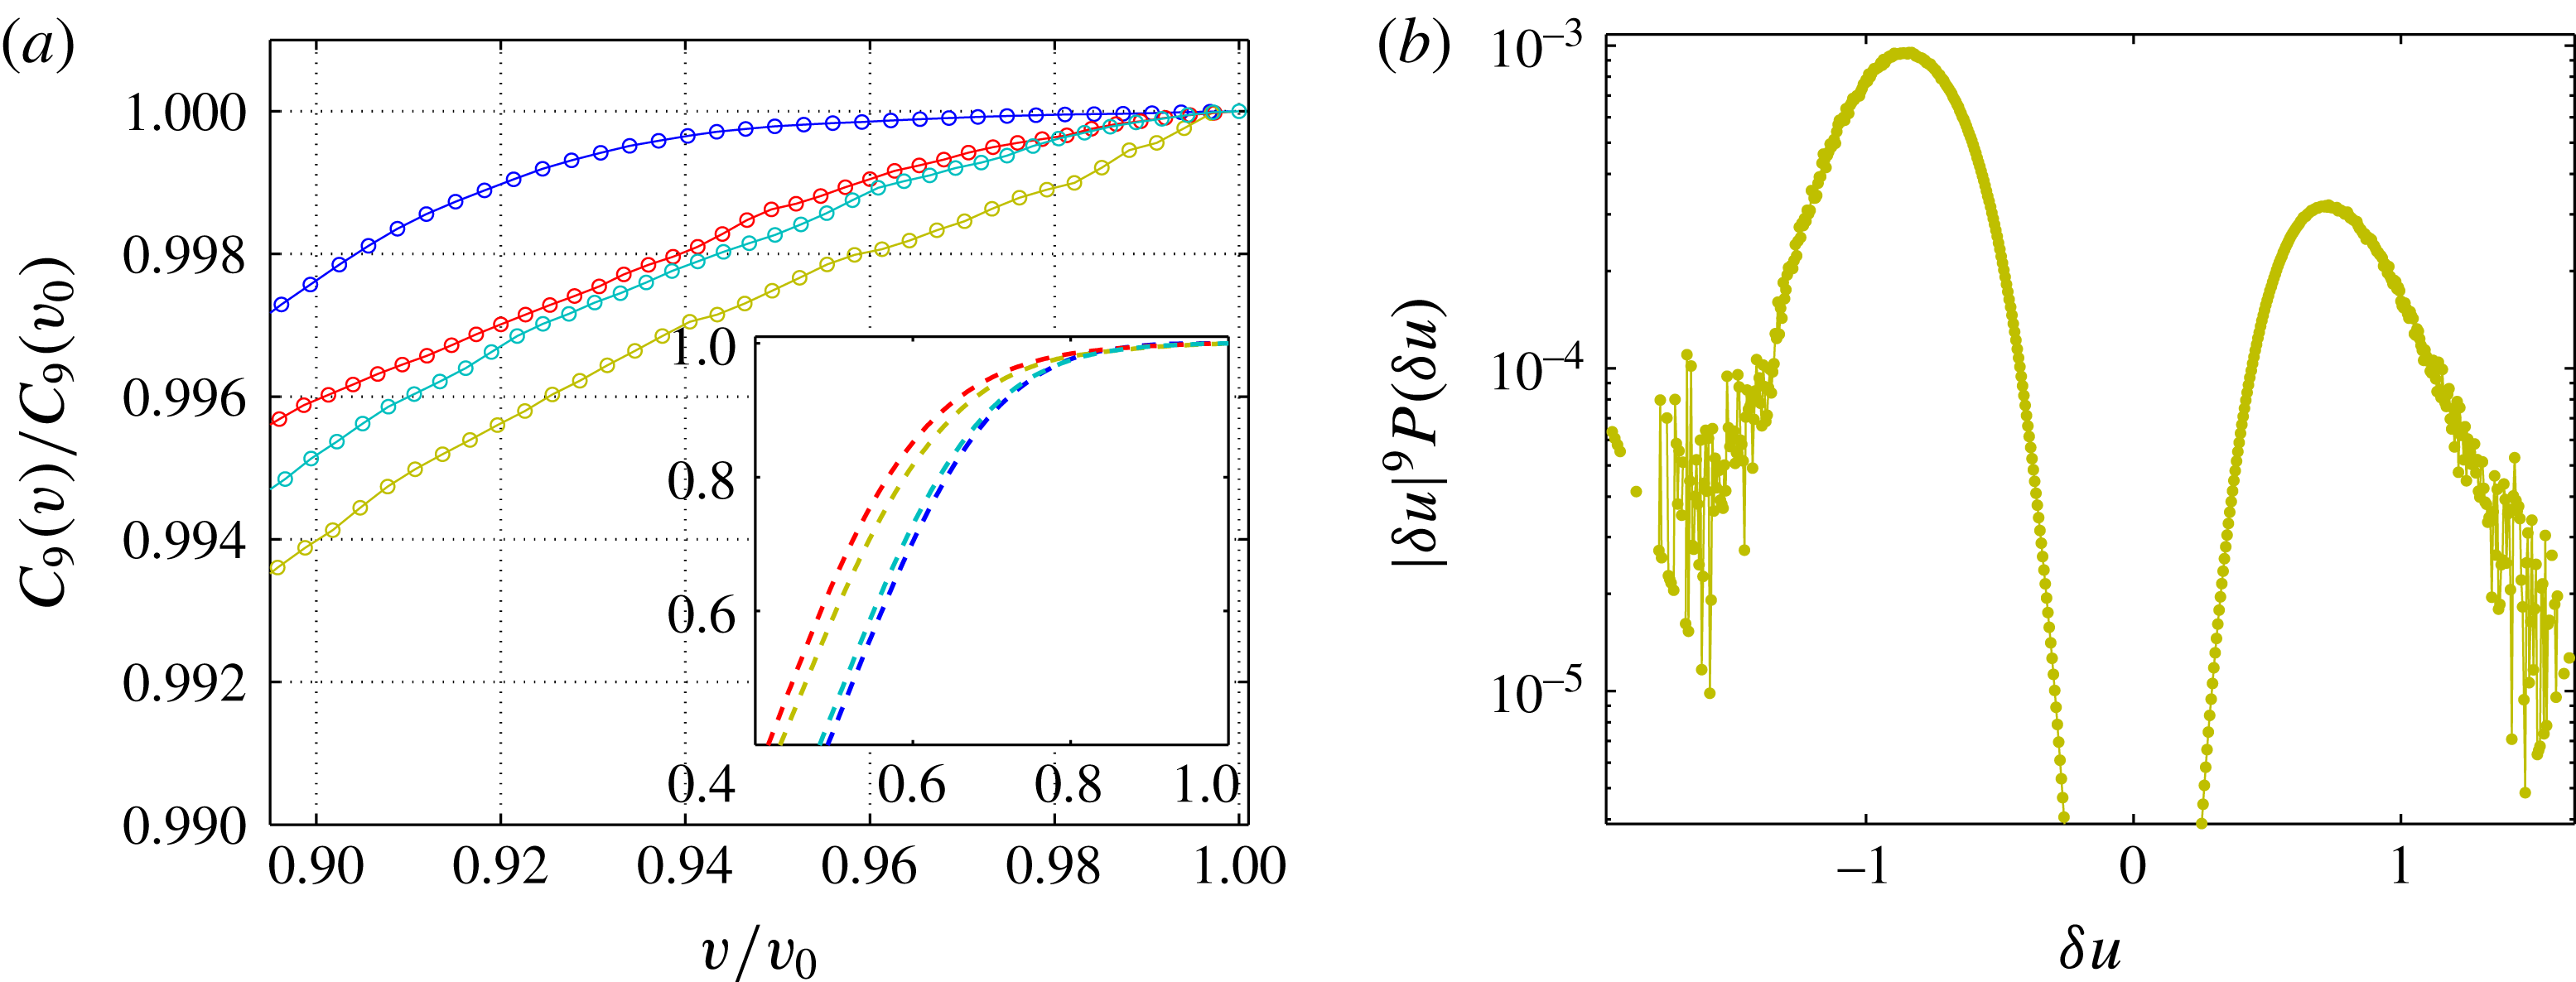
the corresponding probability density function (PDF). Figure 5 represents
 $C_{9}(v)/C_{9}(v_{0})$
as a function of
 $v/v_{0}$
, where
 $v_{0}$
is the first value of
 $v$
at which
 $P(v)=0$
in our data. The four curves represent the least converged points in each case (A–D) used in our calculation of
 $\unicode[STIX]{x1D701}_{n}$
and are respectively at
 $\text{log}_{10}(r/\unicode[STIX]{x1D702})=1.51,2.04,2.76,3.23$
. They are also the points of smallest
 $r$
retained in each case, since convergence improves with
 $r$
. To ease comparison with other works, we define our criterion for convergence as:
 $C_{n}(v)$
should not vary more than 1 % when
 $v_{0}$
is extended by 10 %, consistent with what is shown in figure 5.
Statistical convergence of the structure functions. (a) Main figure and inset, we plot
 $C_{9}(v)/C_{9}(v_{0})$
versus
 $v/v_{0}$
, where
 $C_{n}(v)=\int _{0}^{v}{v^{\prime }}^{n}P(v^{\prime })\,\text{d}z^{\prime }$
,
 $v$
and
 $v^{\prime }$
are moduli of velocity differences,
 $P$
the PDF and
 $v_{0}$
is the value of
 $v$
where
 $P(v)$
first reaches a value of zero in our data. The curves (blue, gold, red, cyan) represent, from cases A to D respectively, the least converged points used to calculate
 $\unicode[STIX]{x1D701}_{n}$
(and retained in figure 2
b,d). As the inset shows,
 $C_{9}(v)$
increase with
 $v$
before they start to saturate at large
 $v$
. The main figure verifies that all data points used in our analysis of the scaling exponents do not vary more than 1 % even if additional sampling would increase
 $v_{0}$
by 10 %. (b)
 $|\unicode[STIX]{x1D6FF}u|^{9}P(\unicode[STIX]{x1D6FF}u)$
versus
 $\unicode[STIX]{x1D6FF}u$
corresponding to case B (gold) in the left panel, where
 $\unicode[STIX]{x1D6FF}u$
is the velocity difference.

Flow inhomogeneity. In this work, we attempt to minimize the influence of large scale inhomogeneity and anisotropy by subtracting the mean flow pattern from our data and averaging over all directions in the region near the symmetric centre of the flow where the flow is approximately homogeneous. This, however, could not guarantee that all influences of inhomogeneity and isotropy have been removed, especially for case D where the view area is large. A full analysis of this issue will be the subject of future work.
6 Conclusion
We use SPIV measurements of velocities in a turbulent von Kármán flow to compute longitudinal structure functions up to order nine without using the Taylor hypothesis. Our multi-scale imaging provides the possibility to access scales of the order of (or even smaller than) the dissipative scale, in a fully turbulent flow. Using magnifying lenses and mixtures of different composition, we adjust our resolution, to achieve velocity increment measurements spanning a range of scales between one Kolmogorov scale, to almost
 $10^{3.5}$
Kolmogorov scales, with a clear inertial subrange spanning approximately 1.5 decades. Thanks to our large range of scales, we can compute the global scaling exponents by analysing the conjoined data of different resolution to complement the analysis of extended self-similarity. Our results on the scaling exponents (
 $\unicode[STIX]{x1D701}_{n}$
), where reliable, are found to match the values observed in turbulent flow experiments with open geometries (Anselmet et al.
Reference Anselmet, Gagne, Hopfinger and Antonia1984; Stolovitzky et al.
Reference Stolovitzky, Sreenivasan and Juneja1993; Arneodo et al.
Reference Arneodo, Baudet, Belin, Benzi, Castaing, Chabaud, Chavarria, Ciliberto, Camussi, Chilla and Dubrulle1996), numerical simulations (Ishihara et al.
Reference Ishihara, Gotoh and Kaneda2000; Gotoh et al.
Reference Gotoh, Fukayama and Nakano2002) and the theory of She & Leveque (Reference She and Leveque1994). In contrast, previous measurements of von Kármán swirling flow using the Taylor hypothesis reported scaling exponents that are significantly smaller (Maurer et al.
Reference Maurer, Tabeling and Zocchi1994; Belin et al.
Reference Belin, Tabeling and Willaime1996), which raises the possibility that the universality of the scaling exponents is broken with respect to a change of the large scale geometry of the flow. Our new measurements, which do not rely on the Taylor hypothesis, suggest that the previously observed discrepancy could be due to a pitfall in the application of Taylor hypothesis to a closed, non-rectilinear geometry and that the scaling exponents might in fact be universal, regardless of the large scale flow geometry. Such a result would strengthen and generalize the conclusions of theoretical analyses and numerical simulations of the Navier–Stokes equation that predict that the scaling properties of the structure functions are universal in the isotropic sector (Biferale & Procaccia Reference Biferale and Procaccia2005).
Acknowledgement
This work has been supported by EuHIT, a project funded by the European Community Framework Programme 7, grant agreement no. 312778.