NOMENCLATURE
-
 $CD_0$
Zero-lift drag coefficient
-
$CD_i$
Induced drag coefficient
-
$CD_w$
Wave drag coefficient
-
$CL_{\max}$
Maximum lift coefficient
- DOE
Design of Experiments
-
${\textbf{f}}$
Vector of objective functions
-
$\textbf{g}$
Vector of inequality constraints
- ICA
Initial Cruise Altitude
-
$L/D_{\text{TO}}$
Take-off lift-to-drag ratio
- LFL
Landing Field Length
- MDF
Multidisciplinary Design Feasible
- MTOW
Maximum Takeoff Weight
- OEW
Operational Empty Weight
- OUU
Optimisation Under Uncertainty
- P[
$ \cdot $
]
Probability operator
-
$P_0$
Target probability of feasibility
-
$p_{\textbf{u}}$
Joint probability density function of
${\textbf{u}}$
- QoI
Quantity of Interest
- RBDO
Reliability-Based Design Optimisation
- RDO
Robust Design Optimisation
- SME
Subject Matter Expert
- TOFL
Take-Off Field Length
- TSFC
Thrust-Specific Fuel Consumption
-
${\textbf{u}}$
Vector of model uncertainties
- UMDO
Uncertainty-based MDO
- UP
Uncertainty Propagation
- UQ
Uncertainty Quantification
-
$W_{\text{fuel}}$
Fuel weight
-
$\textbf{x}$
Vector of design variables


Greek symbols
-
$\mu, \mathbb{E}$
Mean or expected value
-
$\sigma$
Standard deviation
-
$\sigma^2$
Variance
-
$\Phi$
Cumulative distribution function (normal)
-
$\Psi$
Cumulative distribution function (non-normal)


1.0 INTRODUCTION
1.1 Context
The growing competition in the aerospace industry demands increased performance and reduced cost. This has led to extensive use of Multidisciplinary Design Optimisation (MDO) methods to take into account the interactions between fundamental disciplines such as aerodynamics, structures, propulsion, performance and cost in early design phases.
Decisions taken during conceptual and preliminary phases commit over 75% of the program total life cycle cost(Reference Nicolai and Carichner1), and by the end the decision-maker must decide whether to undertake the new program or not. Therefore, a certain confidence is required(Reference Torenbeek2). However, uncertainty, due to either lack of knowledge (epistemic) or aleatory sources, permeates the design process.
The use of empirical safety margin factors is a common practice for guarding against design failure(Reference Siddal3). Safety factors result in overly conservative designs, increasing the probability that business may lose their competitive edge in terms of cost and performance(Reference Messac4). Margin allocation based on previous programs may be inappropriate due to several factors. Better prediction methods and tools may be available along with more experimental data (e.g. wind tunnel, flight test), meaning that the company’s state-of-knowledge has evolved, leading to reduced uncertainty in certain disciplines. On the other hand, new materials, manufacturing processes and technologies introduce new uncertainties. Even if the company’s state-of-knowledge and processes remain the same, differences in the design requirements between the new concept and a legacy product may result in completely different needs for margin allocation.
Optimisation Under Uncertainty (OUU) techniques employ non-deterministic methods to evaluate the effect of uncertain variable distributions on response functions. Statistics of these response functions are then included in the optimisation process as objectives and constraints. OUU provides a systematic and quantitative way to deal with uncertainty instead of solely relying on previous experience, and its importance is increasingly recognised in both academia and industry.
1.2 Motivation
Introducing Uncertainty Quantification (UQ) into the design and optimisation of complex systems is extremely challenging as it comes with technical, organisational and cultural barriers. Uncertainty-based optimisation can be traced back to the 1950s(Reference Dantzig5,Reference Freund6) . These techniques have been applied in aerospace engineering in disciplines such as structures(Reference Long and Narciso7–Reference Sandgren and Cameron10), aerodynamics(Reference Li, Huyse and Padula11–Reference Hollom and Qin14) and control(Reference Wie, Liu and Sunkel15,Reference DeLaurentis16) . A white paper by NASA Langley Research Center provided a comprehensive survey on the existing methods and challenges on Uncertainty-based Multidisciplinary Design Optimisation (UMDO)(Reference Zang, Hemsch, Hilburger, Kenny, Luckring, Maghami, Padula and Jefferson Stroud17). Some barriers to the adoption of UMDO in aerospace engineering identified by NASA are:
Industry feels comfortable with traditional design methods;
Few demonstrations of the benefits of uncertainty-based design methods are available;
Current uncertainty-based design methods are more complex and much more computationally expensive than deterministic methods;
Extending uncertainty analysis and optimisation to applications involving multiple disciplines increases the complexity and cost of these studies.
There is an obvious interplay between these barriers, as the lack of demonstrations on the benefits of non-deterministic design is caused by the complexity and computational cost challenges. In the absence of demonstrated benefits, the aerospace industry tends to continue with its traditional design procedures that have been working for decades, even though it is acknowledged that margin-setting procedures may be inappropriate or obsolete for new products, leading to less competitive, oversized designs which have no guarantee of feasibility under uncertainty.
The increased computational cost and complexity is often attributed to integrating UQ into the multidisciplinary design framework. An often-overlooked challenge is graphical visualisation and its role in decision-making. A review article on the state of the art and common practices in MDO of aerial vehicles(Reference Papageorgiou, Tarkian and Amadori18) identifies an increasingly important demand for frameworks with capabilities related to post-processing of optimisation results and design space visualisation in an efficient and intuitive way to better assist in the decision-making process. This shortage is even more severe in OUU due to the inherent increase in problem dimensionality.
NASA’s report(Reference Zang, Hemsch, Hilburger, Kenny, Luckring, Maghami, Padula and Jefferson Stroud17) also outlines a list of potential advantages of UMDO, among which are:
The robustness and reliability ensured by probabilistic methods and greater performance potentially obtainable (with respect to traditional margin-setting);
Upfront knowledge of which uncertainties in the design tools have the greatest impact on design can lead to more efficient use of risk reduction experiments.
In this paper, we propose two processes aimed at providing intuitive graphical visualisation to assist decision-making under uncertainty for multi-objective design optimisation of complex systems. The former advantage is demonstrated using the price of feasibility robustness process, whereas the latter is demonstrated by the cost of uncertainty process.
1.3 Paper outline
Section 2 establishes a basic background on sources of uncertainty, uncertainty characterisation, uncertainty propagation, formulation of the optimisation under uncertainty problem and uncertainty-based decision-making. The proposed framework is described in Section 3 where the price of feasibility robustness and cost of uncertainty processes are introduced, along with the enabling design space exploration and visualisation techniques utilised. The application of the proposed framework to a concept design case study is presented in Section 4. Concluding remarks and envisioned future work are described in Section 5.
2.0 BACKGROUND
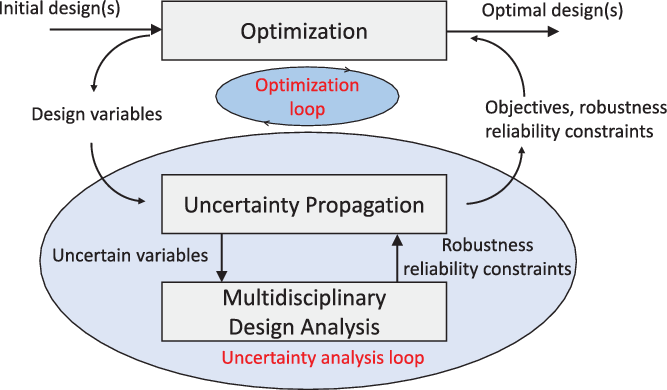
The general process to solve OUU problems involves a nested double loop involving the uncertainty analysis (propagation) and the optimisation process itself, as depicted in Fig. 1. This causes the computational burden of the UMDO process to be much greater than its deterministic counterpart. Computational time savings can be sought by using surrogates of the disciplinary models(Reference Jin, Du and Chen19,Reference Queipo, Haftka, Shyy, Goel, Vaidyanathan and Kevin Tucker20) , using more efficient uncertainty propagation schemes(Reference Adams, Eldred, Geraci, Hooper, Jakeman, Maupin, Monschke, Rushdi, Adam Stephens, Swiler and Wildey21,Reference Allaire and Willcox22) or utilising decomposition-based uncertainty analysis(Reference Brevault, Balesdent, Berend and Riche23).
UMDO flowchart (adapted from Ref. (Reference Du, Guo and Beeram24)).

2.1 Sources of uncertainty
Uncertainties are usually classified into two groups: aleatory and epistemic. Aleatory uncertainty refers to the inherent variability that exists in physical processes, and it is essentially irreducible(Reference Messac4,Reference Smith25–Reference Neufeld30) . Typical examples of aleatory variability are manufacturing tolerances and operating conditions. Epistemic uncertainty arises due to lack of knowledge, insufficient data and simplification of coupled physical phenomena(Reference Messac4,Reference Smith25–Reference Neufeld30) and can be reduced by developing a better understanding of the system or phenomena (e.g. by conducting more experiments).
In the context of computational modelling and simulation, uncertainty is regarded as a potential deficiency in any phase or activity of the modelling process that is due to a lack of knowledge(Reference Oberkampf, DeLand, Rutherford, Diegert and Alvin31). In some aerospace engineering literature, uncertainty is defined as the incompleteness in knowledge that causes model-based predictions to differ from reality in a manner described by some distribution function(Reference DeLaurentis and Mavris32).
2.2 Uncertainty characterisation
Characterisation refers to the mathematical representation of uncertainty. Two different mathematical representations of uncertainty can be found in the literature: a probability distribution or an interval. Probability Density Functions (PDF) can be fitted whenever sufficient data are available. In case of insufficient data, which is usually the case during conceptual design, PDFs can be obtained by Subject Matter Expert (SME) elicitation(Reference Ayyub33). Alternatively, non-probabilistic methods based on evidence theory and possibility theory have been proposed to model uncertainty when sufficient data are not available(Reference Messac4,Reference Padulo28,Reference Yao, Chen and Luo34) .
In the scientific community, there is a common sense that aleatory uncertainty should be modelled by probability. However, it is noteworthy that, for purely epistemic uncertainty, there is no consensus whether the best representation is through intervals with no likelihood associated with any value or through probability distribution where the PDF represents the degree of belief (Bayesian interpretation of probability). In this research, it will be assumed that both aleatory and epistemic sources of uncertainty are represented by probability distributions.
2.3 Uncertainty propagation
The input uncertainties must be forward propagated through the computational models to map their effects on response functions for statistical or interval assessments on the Quantities of Interest (QoIs). A wide variety of Uncertainty Propagation (UP) methods can be found in the literature, and the selection of a suitable method depends on the uncertainty characterisation (types and properties), analysis goals, ease of use and computational burden. UP methods can be classified into probabilistic sampling methods (e.g. Monte Carlo and Latin hypercube sampling), local and global reliability methods (e.g. MPP, FORM/SORM, EGRA), stochastic expansion (e.g. polynomial chaos expansions and stochastic collocation) and non-probabilistic methods (e.g. interval and Dempster–Shafer theory of evidence)(Reference Adams, Eldred, Geraci, Hooper, Jakeman, Maupin, Monschke, Rushdi, Adam Stephens, Swiler and Wildey35).
There are several Uncertainty Quantification (UQ) codes and toolboxes available, including open-source tools such as the DAKOTA toolkit by Sandia National Laboratories (https://dakota.sandia.gov/) and MUQ by MIT (http://muq.mit.edu), free-of-charge software packages such as UQTools by NASA (https://uqtools.larc.nasa.gov/) and commercial off-the-shelf (COTS) software such as SmartUQ (https://www.smartuq.com/). A survey including other tools can be found in Ref. (Reference Esliner, Lin and Engel36). The Scalable Environment for Quantification of Uncertainty and Optimization in Industrial Applications (SEQUOIA) project(Reference Alonso, Eldred, Constantine, Duraisamy, Farhat, Iaccarino and Jakeman37) pursues large-scale high-fidelity UQ.
The application of OUU to aircraft conceptual/preliminary design is already affordable from a computational cost standpoint (since the concern is not with extremely rare events).
2.4 Optimisation under uncertainty
Let us consider that the design analyses are performed by objective functions
 $f_m({\textbf{x}},{\textbf{u}}), m=1,2,...M$
and constraint functions
 $g_i({\textbf{x}},{\textbf{u}}), i=1,2,...I$
, where
 ${\textbf{x}} \in \mathbb{R}^n$
is the vector of design variables and
 ${\textbf{u}} \in \mathcal{U}$
is the vector of input uncertainty parameters with joint PDF given by
 $p_{{\textbf{u}}}({\textbf{u}})$
. Given that
 ${\textbf{u}}$
is a vector of random variables, the response vectors
 ${\textbf{f}}$
and
 ${\textbf{g}}$
are functions of multiple random variables and therefore become random variables themselves. The problem of optimisation under uncertainty can then be formulated as
 \begin{equation} \begin{array}{c@{\quad}l} \underset{{\textbf{x}}}{\operatorname{minimize}} & \Xi[{\textbf{f}}({\textbf{x}},{\textbf{u}})]\\
\text{subject to} & P[g_i({\textbf{x}},{\textbf{u}}) \leq 0] \geq P_{0_i} \quad i\in \{1,...,I\} \\
& {\textbf{x}}_{LB} \leq {\textbf{x}} \leq {\textbf{x}}_{UB}, \\ \end{array} \end{equation}
where
 $P_{0_i}$
is the desired probability of satisfying the
 $i{\text{th}}$
constraint and
 $\Xi$
is a suitable statistical measure of the random response vector
 ${\textbf{f}}({\textbf{x}},{\textbf{u}})$
– typically defined using the first two moments of each
 $f_m$
(e.g.
 $\mathbb{E}[f_m({\textbf{x}},{\textbf{u}})]+k\sigma[f_m({\textbf{x}},{\textbf{u}})]$
, where
 $\mathbb{E}$
denotes the expected value,
 $\sigma$
the standard deviation and k is an arbitrary constant).
The probability of feasibility in Problem (1) is given by the following integral:
 \begin{equation} P[g_i({\textbf{x}},{\textbf{u}}) \leq 0] = \int...\int_{g_i({\textbf{x}},{\textbf{u}}) \leq 0}{p_{\textbf{u}}({\textbf{u}})d{\textbf{u}}}, \end{equation}
where
 $p_{\textbf{u}}$
is the joint probability density function of
 ${\textbf{u}}$
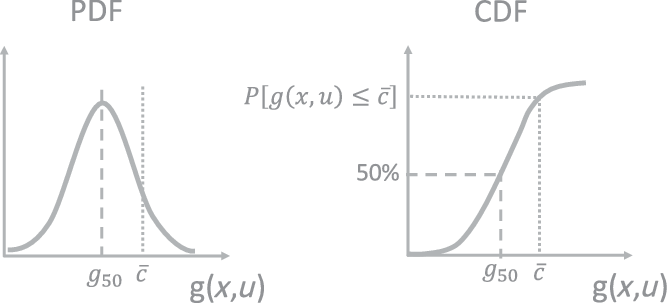
and the integral is carried out over the entire feasible domain. Figure 2 depicts the relationship between a given response function
 $g({\textbf{x}},{\textbf{u}})$
in terms of its PDF, its Cumulative Distribution Function (CDF) and a given threshold upper value
 $\overline{c}$
for a target probability of constraint satisfaction
 $P_0$
, that is,
 $P[g({\textbf{x}},{\textbf{u}}) \leq \overline{c}] \geq P_0$
.
In general, both the joint probability density function
 $p_{\textbf{u}}({\textbf{u}})$
and the feasibility domain are seldom explicitly defined, and the evaluation of the multiple integral in Equation (2) can be computationally expensive(Reference Messac4,Reference Sobieszczanski-Sobieski, Morris and Tooren29) , hence several methods have been proposed to enable an approximate calculation of the integral(Reference Messac4,Reference Helton27) . The method selected affects both the accuracy and computational burden of the OUU process.
Relationship between response function’s PDF and CDF for OUU problem formulations.

The problem formulation (1) is fairly general and capable of describing the two most commonly employed classes of OUU: Robust Design Optimisation (RDO) and Reliability-Based Design Optimisation (RBDO). The key differences between RDO and RBDO lie in how the objectives and constraints are handled under uncertainty. At first glance, RDO is concerned with the optimisation of mean performance and minimisation of its sensitivity to input uncertainties whereas RBDO focuses on achieving a target probability of constraint satisfaction under uncertainty (i.e. reliability)(Reference Messac4,Reference Padulo28,Reference Yao, Chen and Luo34) . However, feasibility under uncertainty is also often treated within RDO formulations(Reference Du and Chen38–Reference Messac and Ismail-Yahaya40), making the distinction between RDO and RBDO less obvious as both cases solve Equation (2) to assess feasibility under uncertainty. Despite
 $P_0$
in Problem (1) being a measure of reliability, for historical reasons, ‘reliability’ is often traced to system safety engineering problems such as in structural design(Reference Ba-Abbad, Nikolaidis and Kapania41,Reference Nikbay and Kuru42) , nuclear stockpile(Reference Pilch, Trucano and Helton43) and missile flight simulation(Reference Ob, DeLand, Rutherford, Diegert and Alvin44), which are concerned about very low probabilities of failure. The intended application of the proposed framework is focused on design feasibility with respect to market requirements, whereas safety is not at stake as the probability of feasibility only refers to how likely the design is to meet the market-driven performance requirements while still complying with regulations and certification requirements. Hereinafter, we use Parkinson et al.’s(Reference Parkinson, Sorensen and Pourhassan45) definition of ‘feasibility robustness’ to avoid misinterpretations.
One important motivation to pursue satisfactory feasibility robustness in conceptual design is to avoid redesign, which is often viewed negatively due to the associated costs and delays(Reference Price, Kim, Haftka, Balesdent, Defoort and Riche46). On the other hand, aiming for high robustness in aircraft performance increases the likelihood of oversizing. He et al.(Reference He, Allaire, Deyst and Willcox47) define redesign and refinement in the context of complex systems design under uncertainty while employing a Bayesian framework. ‘Redesign’ is referred to as the procedure of actively changing some portion of the system (i.e. design variables) using existing knowledge and information, whereas ‘refinement’ is referred to as the procedure of increasing the level of knowledge about the design as it is. The amount of redesign or refinement effort required in each design parameter to achieve the desired probability of constraint satisfaction can be readily compared by relating the probability of failure to design parameters through sensitivities. However, interactions between design parameters are not accounted for, and there is no guarantee that the changes required in the mean or standard deviation of the design parameter are feasible or physically representative. Moreover, its applicability is restricted to problems where input uncertain parameters and design variables coincide. Using a similar definition of redesign, Price et al.(Reference Price, Kim, Haftka, Balesdent, Defoort and Riche46) propose a margin-based design/redesign method to allow a trade-off between expected performance and probability of redesign while ensuring reliability with respect to mixed epistemic–aleatory uncertainties. Nguyen et al.(Reference Van Nguyen, Lee, Lee and Park48) employ an RDO formulation to an unmanned air vehicle (UAV) design case study.
2.5 Uncertainty-based decision-making
Decision-making is the cognitive process of identifying and choosing alternatives based on the values, preferences and beliefs of the decision-maker. Design and decision-making are closely related, since design can be seen as “the evolution of information punctuated by decision making”(Reference Ullman49). Practical engineering problems typically involve multiple criteria, resulting in multi-criteria decision-making (MCDM) problems. UQ increases the dimensionality of the response functions, emphasising the need for tailored procedures to support decisions.
Trade-off studies between robustness and performance are usually depicted as Pareto frontiers in terms of the expectation and standard deviation of the original (deterministic) objective function, as in the robust aerodynamic aerofoil design reported in Ref. (Reference Dodson and Parks50). Similarly, risk–performance trade-off studies are often reported as Pareto frontiers of mean performance and probability of feasibility(Reference Ng and Willcox51) or reliability index(Reference Neufeld30). However, despite the advantage of a posteriori decision-making based on Pareto frontiers, treating the statistical moments of each response function causes an N-fold increase in the number of objectives, where N is the number of statistical moments utilised. Handling multi-objective problems under uncertainty is still challenging, and research efforts for enhancing the decision-making process via visualisation of uncertainty spaces are increasingly important(Reference Messac4). A visualisation method based on the Generate-First Choose-Later (GFCL) approach is proposed in Ref. (Reference Rangavajhala, Mullur and Messac52), in which a Pareto cloud is plotted in the mean objective space and subsequent filters are used to map the regions with respect to robustness and feasibility metrics. More recently, as part of the European Union’s Thermal Overall Integrated Conception of Aircraft project, Guenov et al.(Reference Guenov, Chen, Molina-Cristóbal, Riaz, van Heerden and Padulo53) proposed a margin management framework that combines design space exploration and visualisation techniques to explore the effects of margins on other margins, margins on performance and margins on probabilities of constraint satisfaction.
Visualisation tools may aid decision-making, so we define procedures using iso-contour plots, parallel coordinates plots and Pareto frontier bubble plots as means of visualising the effects of (1) changing the desired probability of constraint satisfaction (feasibility robustness) for a given uncertainty characterisation and (2) the effect of uncertainty reduction (e.g. through experiments) on robust optimal designs.
3.0 PROPOSED FRAMEWORK
In this section, we introduce the proposed UMDO framework and its main constituents.
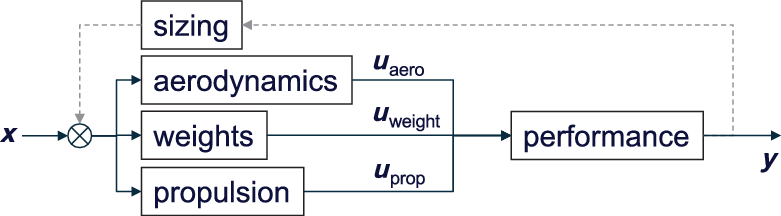
Aerospace companies typically have their own proprietary codes for conceptual design. Publicly available codes include FLOPS(Reference McCullers54) and SUAVE(Reference Lukaczyk, Wendorff, Colonno, Economon, Alonso, Orra and Ilario55). The proposed methodology is code agnostic, but some adaptations in coupling UQ to the MDO framework could be necessary for different architectures(Reference Martins and Lambe56,Reference Vanaret, Gallard and Martins57) . The implementation here is based on an MDF architecture. Let us assume an existing conceptual design tool that receives as inputs geometric, operational and technological characteristics of an aircraft and performs sizing and multi-disciplinary analysis of the concept (Fig. 3).
Conceptual design tool block diagram. Inherent couplings between the disciplines are omitted for clarity.

The quantities of interest for this tool are performance and cost metrics calculated using estimates provided by fundamental disciplines such as aerodynamics, weights and propulsion. The sizing loop is a common step in aircraft synthesis codes, as it determines the required maximum take-off weight (MTOW) for a given payload/range capability.
3.1 Sources of uncertainty
Identification of the most relevant sources of uncertainty depends on a number of factors, including (1) the fidelity of the disciplinary models, and (2) how sensitive the responses of interest are to under/over-predicting such characteristics. This task is carried by the conceptual designer with support from subject matter experts. For convenience, consider the simplified depiction in Fig. 3 where the quantities of interest
 ${\textbf{y}}$
are computed by the performance model as a function of aerodynamics, weights and propulsion properties estimated by the respective models as a function of the design variables, that is,
 ${\textbf{y}} = {\textbf{y}}({\textbf{u}}({\textbf{x}}))$
where
 ${\textbf{u}} = [{\textbf{u}}_{\text{aero}},{\textbf{u}}_{\text{weight}},{\textbf{u}}_{\text{prop}}]$
is the vector of model uncertainties. Here we select drag polar, maximum lift coefficients, lift-over-drag at take-off, operating empty weight, maximum fuel capability and engine thrust-specific fuel consumption as being representative of typical uncertainties at the conceptual design stage but still simple enough for a methodology demonstration. These model uncertainties in aerodynamics, weights and propulsion properties ultimately affect the flight performance, including flight envelope and missions profiles. However, one could be interested in assessing operational uncertainties in which the prescribed flight profile might be subjected to changes in flight level or cruise speed due to air traffic control, for instance. These were not the subject of this study, but such capability is already inherently embedded in the presented framework, as it is only a matter of considering such parameters as uncertain and performing the uncertainty propagation with them. However, these would have to be treated differently in the ‘cost of uncertainty’ process as they are aleatory uncertainties and thus not reducible through changes in the developer’s state-of-knowledge.
3.2 Uncertainty characterisation
Aerodynamic coefficients and engine performance are given in the form of multi-dimensional tables as functions of altitude, Mach number, temperature, configuration and throttle, among others(Reference Baklacioglu58,Reference Piskin, Baklacioglu, Turan and Aydin59) . Since
 ${\textbf{u}}$
varies with the design variables vector
 ${\textbf{x}}$
, it is not practical to assign PDFs in the form of absolute figures for each parameter in
 ${\textbf{u}}$
. Instead, we propose to characterise uncertainty in the form of relative factors applied to the deterministic estimates. Furthermore, relative deviations are convenient descriptors from an expert elicitation standpoint. The procedure proposed by Greenberg(Reference Greenberg60) can be used to elicit prior triangular distributions. Bayesian frameworks(Reference He, Allaire, Deyst and Willcox47,Reference Allaire, Willcox and Toupet61,Reference Profir, Eres, Scanlan, Bates and Argyrakis62) can then be used to update uncertainty descriptors based on other sources of information (evidence). Here we use triangular distributions as a convenient way of describing either symmetrical or asymmetrical deviations around a nominal reference (most likely). It is not in the scope of this paper to advocate for a particular uncertainty characterisation, nor to discuss what may cause model uncertainties to be asymmetrical. Nevertheless, in our case study for the price of feasibility robustness process, we employ a conservative asymmetrical characterisation – that is, one where pessimist effects are greater than their optimistic counterparts – to illustrate the effect on the feasible design space.
3.3 Uncertainty propagation scheme
The conceptual design tool is deterministic in nature, and thus it is necessary to couple it to an uncertainty propagation scheme. Analogously to stochastic expansion methods (PCE and SC), the Surrogate Superposition Monte Carlo (SSMC) method employed herein starts by placing
 $2N_u+1$
samples used to capture the functional relationship between a set of output response metrics and a set of input random variables, except that, instead of using sampling points to approximate coefficients of an orthogonal polynomial approximation of the response (which requires an increasing number of collocation points as a function of the degree chosen for the polynomials and the number of random variables), we assume linearity so that the effect of each random variable on each response can be computed independently of the other random variables and then the compound effects on response are approximated using superposition of effects. These points are placed at the upper and lower bounds of each
 $u_j$
. The relative influences are taken around the nominal (i.e. all
 $u_j$
set at its respective mode, the same as the deterministic evaluation) for both the lower and upper bounds of each
 $u_j$
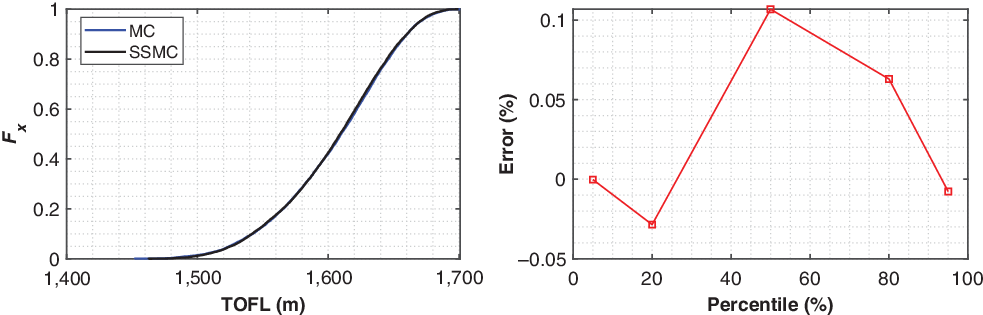
(which are all triangular). This is done to capture asymmetry effects from skewed input distributions. Figure 4 shows a comparison of the predicted CDF using this method with a full Monte Carlo simulation for a given skewed QoI.
Surrogate superposition Monte Carlo validation against full Monte Carlo.

These relative influences (lower and upper bound) are used to construct triangular PDFs in the form of relative deltas:
 \begin{equation} f_{\Delta Y_i^j} \sim T\left(\Delta Y_i^{j,{\text{LB}}}, 0, \Delta Y_i^{j,{\text{UB}}}\right)\end{equation}
Note that, for each QoI
 $Y_i$
, there are
 $N_u$
PDFs. Then, the stochastic responses are computed using Monte Carlo drawing of samples from these delta PDFs:
 \begin{equation} Y_i^n = \left(1+\sum_{j=1}^{N_u} \text{random}(\Delta Y_i^j)\right) \cdot Y_i^{\text{nominal}} \mbox{, for $n=1,...,N_{\text{samples}}$ }\end{equation}
Hence making available the PDF/CDF for each quantity of interest. The method does not assume normality on the response functions and has good capability to capture asymmetry in the responses. The computational cost of this method is about 500 timesFootnote 1 lower than full Monte Carlo sampling. Even though the method relies on first-order approximations of the limit state functions, it is well suited for mildly non-linear continuous responses as long as responses are monotonic with respect to all input uncertainties. Additionally, due to the first-order approximation, the accuracy of this UP method decreases as the input uncertainty levels increase. For levels of input uncertainty up to
 $\pm5\%$
, the error in predicting the CDFs of QoIs is under
 $0.2\%$
, which is acceptable since we are not concerned with extreme failure events.
This propagation method was selected for being extremely efficient while providing reasonable results for the problem at hand. However, in its current implementation, the method is limited to handle triangular input PDFs. Benchmarking studies are under way, and it is planned to integrate DAKOTA(Reference Adams, Eldred, Geraci, Hooper, Jakeman, Maupin, Monschke, Rushdi, Adam Stephens, Swiler and Wildey35) into the present framework in the near future. The proposed framework is somewhat method agnostic as it does not require a specific UP method to be used. As argued in Section 2.3, the choice of the method will depend on the QoIs’ characteristics, input uncertainty characterisation and available computational budget, among other factors.
3.4 Design space exploration and visualisation
In a report for the Swedish Defence Research Agency (FOI), Jändel et al.(Reference Jandel, Bivall, Hammar, Johansson, Kamrani and Quas63) present a comprehensive overview of the important role that visual analytics plays in decision-making. The report highlights the usefulness of three- and four-dimensional scatter plots (herein referred to as bubble plots) and Parallel Coordinate Plots (PCPs) for portraying multidimensional data. These, combined with efficient design exploration strategies, are fundamental building blocks in the proposed framework and are summarised below.
3.4.1 Design of experiments
The design space is defined as the hypercube confined by the bounds of design variables
 ${\textbf{x}}_{LB}$
and
 ${\textbf{x}}_{UB}$
in Problem (1) and can be represented by the Cartesian product of all sets of design variables. Since an infinite number of possible design solutions exist in a continuous design space, statistical sampling techniques are used to map efficiently from the parameter space into the response space. These are used both to obtain responses for constraint analysis and to generate the initial population for optimisation.
3.4.2 Stochastic constraint analysis
A finite number of design points is evaluated following a DOE, such as full-factorial sampling. Two design variables are selected as main design parameters, typically wing area and engine thrust class (or wing loading and thrust-to-weight ratio). The multidimensional design space (hypercube) is divided into multiple two-dimensional contour plots depicting iso-contour lines of the performance constraints for the two selected design variables with all other design variables kept constant. As a visualisation aid, the infeasible region is shaded in the same colour as the constraint that it violates whereas the feasible design space is kept white. Constraint analysis provides a visual assessment of the relative importance of performance constraints on the design space(Reference Gundmundsson64). The proposed stochastic variant follows the same steps, with the addition that, for each design, an UP procedure is run to retrieve the desired statistic metrics on the constraint functions. Constraint iso-contour lines are plotted for any number of percentiles of interest. This feature is further explored in both proposed processes to follow, namely price of feasibility robustness and cost of uncertainty.
3.4.3 Robust Pareto frontier representation
The Pareto set resulting from solving a multi-objective optimisation problem serves as a decision-making tool as it enables the designer to understand the trade-offs between the several objectives. Scatter plots are often used to depict Pareto frontiers for up to tri-objective problems, although its effectiveness in providing intuitive insight in three dimensions may be questionable. A 3D bubble plot is a special type of scatter plot where a colour scale is used to depict the third dimension. Adding a fourth dimension as the bubble size leads to a 4D bubble plot. Here we propose the use of multiple 3D bubble plots to portray bi-objective Pareto frontiers in the x- and y-axis while depicting the design variables in the colour dimension. For tri-objective problems, the colour dimension is still reserved for design variables, while the bubble size is used for the third objective. For an already multi-objective problem in the deterministic domain, the inclusion of uncertainty and robustness as additional design variables and objectives can render the interpretation of the results challenging. Instead, we propose solving the OUU Problem (1) for multiple cases of uncertainty characterisation (
 ${\textbf{u}}$
) or the target probability of feasibility (
 $P_0$
), thus obtaining multiple Pareto frontiers to be compared against each other and promptly assess the involved trade-offs.
3.4.4 Parallel coordinates plot
Parallel coordinates plots are used in multivariate data analysis, allowing visualisation of high-dimensional spaces. Interactive filtering and dynamic design tables allow the designer to test different thresholds on performance parameters. Provided that, for each solution evaluated during design space exploration, several percentiles of interest are computed for each constraint function, the designer can pick and choose different probabilities of feasibility for each performance constraint during post-processing.
3.4.5 Information reuse strategy
Even with the use of efficient UQ methods, a non-deterministic evaluation is much more expensive than its deterministic counterpart. To ensure its viability, the presented framework utilises an information reuse strategy that allows multiple Pareto sets to be obtained at a cost not much greater than obtaining a single set. The concept is simple, but quite effective if heuristic optimisers are used to obtain the Pareto set. It leverages the following principles:
Pareto search: After performing a broad exploration over the design space, heuristic multi-objective optimisation algorithms tend to focus the search on designs that are mapped to the vicinity of the non-inferior solutions.
Robust Pareto shift: It is well known that changes in robustness/feasibility criteria cause the Pareto frontier to move. More specifically, increasing the required robustness will always worsen the objective functions.
Design space discretisation: Discretisation of the design space is done by selecting suitable step sizes for each continuous design variable. This prevents running designs that are virtually the same as previously run designs, provided that design evaluations are stored in a ‘design table’ that is made available to the optimiser during runtime.
Suppose that the designer is tasked with solving Problem (1) for different probabilities of constraint satisfaction
 $P_0$
, say 80% and 90%. Rigorously, the problem must be solved twice as the Pareto set for
 $P_0=80\%$
is infeasible with respect to
 $P_0=90\%$
and the Pareto set for
 $P_0=90\%$
is composed by dominated solutions with respect to
 $P_0=80\%$
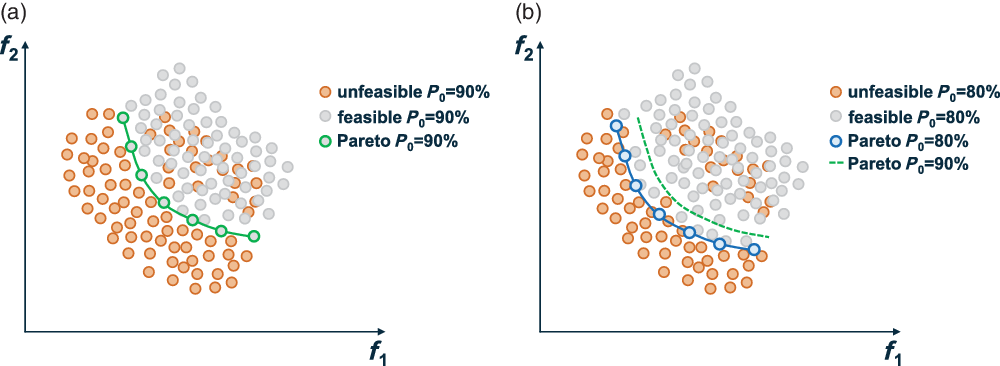
. However, leveraging the aforementioned principles, the proposed framework first solves for the most demanding feasibility and then reuses all the information available to solve for the least demanding feasibility. For this process to work, it is imperative that at least both percentiles, 80% and 90%, are computed for the constraint functions throughout the optimisation process. Solving first for the most demanding feasibility assumes that the optimiser will populate the anticipated vicinity of the least demanding feasibility problem when trying to advance the Pareto front, as notionally depicted in Fig. 5.
Information-reuse strategy. (a) Objective Space mapped for
 $\textit{P}_{\text{0}}\, \text{=}\, \text{90\%}$
. (b) Objective Space mapped for
 $\textit{P}_{\text{0}}\, \text{=}\, \text{80\%}$
.

This strategy is particularly interesting to enable the price of feasibility robustness, which makes successive use of it, as follows:
3.5 Price of feasibility robustness
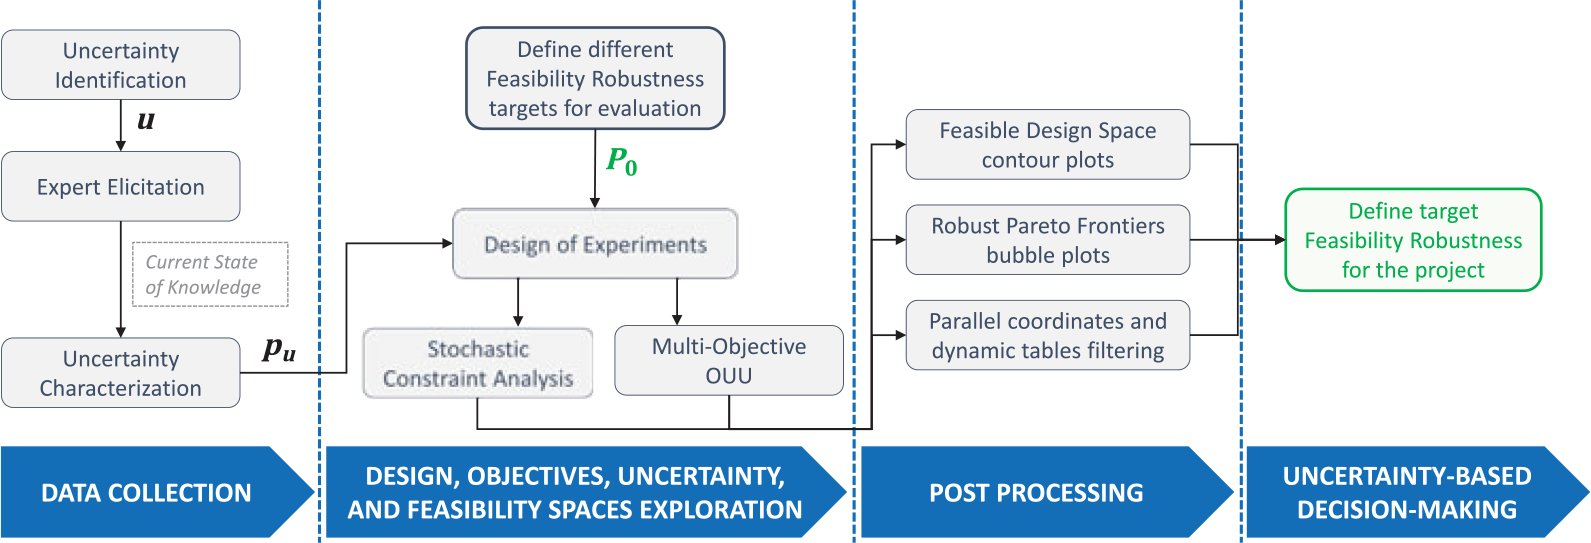
The word ‘price’ refers to the amount a customer is willing to pay for a product or service. Here we define the price of feasibility robustness as the amount the decision-maker is willing to pay for a lower risk of underperformance (i.e. not meeting market requirements). Figure 6 depicts a flow diagram of the proposed process.
Price of feasibility robustness process flow diagram.

For this process, the data collection phase encompasses the elicitation of experts to characterise uncertainty according to the current company’s state-of-knowledge in each discipline involved. In the ‘Design, objectives, uncertainty, and feasibility space exploration’ phase, designers and decision-makers define what targets of feasibility robustness should be evaluated as trade-off. Design of experiments is then used to perform stochastic constraint analysis and generate an initial population for the multi-objective optimiser. The information reuse strategy is applied to reduce the overall computational time, as the multi-objective optimisation problem is solved several times, one for each
 $P_0$
of interest. The aforementioned visualisation techniques are used in the ‘Post-processing’ phase to aid in an intuitively clear understanding of the underlying complex relationships.
3.6 Cost of uncertainty
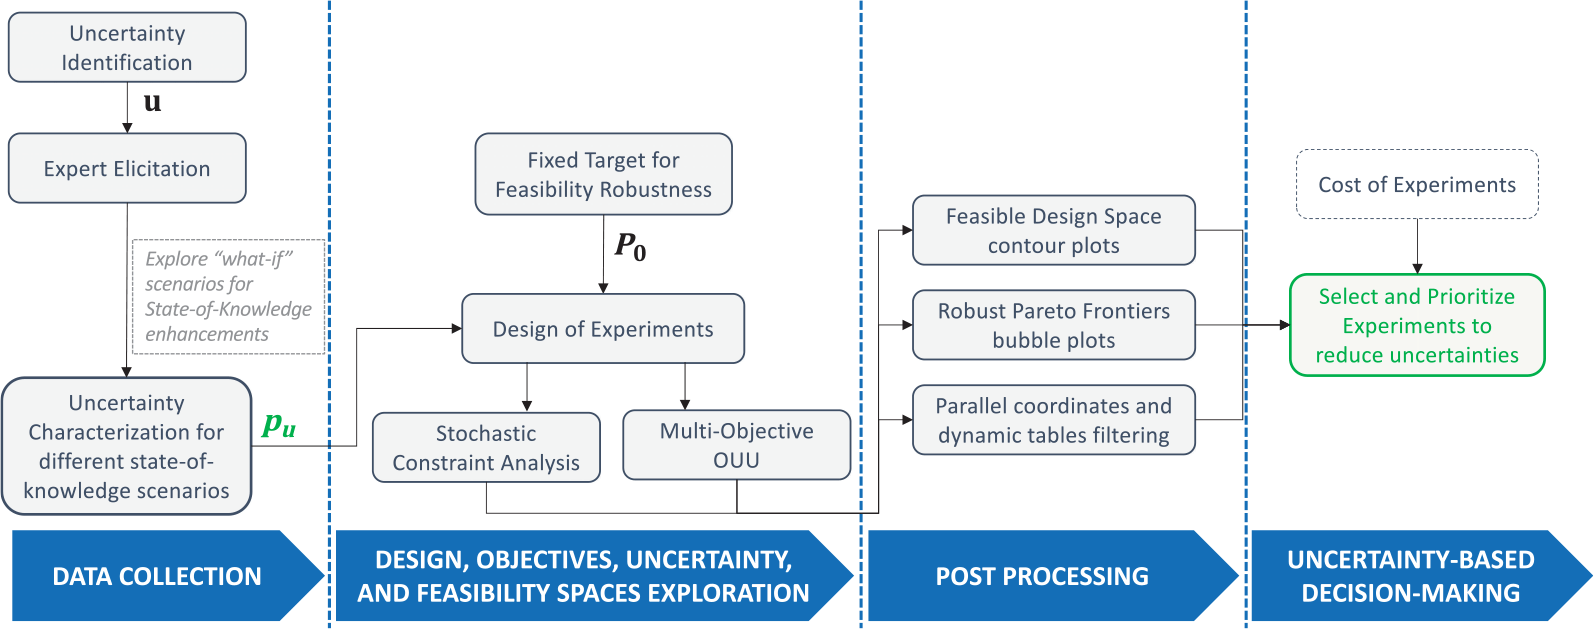
The word ‘cost’ refers to the expense incurred for a product or service to exist. The price of feasibility robustness defined above is actually proportional to the level of uncertainty. In the limit, if all uncertainty vanishes, then there would be no price to be paid for robustness. Based on the fact that uncertainty will always exist in design engineering, we define the cost of uncertainty as the inherent cost associated with the improvement of the current state-of-knowledge to achieve an acceptable feasibility robustness. The hourly cost of a production machine can be decreased by improving the machine somehow, which usually requires some level of investment in it. Similarly, the cost of uncertainty can be improved by changing the state-of-knowledge through experiments (numerical or physical). Figure 7 depicts a flow diagram of the proposed process. The process presented herein aims to improve the selection and prioritisation of uncertainty reduction experiments.
Cost of uncertainty process flow diagram.

In the data collection phase, concept designers and SMEs discuss which experiments could be used to reduce the prediction of each identified uncertainty. During expert elicitation, ‘what-if’ scenarios are used to characterise uncertainty distributions for the enhanced state-of-knowledge that would be obtained after the realisation of such experiments. In the ‘Design, objectives, uncertainty, and feasibility space exploration’ phase, designers and decision-makers define a fixed target of feasibility robustness to be used in this assessment. Design of experiments is then used to perform stochastic constraint analysis and generate an initial population for the multi-objective optimiser.
The information reuse strategy is not applicable in this process as the input PDFs are changing across optimisation cases. This renders this process more computationally expensive than the price of feasibility robustness process. However, the task of this process is to help prioritisation of knowledge-augmenting experiments within the organisation to support a potentially new development program. As such, it is expected to take place once or twice per concept study, as opposed to the price of feasibility robustness, which may iterate throughout the concept design phase until a final decision on the requirements targets is issued.
The aforementioned visualisation techniques are used in the ‘Post-processing’ phase to aid in an intuitively clear understanding of the underlying complex relationships. Additional sources of information, such as the cost of the experiments and the company’s strategic roadmap, can be aggregated, rendering uncertainty-informed decision-makingFootnote 2.
4.0 CASE STUDY
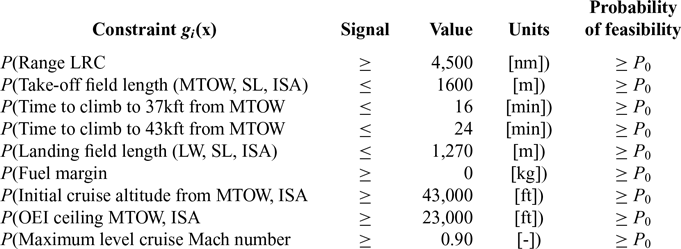
A case study of a generic large business jet adapted from Ref. (Reference Bianchi, Orra and Silvestre65) is used herein to demonstrate the capabilities of the proposed framework. Table 1 presents the set of constraints used in the test case, where
 ${\textbf{x}} = \{S_w, T_{\text{SLS}}, AR_w, \Lambda_w, t/c_w, R_{\text{DES}}\}$
is the vector of design variables. The set of design variables was chosen to be somewhat representative of a typical conceptual design phase yet simple enough for a methodology exercise. Wing area and engine thrust are related to the aircraft sizing, whereas wing aspect ratio, sweep angle and thickness-to-chord ratio are shape-related variables. Additionally, the mission design range related to MTOW sizing,
 $R_{\text{DES}}$
, is selected as design variable for the deterministic sizing loop to enable pursuing the long-range constraint in the stochastic domain, that is
 $P[Range\geq4{,}500{\text{nm}}] \geq P_0$
, whereas the fuel margin constraint guarantees that the volume of the available fuel tanks is greater than the fuel required for the sizing mission. Two fairly common figures of merit were chosen as objective functions for the optimisation problem: Maximum Take-Off Weight (MTOW) and block fuel for a given mission.
Constraints for optimisation under uncertainty

4.1 Price of feasibility robustness
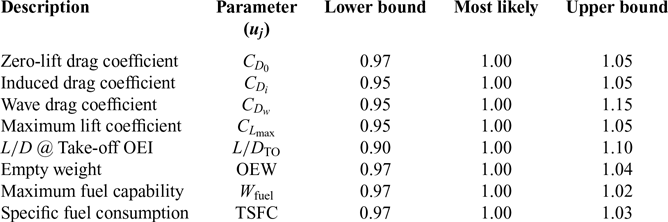
Following the process described in Fig. 6, eight uncertain input parameters were identified and characterised using triangular PDFs in the form of relative factors applied over the deterministic estimates, as described in Table 2.
Case study uncertain inputs characterisation – price of feasibility robustness

As explained in Section 3.2, aerodynamic and propulsion properties are multi-dimensional tables covering all the flight envelope. Here, we assume that these relative uncertainty factors are homogeneous throughout the flight envelope. If supporting evidence suggests that certain conditions present different levels of uncertainty, a more complex schedule can be defined based on available data. Here, we choose to divide the uncertainty in different drag components as their relative importance varies across different missions and performance requirements. We choose to aggregate weight component uncertainties at the OEW level, but a more detailed uncertainty breakdown could be derived for the different components of the OEW.
The stochastic constraint analysis process previously described was run with the PDFs described in Table 2 for varying values of the target probability of feasibility
 $P_0$
: 50%, 80%, 90% and 95%. Three performance constraints are initially studied: take-off field length, time to climb and landing field length. These were selected due to their different dependences on wing area and engine thrust.
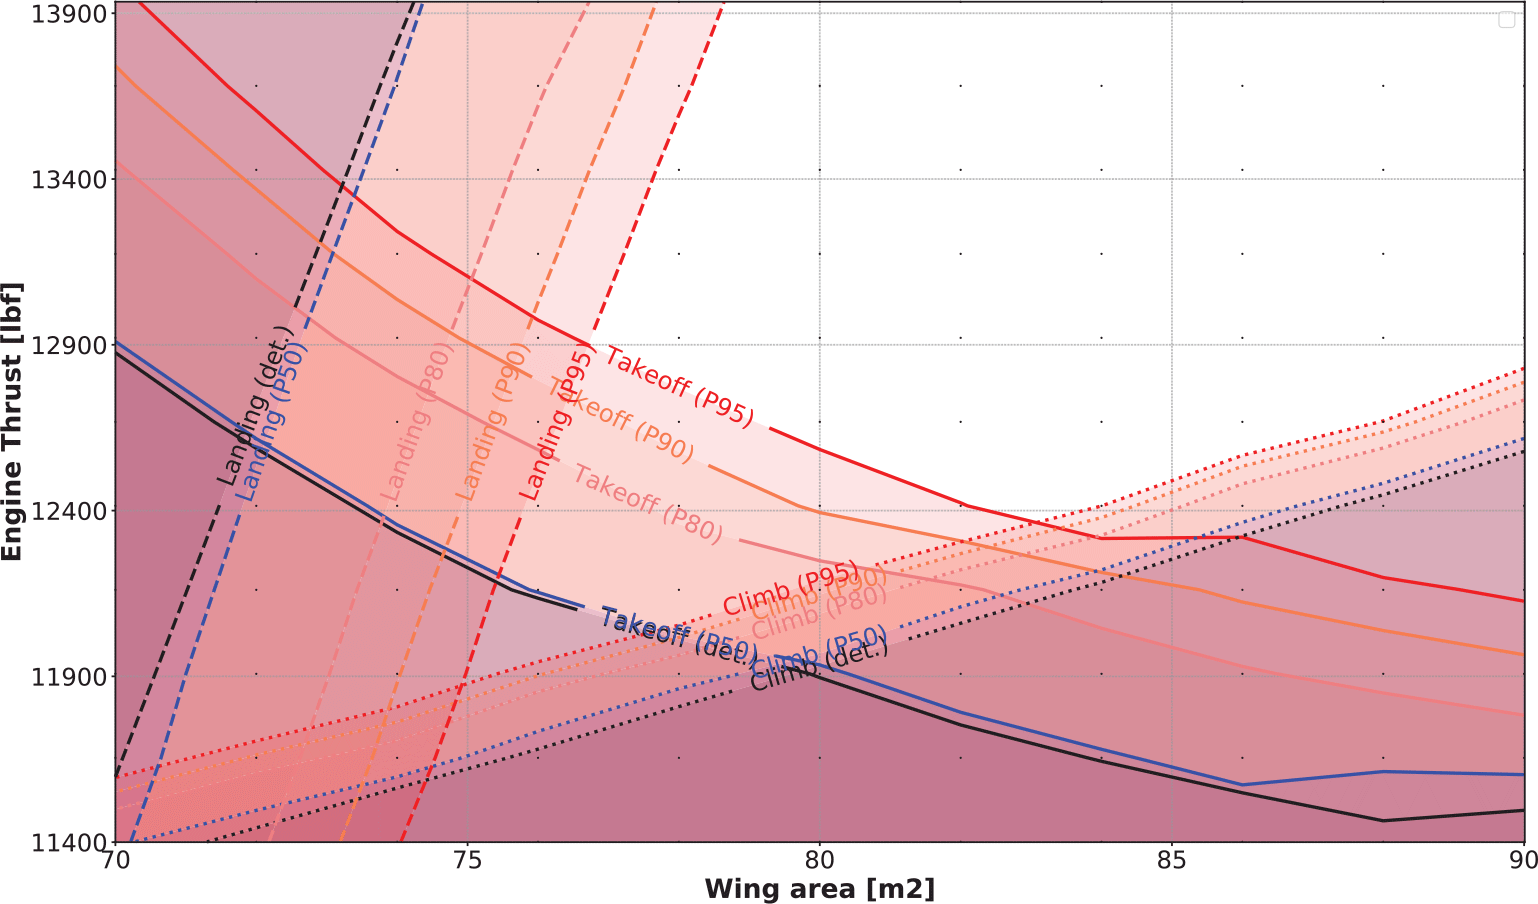
Figure 8 shows the results for one slice of the complete DOE (i.e. for a fixed set of the remaining design variables such as wing aspect ratio, sweep angle, thickness-to-chord ratio, taper ratio, bypass ratio, etc). Inspection of Fig. 8 provides quantitative information to the decision-maker about the inherent trade-off between risk, cost and performance – how much the feasible design space shrinks by targeting higher levels of feasibility robustness and which constraints cause it. For instance, it requires about 3m
 $^2$
of extra wing area to increase the probability of landing constraint satisfaction from 50% to 80%, and an extra of 5m
 $^2$
from 50% to 95%. Similarly, considering a fixed wing area of 75m
 $^2$
, an additional 850lbf per engine (+7%) is required to go from 50% to 95% probability of feasibility on the take-off requirement. The displacement between deterministic and 50% iso-contours is largely caused by the conservative asymmetry embedded in the uncertainty characterisation (Table 2). Moreover, objective function contours can be included in the charts so that it can automatically provide the price to be paid for more robust designs.
Price of feasibility robustness – constraint analysis chart.

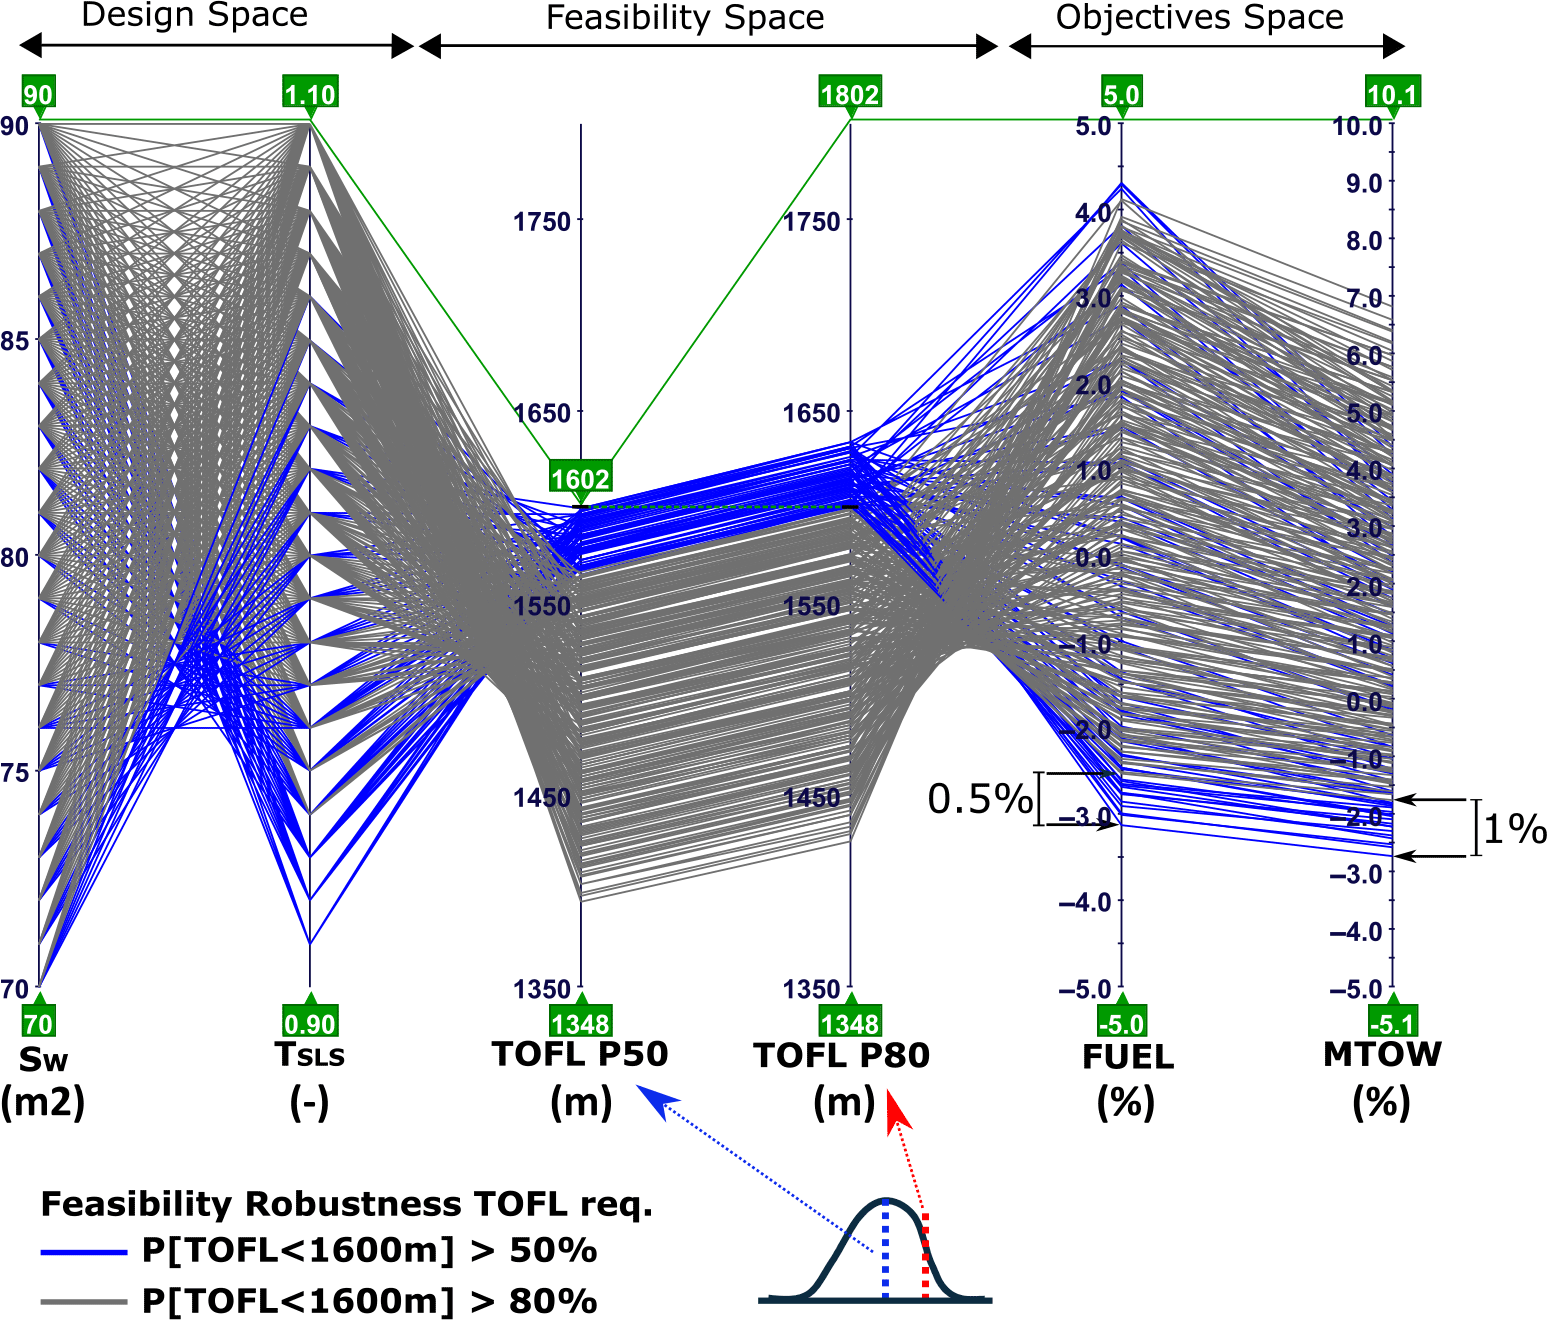
Figure 9 exemplifies another visualisation aid explored in this work. A parallel coordinates plot allows the designer to display the relationships between design, feasibility and objective spaces in a compact manner. Here, we combine the dynamic design table and filtering to assess the impact of the feasibility robustness related to the TOFL requirement. The dynamic design table allows the designer to switch on/off constraints in the post-processing stage and readily get an updated feasibility classification. By enabling the constraint
 $P[TOFL<1{,}600{\text{m}}]\geq80\%$
, all designs that are compliant are painted grey while the non-compliant ones are blue. We then use the filter to set a threshold for
 $P[TOFL<1{,}600{\text{m}}]\geq50\%$
, which causes the blue lines to represent designs with
 $50\%\leq P[TOFL<1{,}600{\text{m}}]\leq80\%$
. As can be seen in Fig. 9, increasing the required feasibility robustness on the TOFL requirement from 50% to 80% causes a 0.5% penalty in fuel burn and 1.0% penalty in MTOW.
Parallel coordinates plot using dynamic filtering.

After this initial exploration with DOE, we proceed to solving the optimisation Problem (1) formulated as the minimisation of
 $\Xi(f_1)=\mathbb{E}($
MTOW) and
 $\Xi(f_2)=\mathbb{E}($
Fuel) subject to the constraints defined in Table 1 and solved by a multi-objective genetic algorithm (MOGA) using the information reuse strategy for three target probabilities of constraint satisfaction.
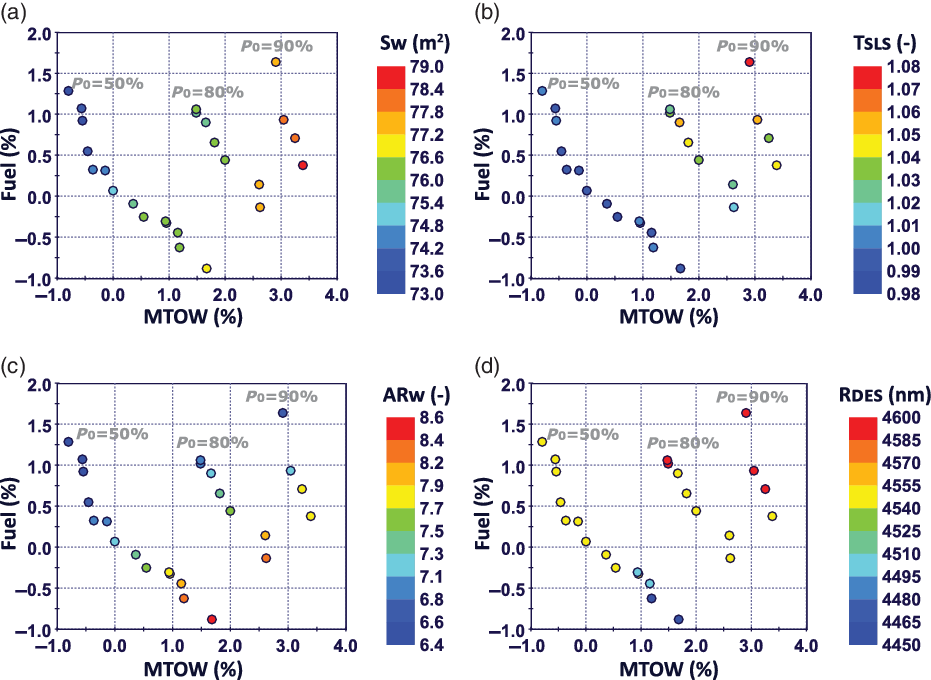
Figure 10 depicts how the MTOW–fuel Pareto front changes as the desired probability of feasibility
 $P_0$
changes from 50% to 80% and 90%. This chart provides quantitative assessments regarding the impact of aiming for higher probability of feasibility. It is also evident that the trade-off between the two objective functions is affected by the input uncertainties since the slope of the Pareto front changes with
 $P_0$
. Furthermore, the changes in the design variables required to achieve the selected level of probability of feasibility while taking into account the input uncertainties are inherently handled by the optimisation process, differently to deterministic margin allocation approaches, as discussed at the end of this section.
Price of feasibility robustness – relationship between design variables and objective functions. (a) Wing area. (b) Engine thrust (normalised). (c) Aspect ratio. (d) Design range (deterministic).

Figure 10 depicts the relationship between each Pareto front and its design variables: (a) wing area, (b) engine SLS thrust, (c) wing aspect ratio and (d) design range (deterministic), providing additional information regarding what design changes are required to achieve a higher probability of meeting all the constraints. For instance, a higher probability of feasibility require greater values of wing area and/or engine thrust, that is, the more robustness is pursued, more ‘built-in’ capability needs to be inserted into the design to counter a possibly heavier, draggier and thirstier design while still complying with the requirements.
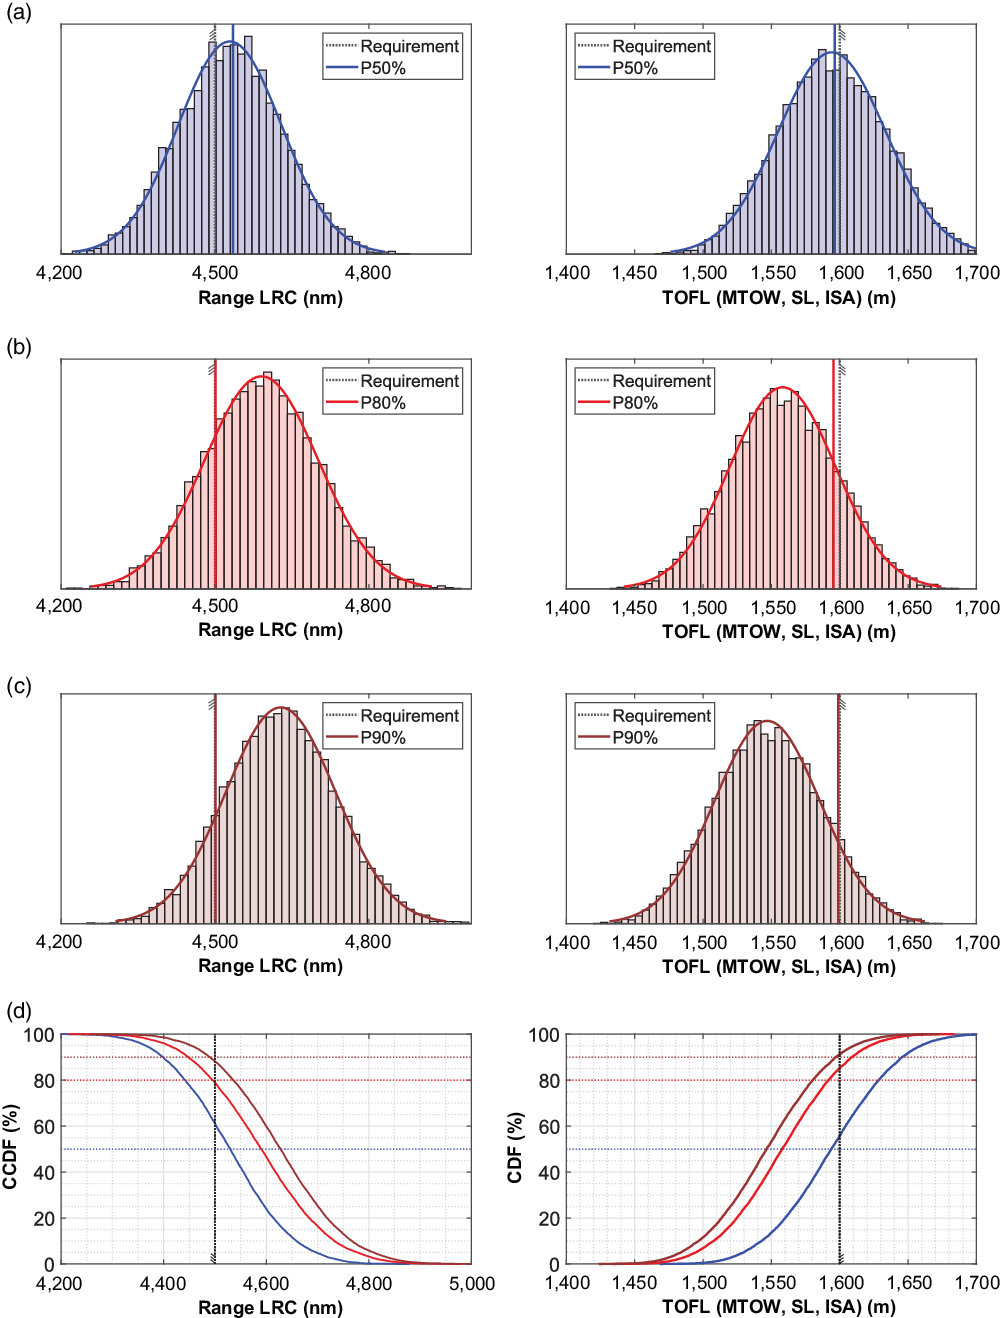
One optimal design from each Pareto set is selected for further comparisons. Figure 11 shows the histograms for the range and TOFLFootnote 3 figures of each design.
Range and TOFL PDF/CDF for designs selected from the Pareto fronts for different
 $\textit{P}_{\text{0}}$
values. (a) Design picked from the Pareto set for
 $\textit{P}_{\text{0}}\,\text{=}\,\text{50\%}$
. (b) Design picked from the Pareto set for
 $\textit{P}_{\text{0}}\,\text{=}\,\text{80\%}$
. (c) Design picked from the Pareto set for
 $\textit{P}_{\text{0}}\,\text{=}\,\text{90\%}$
. (d) Range CCDF and TOFL CDF for all three designs.

Traditional margin-setting strategies.

These three designs were hand-picked from the Pareto fronts, since both range and TOFL are active constraintsFootnote 4 and thus it can be seen how selecting different
 $P_0$
values drives the optimiser to find solutions that have shifted PDF responses such that the requirement is met with the desired probability of feasibility for each case – that is, the 50th percentile line in Fig. 11(a), the 80th percentile line in Fig. 11(b) and the 90th percentile line in Fig. 11(c) sit at the right of 4,500nm for the range QoI and at the left of 1600m for the TOFL QoI. These are summarised in Fig. 11(d) as the complementary cumulative distribution function (left) for the range QoI and cumulative distribution function (right) for the TOFL QoI.
As argued in Section 1, the deterministic design process does not handle uncertainties, and hence it is usual to apply safety margin factors based on previous experience. It is not the purpose of this paper to advocate for any margin-setting philosophy, but rather to show that OUU is a powerful tool to inform which parameters should be modified to achieve the desired probability of feasibility, preventing oversizing and constraint violation caused by a wrong selection of variables to put margin on.
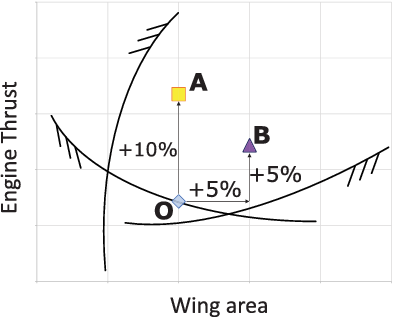
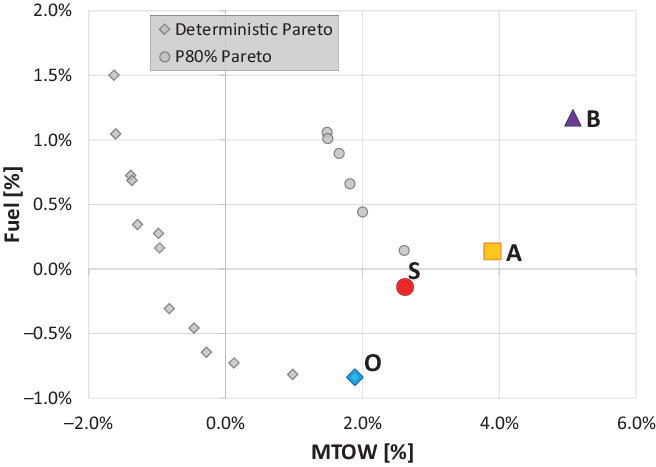
Despite the complexity inherent in aircraft design, an increase in engine thrust and/or an increase in wing area is the simplest manner to address a constraint violation for most performance requirements. This is similar in concept to the ‘corner space evaluation’ presented by Sundaresan et al.(Reference Sundaresan66). Let us thus consider two different margin-setting strategies: (A) a 10% margin is put in the engine’s thrust and (B) a 5% margin in thrust and a concurrent 5% margin in wing area are put on the top of the deterministic optimum design (O) as depicted in Fig. 12. For both strategies, a +50nm design range is considered as well, anticipating the uncertainty effects on range.
In the design process, it is usual to consider multi-objective optimisation to allow an a posteriori trade-off between selected figures of merit. Let us consider that the criterion of choice is minimum fuel burn and the desired probability of feasibility is 80%. Let
 $\Omega_{\text{det}}$
be the deterministic Pareto set and
 $\Omega_{P80}$
be the stochastic Pareto set for
 $P_0=80\%$
. Hence, we select
 $O\in\Omega_{\text{det}}$
and
 $S\in\Omega_{P80}$
as the lowest fuel burn designs in each set. We then define designs A and B using the margin-setting strategies mentioned above.
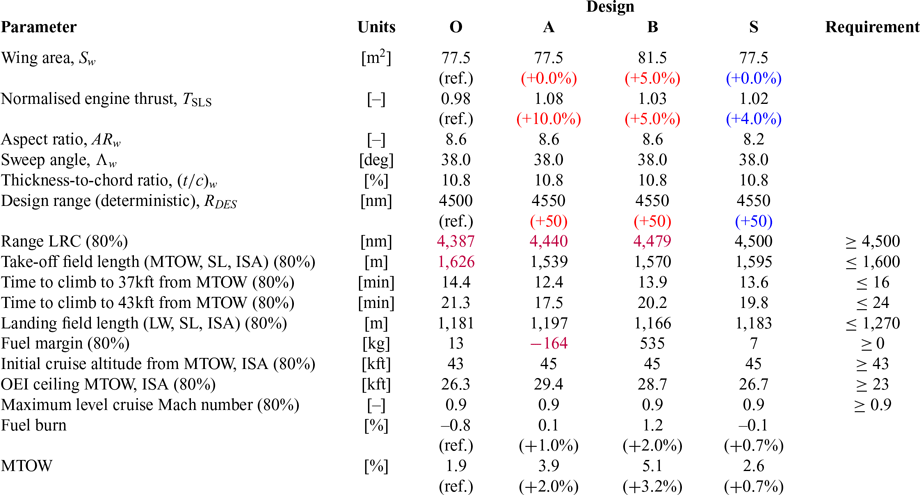
Table 3 presents a comparison between O, A, B and S in terms of design variables, constraint functions and objective function responses. Variations related to the margin-setting strategy are shown in red, whereas the corresponding variations resulting from the OUU process are shown in blue. Violated constraints are highlighted in purple.
A number of findings can be retrieved from Table 3 as follows: As expected, design O – which was optimised deterministically – violates two constraints, namely range and take-off capability at the desired 80% probability of feasibility. On the other hand, the +10% thrust margin applied to design A more than suffices to surpass the required take-off capability. However, even with the +50nm design range margin and the bigger engines, design A violates both range and fuel margin constraints, because despite the increased climb capability that comes with the bigger engines – which can help improve efficiency – bigger engines are heavier and have more wetted area (drag) and since design O was already marginal in fuel volume, an increase in wing area becomes necessary. The combined margin in thrust and wing area embedded in design B is also capable of resolving the take-off capability at 80% probability of feasibility issue of design O. However, the +50nm margin in design range does not suffice to guarantee the 4,500nm range at 80% probability. Differently from design A, which already violates the fuel margin constraint for a 4,550nm design range, design B presents plenty of fuel margin (535kg) and thus a larger range margin could be pursued, and through an MTOW increase, the 4,500nm range at 80% probability would be obtainable, but at the cost of additional worsening of both objective functions. As can be seen in the design S outcomes, the OUU process precisely seeks designs at the edge of the constraints (at the desired probability of feasibility
 $P_0$
). As a result, design S not only complies with all constraints under uncertainty, but it does so with the minimal impacts on the objective functions, as can be seen in Fig. 13.
Traditional margin-setting strategies versus OUU comparison

The reader could argue that a better choice of margins would certainly yield better results. However, regardless of how well chosen the margin strategy is, it will at best yield the same results as the OUU process, which in turn is not driven by previous experience. For instance, the OUU process not only adjusted the wing area and engine thrust in design S, but also changed its aspect ratio to a lower value than its deterministic counterpart. Such a change is explained as follows: In the presence of uncertainty in drag, weight and SFC, the fuel required to accomplish the design range mission for an 80% probability of feasibility is greater than in the deterministic domain whilst the wing fuel capability is lower due to the maximum fuel uncertainty. Therefore, to comply with both range and fuel margin constraints at the 80% probability of feasibility, it is necessary either to increase the wing area or wing thickness-to-chord ratio or to reduce the aspect ratio. The OUU process found that the best compromise, in this case, was to reduce the aspect ratio – which could be a non-intuitive solution even for experienced designers (considering that no such information would be available in a traditional deterministic design procedure).
4.2 Cost of uncertainty
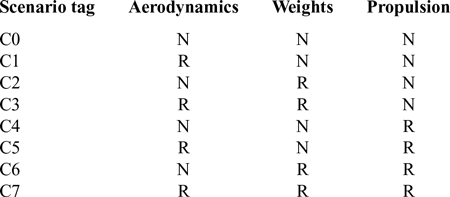
Following the process described in Fig. 7, we define a baseline scenario C0 representing the uncertainty levels for the current company’s state-of-knowledge. The same eight uncertain model parameters previously described are considered and grouped by discipline. The reduced uncertainty level scenarios assume a gain of knowledge by some mechanism (e.g. wind tunnel, flight tests, material properties, higher-fidelity simulations, etc). We consider that the increase in knowledge is discipline-related rather than parameter-related; that is, by running more simulations and tests the entire set of uncertainties in a discipline group is reduced simultaneously. For this exercise, symmetrical triangular distributions were considered as follows: a nominal level of uncertainty of
 $\pm5\%$
and a reduced level of uncertainty of
 $\pm3\%$
. In practice, according to the flow process in Fig. 7, these should be defined with support from SMEs based on foreseen uncertainty reduction experiments. Table 4 presents the matrix of uncertainty level scenarios evaluated, where ‘N’ stands for nominal and ‘R’ for reduced.
Matrix of uncertainty level scenarios

Objective function space: traditional margin-setting strategies compared with OUU.

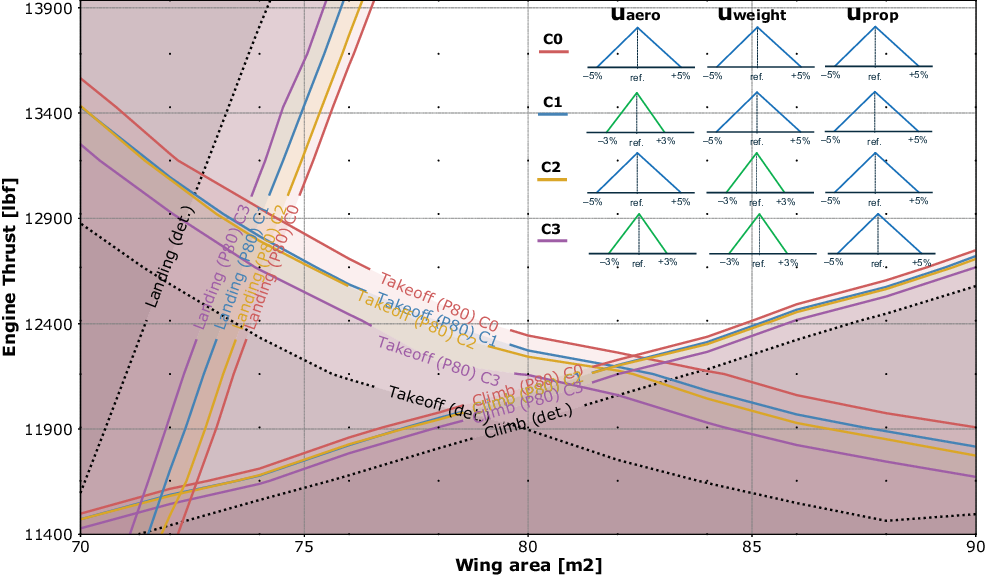
Figure 14 depicts the stochastic constraint analysis results for the baseline scenario along with alternative scenarios C1–C3. The deterministic constraint contours are also included (black dotted) as a reference for what would be obtainable if all uncertainty could be removed. Stochastic constraint contours C0–C3 are shown for a
 $P_0=80\%$
feasibility robustness target.
A number of findings can be retrieved from Fig. 14. For instance, for the landing requirement, reducing aerodynamic uncertainties (C1) presents a greater benefit than reducing weight uncertainties (C2), whereas for the take-off requirement, the opposite applies, with weight uncertainty reductions being slightly more beneficial than aerodynamics uncertainty reduction. For the climb requirement, both alternatives C1 and C2 present quite similar, but small, benefits. For all three requirements, a concurrent reduction in aerodynamics and weight uncertainties (C3) pushes the boundaries of the robust feasible design space further, closer to the deterministic contours.
Cost of uncertainty – constraint analysis.

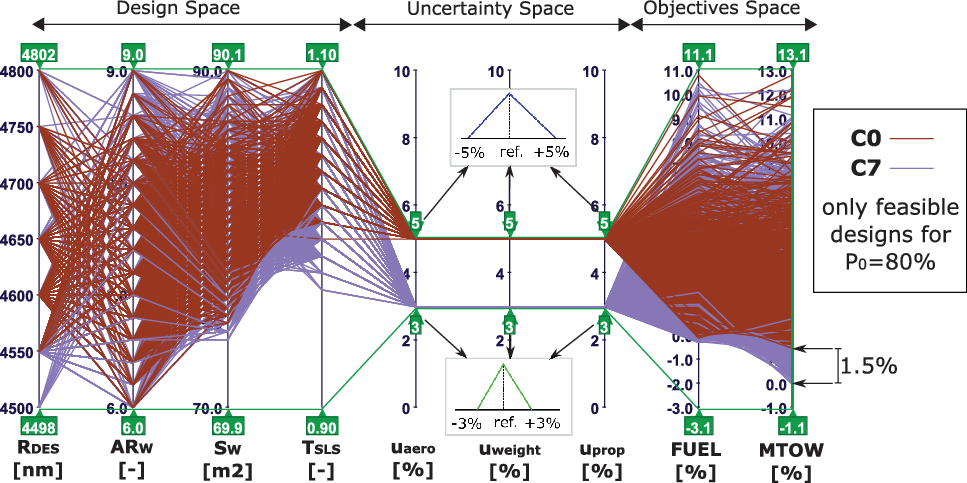
Parallel coordinates plot used to map design, uncertainty and objective spaces. Feasibility robustness set at
 $\textit{P}_{\text{0}}\,\text{=}\,\text{80\%}$
.

The parallel coordinates plot in Fig. 15 shows an example of how to map design variables to the uncertainty space and to objective functions. Two state-of-knowledge scenarios are shown: C0 and C7. Only designs that are feasible for
 $P_0=80\%$
for all constraints in Table 1 are shown.
In Fig. 15, inspection of the left-hand side reveals which combinations of design parameters are made feasible, without compromising robustness, by changing the state-of-knowledge from one scenario to another. On the right-hand side, information about the underlying effects on objective functions can be retrieved. In this case, the minimum MTOW can be improved by some 1.5% whereas the benefit in fuel burn is almost negligible (this will also be evident in the Pareto frontiers in Fig. 16).
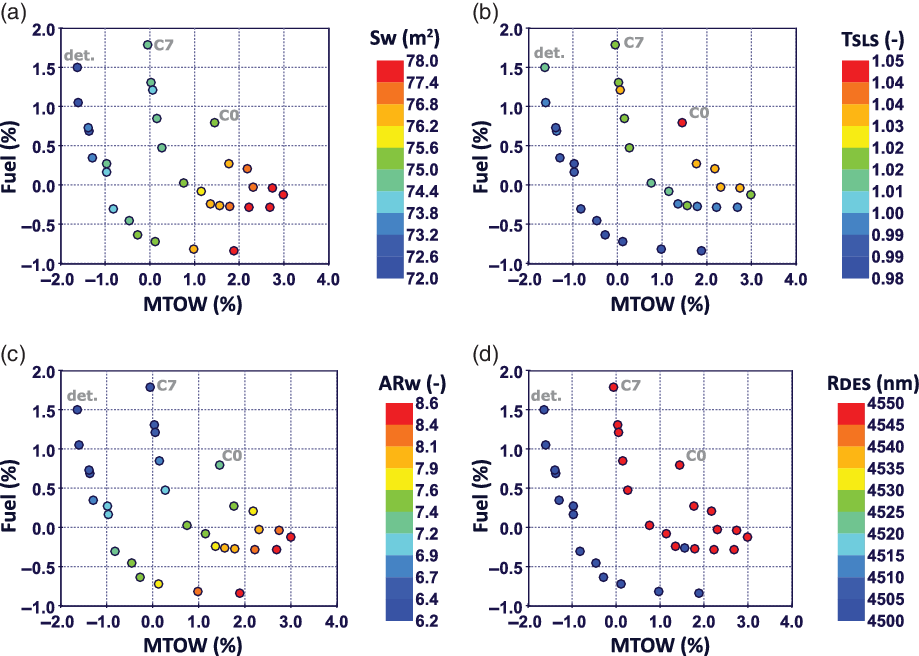
Cost of uncertainty – relationship between design variables and objective functions. (a) Wing area. (b) Engine thrust normalised. (c) Aspect ratio. (d) Design range (deterministic).

The OUU problem is formulated using the constraints described in Table 1 with a desired probability of feasibility
 $P_0$
of 80%. Figure 16 shows the Pareto frontiers obtained for the scenarios C0 and C7. The deterministic Pareto frontier is also shown for reference (as it represents what would be the obtainable Pareto set if uncertainty could be eliminated).
Figure 16 depicts the relationship between each Pareto front and its design variables: (a) wing area, (b) engine SLS thrust, (c) wing aspect ratio and (d) design range (deterministic), providing additional information regarding what changes in the design are allowed by the uncertainty level reduction in order to maintain a given target probability of feasibility.
The behaviour observed in Fig. 16 is analogous to what was observed in the price of feasibility robustness assessment (see Fig. 10), except that now what causes the required wing area and/or thrust to increase is the input uncertainty level, rather than the desired probability of feasibility. Despite being completely different mechanisms, both input uncertainty level and desired probability of feasibility tend to impose changes in the design that are similar to margins: (a) for a given level of input uncertainty, the greater the desired probability of feasibility, the greater the required margins (price of feasibility robustness); (b) for a given desired probability of feasibility, the greater the input uncertainties, the greater the margins that are required (cost of uncertainty). The processes proposed herein explore these concepts in a systematic way to improve overall understanding and assist decision-making under uncertainty.
5.0 Conclusions and future work
This manuscript presents a UMDO framework that is capable of quantifying the required design margins to ensure feasibility at a given robustness target while taking into account model uncertainties associated with current and/or predicted state-of-knowledge. Using visualisation techniques such as contour plots, bubble plots and parallel coordinates plots, the proposed framework allows designers to generate an ‘inter-space’ mapping between design, objectives, feasibility robustness and uncertainty spaces, providing a better understanding of the complex relationships that occur in such high-dimensional problems, especially in practical cases in which the deterministic problem is multi-objective by nature.
Two processes are proposed to aid decision-making in the presence of uncertainty. The price of feasibility robustness process assumes a fixed state-of-knowledge – herein represented by a fixed input uncertainty characterisation – and is used to assess the trade-off between risk (either of redesign or of not meeting market requirements), cost and efficiency. This tool can be used throughout the requirements definition phase and enables a more systematic and conscious definition of the target feasibility robustness, representing a significant improvement over traditional deterministic design margin allocation procedures. On the other hand, the cost of uncertainty process assumes a fixed target feasibility robustness and evaluates a series of ‘what-if’ uncertainty reduction scenarios corresponding to the foreseen execution of knowledge-augmenting experiments. The outcome of this process, combined with the costs of the experiments needed to reduce uncertainty, allows improved selection and prioritisation of experiments within the organisation.
Future work will focus on expanding the proposed framework capabilities and applications. The following topics are already under investigation:
1. Integrating the DAKOTA toolkit to increase the library of UQ methods available in the framework;
2. Conceptual design is often concerned about long-term time frames, which calls for the use of technology forecasting methodologies. Predicting how technology may evolve is inherently uncertain, hence there is an opportunity to adapt the developed framework for selection and prioritisation of future technologies(Reference Amadori, Backstrom and Jouannet67,Reference Amadori, Backstrom and Jouannet68) and technology portfolio decision-making(Reference Gatian and Mavris69–Reference Gatian and Mavris71) under uncertainty. A first pilot case study has been published in Ref. (Reference Jouannet, Amadori, Bäckström and Bianchi72), and a follow-on is to be published next(Reference Bianchi, Amadori, Backstrom and Jouannet73).
3. The proposed framework is a suitable substitute for margin allocation procedures aimed at ensuring feasibility in the presence of model uncertainties. However, margins may also be assigned to ensure product upgradability, which is not covered by the proposed framework in its current form.
Acknowledgements
The authors would like to recognise the Fundaco Casimiro Montenegro Filho (FCMF), Instituto Tecnologico de Aeronautica (ITA) and EMBRAER for direct and indirect support of this research. Any opinions, findings and conclusions or recommendations expressed in this material are those of the authors and do not necessarily reflect the views of the aforementioned supporters.