Copper nanoparticles (Cu-NPs) attracted much attention due to various technological applications[Reference Sarma, Srinivas, Rao and Kumar1–Reference Delgado, Quijada, Palma and Palza5] attributed to their unique optical, conducting, and catalytic properties.[Reference Wei, Chen, Kowalczyk, Huda, Gray and Grzybowski6, Reference Pan, Ming, Yu, Huang, Liu and Kang7] Small metal nanoparticles exhibit the absorption of visible electromagnetic waves by the collective oscillation of conduction electrons at the surface known as surface plasmon resonance (SPR).[Reference Athawale, Katre, Kumar and Majumdar8] Interestingly, due to SPR, Cu-NPs exhibit enhanced nonlinear optical properties, which could be beneficial for applications in optical devices and nonlinear optical materials, such as optical switches or photochromic glasses.[Reference Podsvirov, Sidorov, Tsekhomskli and Vostokov9] In spite of huge application potential, the main challenge remains in the production of antioxidation Cu-NPs with narrow size distribution. To overcome these problems, the reduction of copper salt is usually performed in non-aqueous medium with low precursor concentration, having protective polymers coating and inert gas atmosphere.[Reference Yang, Zhou, Okamoto, Bessho, Satake, Ichino and Okido10–Reference Xiong, Wang, Xue and Wu12]
Copper clusters with diameters about 4 nm have been synthesized within dendrimer templates,[Reference Balogh and Tomalia13, Reference Zhao, Sun and Crooks14] and using electrochemical[Reference Vilar-Vidal, Blanco, López-Quintela, Rivas and Serra15] and microemulsion technique.[Reference Vazquez-Vazquez, Banobre-Lopez, Mitra, López-Quintela and Rivas16] Synthesis of Cu-NPs through a complex chemical reduction technique in the presence of nitrogen atmosphere[Reference Zhang, Siegert, Liu and Cai17] and using an oil bath at 80 °C in the presence of l-ascorbic acid[Reference Xiong, Wang, Xue and Wu12] have also been reported. However, these groups did not observe interband electronic transition along with SPR. In this paper, we present an easier solution based chemical reduction process of synthesizing ultrafine Cu-NPs in water and ethylene glycol (EG) medium in the presence of a capping agent cetyltrimethylammonium bromide (CTAB) below room temperature (RT ~300 K) without inert gas protection. We demonstrated that it is possible to tune the size and optical property by manipulating the reaction temperature and the reaction medium. We are also able to prepare 2.2 nm Cu particles with narrow distribution which display interband electronic transition along with SPR.
Cu-NPs have been synthesized using a solution-based chemical reduction method. An appropriate amount of CTAB (0.01 M) was dissolved in 100 ml water and then cupric chloride (0.05 M) and ammonia solution were added in sequence to maintain pH around 10. Excess hydrazine hydrate (0.5 M), which acts as a reducing agent, was then added to the basic salt solution. The whole process was carried out in a closed bottle and at RT. After about 2 h, the solution turned reddish brown in color confirming the formation of Cu-NPs. The particles were collected by centrifugation, washed several times with ethanol to remove any unreacted ions, and then dried in vacuum. In addition, the reduction process was also carried out in EG medium and at different reaction temperatures (283 K and RT) to attain narrow dispersion of the synthesized Cu-NPs. An alcohol bath was used to cool the reaction bottle for low-temperature synthesis. The samples are designated as S1 (synthesized in water at RT), S2 (synthesized in EG at RT), and S3 (synthesized in EG at 283 K).
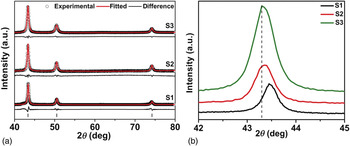
Figure 1(a) shows the X-ray diffraction (XRD) pattern of samples S1, S2, and S3 synthesized at different reaction temperatures. The figure clearly shows that all the peaks can be readily indexed to pure copper (JCPDS file No. 04-0836) with face-centered cubic (fcc) structure. XRD patterns are analyzed using a full profile-fitting program MAUD following the Rietveld method.[Reference Lutterotti18] Refinements of the peak profile parameters have been used to determine the lattice parameters, average crystallite size, and microstrain. Figure 1(b) presents the magnified view of (111) peak of XRD pattern of the samples which shows the broadness of the peaks. The sample S3 shows maximum broadness of peak, in comparison with the other two samples, confirming the presence of smaller crystallites. Rietveld analysis shows a systematic change in lattice strain which may be responsible for the shift in the peak position. The results of XRD analysis are presented in Table S1.
(a) XRD pattern of Cu-NPs synthesized under different conditions (along with Rietveld fit). (b) Magnified view of (111) peak.

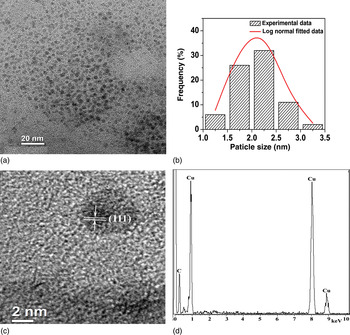
Figure 2a presents the typical transmission electron micrograph (TEM) of sample S3 synthesized in EG medium at 283 K. The sample S3 comprises of narrow dispersed Cu-NPs with the size much smaller than that of sample S1 (Fig. S1). The sample S1 comprises of agglomerated Cu-NPs with average size 20 nm and capped with a layer of CTAB. The average particle size of S3, as calculated from the micrographs using log-normal distribution function, is found to be 2.2 nm (±1.3 nm) and the corresponding histogram is presented in Fig. 2(b). The lattice fringes observed in the high-resolution transmission electron micrograph (HRTEM) presented in Fig. 2(c) depicts the high crystallinity of the particles and the calculated d-spacing corresponds to the (111) plane of Cu. Appearance of only Cu and C lines in the energy dispersive X-ray (EDAX) spectrum [Fig. 2(d)] confirms the growth of pure Cu-NPs. The element C arises from the carbon-coated copper grid on which the sample for TEM was cast. The micrographs confirm the role of EG as a size controller and a capping agent which inhibits the growth of Cu-NPs.[Reference Fievet, Fievet-Vincent, Lagier, Dumontb and Figlarz19] The XRD pattern, Fourier transform infrared spectrum (Fig. S2), and EDAX spectra of the sample indicate the absence of any impurity phase.
(a) Transmission electron micrograph, (b) particle size distribution, (c) High resolution transmission electron micrograph, (d) EDAX spectrum, of S3.

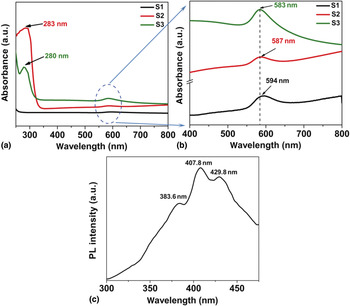
The UV-Vis absorbance spectra of samples S1, S2, and S3 dispersed in ethanol are presented in Fig. 3(a) and a magnified view is presented in Fig. 3(b) for better clarity. The spectra in Fig. 3(a) show the presence of two absorbance peaks for S2 and S3 and only one peak for S1. The peak around 585 nm [Fig. 3(b)] corresponds to SPR of Cu-NPs and is present in all three samples. The position of the observed SPR band for the samples are little red shifted compared with the reported value (~570 nm).[Reference Wu, Mosher and Zeng20] The red shift in the peak position can be attributed to the capping agent CTAB employed here, as the position of the peak depends not only on the size but also on the solvent and capping agent.[Reference Pérez-Juste, Pastoriza-Santos, Liz-Marzán and Mulvaney21] Among the samples, a blue shift in the SPR peak is clearly observed in S2 and S3 compared with S1, which confirms the presence of smaller particle size when prepared in EG solvent which is further decreased due to lowering of reaction temperature.
(a) UV-Vis absorbance spectra of samples S1, S2, and S3 in the range 250–800 nm showing interband transitions. (b) Magnified view of the spectra of samples S1, S2, and S3 in the visible range. (c) RT PL spectrum of sample S3.

It is expected that metal nanoclusters with core diameters around 1 nm or smaller will exhibit one or more absorption peaks due to the molecule-like character of the electronic energy structure, in contrast to the SPR band, observed for clusters having rather larger particles. The absorption spectra of samples S2 and S3 show another peak ~280 nm which can be attributed to interband transitions from d-band to Fermi level.[Reference Wei, Lu, Chen and Chen22] Interband transition is further confirmed from the RT photoluminescence (PL) spectrum of sample S3 recorded after exciting the system with 250 nm [Fig. 3(c)]. The typical spectrum clearly depicts a strong violet emission at ~408 nm. PL spectrum of Cu2O/CuO does not exhibit any emission in this region[Reference Ko, Choi, Okamoto, Tak and Lee23] which reconfirms the appearance of interband transitions of sub-10 nm Cu-NPs. The electrons are excited from d-bands to levels at and levels above Fermi level when the elctromagnetic radiation of wavelength 250 nm impinges on the sample. The other smaller peaks may be due to the transition from states closely lying to the Fermi surface which arises due to distribution in particle size.[Reference Ehrenreich and Philipp24] Interband transition along with SPR is a unique phenomenon not observed earlier in any noble metal NPs. This peak is absent in sample S1 having larger particles which leads to the conclusion that favorable size range of these Cu-NPs suitable for observing both the SPR and interband transition is around 2–10 nm.
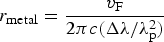
The average radius of the Cu-NPs can also be approximately estimated from the resonance optical absorption spectrum as per the Mie scattering formula, assuming the particles to be spherical
 $$r_{{\rm metal}} = \displaystyle{{v_{\rm F} } \over {2\pi c\lpar \Delta \lambda /\lambda _{\rm p}^2 \rpar }}$$
where v F is the Fermi velocity of Cu-NPs (1.57 × 10⁶ m s−1), c is the velocity of light in vacuum, λ p is the wavelength where surface plasmonic resonance occurs, and Δλ is the FWHM of the absorbance peak. The average radii calculated using Eq. (1) are 7.68, 6.27, and 3.5 nm for samples S1, S2, and S3, respectively. The particle sizes calculated from different techniques are presented in Table S1. Although the sizes estimated from XRD and optical spectra matched well yet, there is slight difference between the particle size estimated from TEM. This is because TEM is a local probe of the material and gives a number-averaged particle size of a few articles, whereas XRD is a bulk sensitive technique.[Reference Roy, Mondal, Sen, Bahadur, Mazumder and Pal25] The broadening of peaks in XRD study, TEMs, and blue shift in the position of the absorption peak strongly suggests that the EG as a solvent and reaction temperature 283 K is best suited for synthesizing narrow dispersed Cu-NPs with smaller sizes.
Synthesis of narrow dispersed stable NPs is challenging and size/structure controlled syntheses with various techniques is still being explored. The reducing property of EG[Reference Fievet, Fievet-Vincent, Lagier, Dumontb and Figlarz19] and high molar ratio of N2H4/CuCl2 (~10) used here enhances the reduction rate favoring the nucleation of Cu seeds, which leads to the formation of smaller particles with narrow size distribution. We have demonstrated the ability of synthesizing ultrafine Cu-NPs having average diameter 2.2 nm by a facile chemical reduction method in ordinary atmosphere without any template. We strongly believe that synthesis at lower temperature is effective here for producing these ultrafine Cu-NPs. Traditionally, Cu-NPs produced at RT or higher, end up with larger particles.
In conclusion, we are successful in preparing ultrafine Cu-NPs through a facile chemical route at lower temperature without inert gas protection and template, previously not reported. XRD and HRTEM study reveals the growth of stable and highly crystalline pure 2.2 nm Cu-NPs. We strongly believe that synthesis at lower temperature helps to restrict the growth of NPs. In addition, we have observed for the first time interband electronic transition along with SPR. These NPs could exhibit great potential toward optical, biological, nanofluidic, and other applications.
Acknowledgments
M. Pal thanks the Council for Scientific and Industrial Research (CSIR) Govt. of India for the infrastructural support. O. Mondal acknowledges University Grants Commission for her fellowship. D.C. thanks Indian National Science Academy, New Delhi, India for an Honorary Scientist's position.
Supplementary materials
For supplementary material for this article, please visit http://dx.doi.org/10.1557/mrc.2013.13
Supporting information
Materials, characterization technique, TEM image of S1 (Fig. S1), FTIR spectrum (Fig. S2), and TGA curve (Fig. S3) of sample S3 for chemical analysis of surface, reaction mechanism, Table S1 (Comparison of particle size as calculated from XRD, TEM and Optical study).