

Introduction
In the run-up to the 2015 general election, the alleged ‘costs’ of EU immigration for the public purse, public services and the labour market dominated much of the political debate in the United Kingdom. This article critiques the notion of ‘benefit tourism’; questions the exceptionality of the British welfare state in the context of EU migrant citizens’ access to social benefits; and suggests ways forward for addressing concerns about geographical concentrations of migration and the impact on social and health services. It starts by providing a brief historical overview of the evolution of EU citizenship and associated social rights, highlighting the semi-sovereign nature of European welfare states. The article then goes on to question (i) the commonly held assumption that EU migrant citizens’ access to benefits is particularly easy in Britain due to the predominantly non-contributory character of the welfare state, and (ii) the perception of EU citizens’ overuse of social benefits. These two aspects are considered by contrasting Britain with Germany. We have chosen Britain and Germany because they both have experienced high levels of EU immigration and are said to constitute archetypes of Liberal and Conservative welfare state regimes (Esping-Anderson, Reference Esping-Andersen1990; Ferragina and Seeleib-Kaiser, Reference Ferragina and Seeleib-Kaiser2011), characterised by very different logics of eligibility, i.e. poverty and need on the one hand and social insurance contributions on the other hand. The article concludes, firstly, that the assumed exceptionality of the British welfare state is overstated, and that, secondly, contrary to popular belief, EU citizens are less likely than national citizens to be in receipt of benefits. A final section then considers how concerns often associated with EU migration can be addressed by improving administrative and state capacities.
European integration and semi-sovereign welfare states
British debates on intra-European migration and EU citizens’ access to social rights frequently overlook the legal concept of EU citizenship (cf. Bruzelius et al., Reference Bruzelius, Chase, Hauser and Seeleib-Kaiser2014) and commonly promote the view that Brussels is stretching its competencies beyond those that the country signed up to when it joined the EU in the 1970s. However, from its inception, European integration aimed to achieve the freedom of movement between Member States of goods, services, capital and workers, and was always intended to be more than purely a trade bloc. From the very beginning of European integration, the freedom of movement of workers (and job seekers) was embedded as an individual (social) right within the European Economic Community, the predecessor of the EU (Hantrais, Reference Hantrais2007), with Article 51 clearly stating: ‘The Council shall, acting unanimously on a proposal from the Commission, adopt such measures in the field of social security as are necessary to provide freedom of movement for workers . . .’.
Over the years, significant progress in specifying the principles of freedom of movement and non-discrimination for migrant workers has been achieved through rulings of the European Court of Justice (CJEU), highlighting the limits of national sovereignty in the realm of social policy. Many of the rulings of the CJEU have been related to the coordination or, in effect, exportability of social security benefits for workers and the application of the principle of non-discrimination (Leibfried and Pierson, Reference Leibfried, Pierson, Leibfried and Pierson1995; Pennings, Reference Pennings2012). But as the CJEU made clear in its Paletta I ruling in 1987, national public administrations have also relinquished their role as sole administrative gatekeepers of the welfare state.Footnote 1 Furthermore, nation states can no longer limit benefits to their ‘own’ citizens nor insist that benefits are consumed within their territory.Footnote 2 Arguably, through these developments national welfare states have become semi-sovereign (cf. Leibfried and Pierson, Reference Leibfried, Pierson, Leibfried and Pierson1995). Nonetheless, recent debates on EU immigration and welfare access in Britain suggest that the idea of ‘semi’-sovereignty is not widely recognised in political circles and conflicts strongly with traditional understandings of parliamentary sovereignty (Cameron, Reference Cameron2013).
The Maastricht Treaty of 1992 established the concept of EU citizenship as a constituent part of the EU. The concept became further embedded into the EU architecture through the Lisbon Treaty and the EU Charter of Fundamental Rights in 2009.Footnote 3 Article 15 of the Charter explicitly states: ‘Every citizen of the Union has the freedom to seek employment, to work, to exercise the right of establishment and to provide services in any Member State’; and article 34 stipulates, ‘Everyone residing and moving legally within the European Union is entitled to social security benefits and social advantages in accordance with Union law and national laws and practices. In order to combat social exclusion and poverty, the Union recognises and respects the right to social and housing assistance so as to ensure a decent existence for all those who lack sufficient resources, in accordance with the rules laid down by Union law and national laws and practices’.
While the Free Movement Directive (2004/38/EC) provides the key piece of EU legislation in relation to the rights of citizens of the Union and their family members to move and reside freely within any EU territory, social rights in particular are regulated by the consolidated EU social security regulations that came into force in 2010 (Regulation (EC) No. 883/2004 and No. 987/2009). Based on the principles of freedom of movement and non-discrimination, these regulations determine that the coordination of social security is no longer limited to economically active persons, but that non-active EU citizens also can have access to special non-contributory social security benefits based on the same criteria as nationals (in Britain: state pension credit; income-based jobseeker's allowance; income-based employment and support allowance; and disability living allowance), as long as they are habitually resident in a Member State.
It is important to emphasise that EU migrant citizens have access to social rights only under certain conditions during the first five years (after which they cannot be treated differently from national citizens) in a new Member State. In order to access rights in the host country, they first need to prove the right to reside. EU citizens have the right to reside (based on Article 7 of the Directive), on the territory of another Member State for a period longer than three months if they are ‘workers’ or ‘self-employed’ persons; have sufficient resources for themselves and their family members not to become a burden on the social assistance system of the host Member State and have comprehensive sickness insurance; are students with comprehensive sickness insurance; or are family members accompanying or joining a EU citizen. EU citizens’ right to access to social benefits in the host country are in other words clearly stratified by their economic status. EU workers (employed or self-employed) have the same rights as nationals from the first day of their employment in another Member State, based on the principle of non-discrimination (for an overview see European Commission, 2014a). By contrast, economically inactive EU citizens and their family members are not eligible for social assistance and are required to have comprehensive health insurance during the first three months of their residence in order not to become an ‘unreasonable burden’ on the Member State.
Uncertainties in the application of the fundamental right to freedom of movement and associated social rights remain, especially with respect to defining legal residence and the minimum conditions of being a ‘worker’. The CJEU has played a pivotal role in interpreting and defining the social rights of EU citizens (cf. Leibfried and Pierson, Reference Leibfried, Pierson, Leibfried and Pierson1995; Pennings, Reference Pennings2012). For instance, in a recent ruling (Dano v. Jobcentre Leipzig – C-333/13) the CJEU determined in relation to the German unemployment assistance benefit (Hartz IV), that these social benefits can under specific conditions be withheld, even though they constitute a mixture of a ‘social assistance’ and ‘special non-contributory social security benefit’.Footnote 4 In the specific case, the person did not have sufficient resources and thus could not claim a right of residence in Germany under the Directive on free movement of EU citizens. Therefore, the person could not invoke the principle of non-discrimination laid down by the directive and by the regulation on the coordination of social security systems.
Defining the minimum conditions for the status of a ‘worker’ under the freedom of movement directive is particularly important for social rights of EU migrant citizens, as workers on low wages or with only a limited number of hours of work, might be eligible for means-tested in-work benefits, such as tax credits, or other assistance and benefits that are unavailable to ‘inactive’ EU migrant citizens during the first five years of their residency. Based on EU case law, part-time workers, even with very limited hours of work, and workers with very low wages, can still fulfil the criteria of ‘worker’ status (Genc v. L and Berlin – C-14/9). This judgement brings into question whether or not the recent restrictive policy of establishing a minimum earnings threshold in Britain is in compliance with EU law. Moreover, questions remain over matters such as how local authorities should classify ‘legal residence’ and practically assess eligibility to social rights of, for example, EU citizens who have worked for some time and then become unemployed and require social assistance payments.
Different welfare states and intra-EU migration
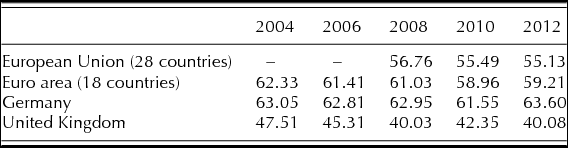
There is a widely held assumption that access to benefits and services by EU migrant citizens is comparatively easy in Britain, where social protection is largely tax financed. By contrast, access to benefits and services in many European welfare states is said to be conditional on having made prior social insurance contributions (see, for example, The Economist, 2013). Britain indeed funds a comparatively low proportion of social protection through social insurance contributions compared to Germany and the EU as a whole (see Table 1).
Social contributions in per cent of total social protection receipts
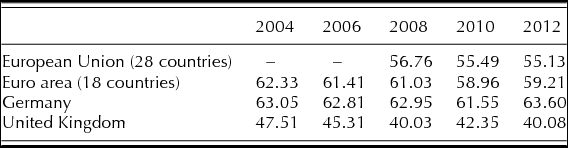
Source: Eurostat, dataset: spr_rec_sumt [accessed August 2015].
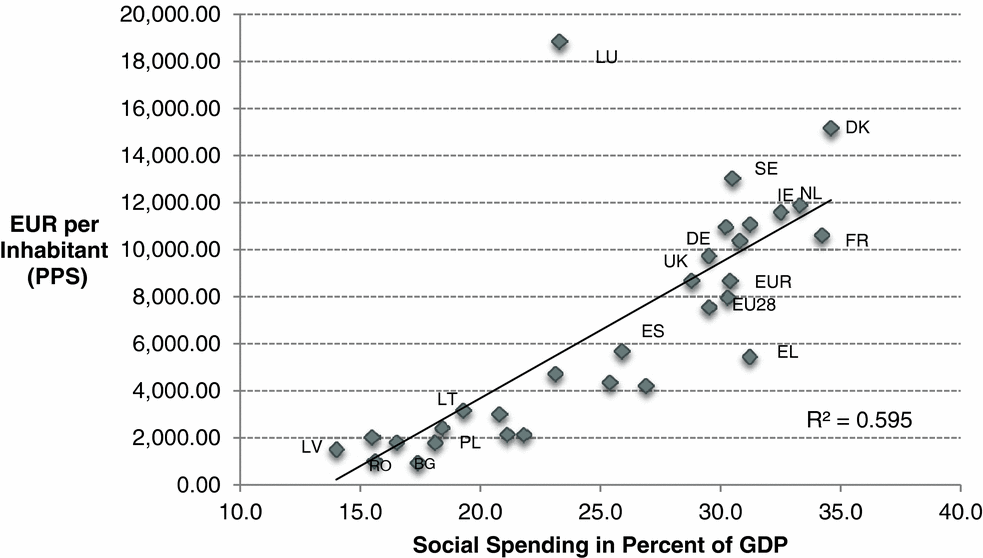
This does, however, not mean that access to benefits is easier in Britain, as there are a number of other factors which require consideration. For instance, overall spending on welfare is somewhat lower in Britain than in Germany and a number of other rich EU Member States. Based on spending per capita, a number of other Member States with welfare systems largely built on the principle of universalism, such as Denmark, the Netherlands and Sweden, appear more generous than Britain (see Figure 1). Secondly, certain benefits that are primarily financed through social insurance contributions in continental European welfare states, such as pensions and long-term care, are not of primary concern to EU migrant citizens who, as discussed later in this article, are predominantly young people of working age. Thirdly, irrespective of how they are classified, in practice each welfare regime contains elements of other regime types (Esping-Andersen, Reference Esping-Andersen1990). Hence, it should be no surprise that healthcare provision in Britain, for example, does not fit neatly with the liberal typology since, unlike other elements of the British welfare system, it is universal and not means-tested. Similarly, it should also not be surprising that Germany, with its strong social insurance financing mechanisms, features a minimum income scheme, which includes means-tested in-work benefits, very similar to those provided in Britain. In other words, the overall financing mechanisms of a welfare state should not be mistaken as indicators of the ease by which EU migrant citizens are able to access specific benefits or services in Member States.
Social spending in percent of GDP and in EUR per inhabitant (PPS) in EU28 in 2012 Source: Eurostat, dataset: spr_exp_ppsh and spr_exp_gdp [accessed August 2015].

Family benefits and in-work benefits have been particularly contentious areas in the debate over freedom of movement in Britain, and therefore warrant further consideration. In Britain, family benefits are typically less generous than those available in Germany or other EU Member States, such as France or Sweden. In this context, it is important to note that childcare services, to which EU migrant citizens have access, are comparatively expensive in Britain. Furthermore, parents in Britain receive a comparatively low (means-tested) child benefit of £82.80 per month for the first child and £54.80 for every further child. The statutory maternity benefit, or equivalent, is paid at a maximum of £558 per month, or at 90 per cent of previous earnings, whichever is lower, for the duration of thirty-three weeks after the receipt of an initial six-week statutory maternity benefit at 90 per cent of previous wage. Germany has a tax-financed, but earnings-related parental leave benefit capped at €1,800 per month (with a minimum of €300 per month irrespective of previous employment history or a minimum of 65 per cent of the previous wage rising to 100 per cent for low-income workers). It also provides a generous monthly universal child benefit of €184 per child for the first two children, €190 for the third child and €215 for every further child (for low-income households there are additional supplements), and in 2013 introduced a legal entitlement to public or publicly funded childcare for every child aged one and older. A family with three children receives €558 (£395) in child benefit per month in Germany, compared to £192.40 per month in Britain. Parents in Germany who do not make use of publically funded childcare can, in addition, receive an extra monthly cash benefit of €150 per child between the ages of one and three.
Subsidising low-wage EU workers, who had previously not ‘contributed’ to the system, was another prominent issue in the British 2015 election campaign, leading the two main political parties to call for ‘waiting periods’ of two to four years before EU migrant citizens became eligible to claim these benefits. However, in-work benefits are not specific to the British welfare state. For instance, in Germany EU migrant citizens can receive (from the day of their arrival in Germany) the tax-financed Hartz IV benefits, if they are low-wage or self-employed workers, in order to bring their low income from work up to a level deemed sufficient for the household (BMI and BMAS, 2014). This benefit, in other words, functions in a very similar way to the various tax credits available to low-income workers in Britain
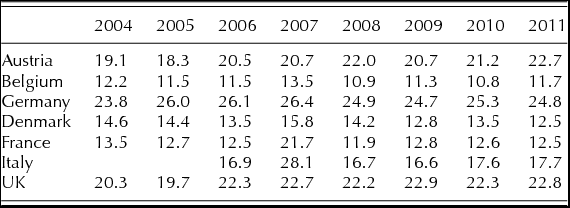
In practice, the number of beneficiaries of in-work benefits depends not only on the design and specific eligibility criteria, but also on the specific labour market and on the incidence of low-paid work. In this regard, it is at times argued that Britain has a flexible, low-wage labour market, making it a particularly attractive destination for EU workers. However, as Eurostat data, as well as OECD data, demonstrate, Britain is not the only rich EU Member State with a significant low-wage sector (Table 2).
Percentage of full-time employees with low gross earnings (less than two-thirds of the median) among the full-time employed, 2004–11
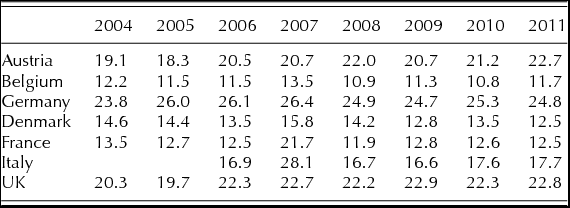
Source: EU-SILC 2005–12.
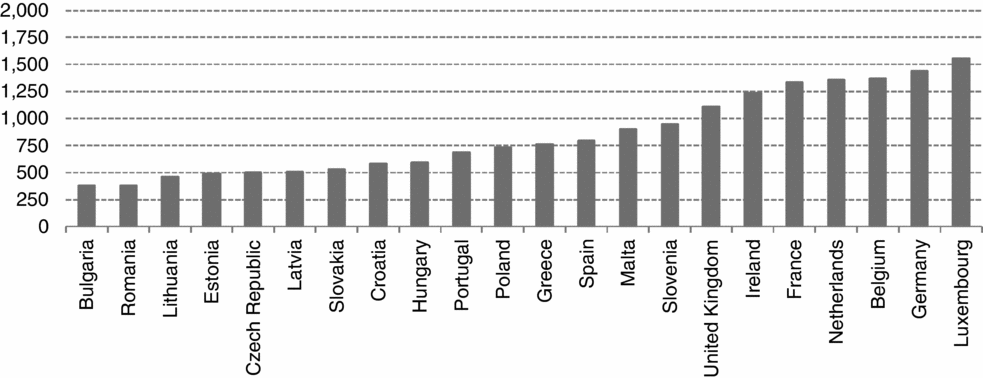
Adding the availability of a (statutory) minimum wage and incorporating the level of the statutory minimum wage at purchasing power standards (PPS), it would seem beneficial for low-wage workers from Central and Eastern Europe (CEE) and southern European countries to move to richer countries in the EU. Compared to the minimum wages in other rich EU Member States, however, the British minimum wage cannot be characterised as unusually high (see Figure 2).
Minimum wages (PPS per month) Note: Estimates. Denmark, Italy, Cyprus, Austria, Finland and Sweden: no national minimum wage. Source: Eurostat, dataset: earn_mw_cur [accessed August 2015].
To sum up, overall expenditure for social protection as a percentage of GDP and per capita in Purchasing Power Standard (PPS) is lower in Britain than in many other rich Member States. Britain is not unique in providing access to in-work benefits for EU migrant citizens. Other important tax-financed benefits, such as family benefits and services, are more generous in Germany, which overall relies more heavily on contribution-based financing. Furthermore, Britain is not the only Member State with a flexible labour market and a relatively large low-wage sector; taking purchasing power parities into account, the statutory minimum wage is not higher than in a number of other Member States.
The alleged cost of EU migrant citizens
For a long time, intra-EU migration remained relatively low, but as a result of the accession of the CEE Member States in 2004 and 2008 and the severe economic crisis, combined with high youth unemployment in Southern Europe, intra-EU migration has significantly increased in recent years (European Commission, 2014b; IFC/GHK, 2013: 20). Britain and Germany have been major destinations of intra-EU migration, each currently having an EU migrant citizen population just short of four per cent of the total population (Eurostat, 2014). The overall majority of EU migrant citizens are of working age and are more likely to be economically active than national populations (European Commission, 2014b). Contrary to the claim of ‘benefit tourism’, the overwhelming majority of EU nationals enter Britain to work. In 2013, 67 per cent of EU migrant citizens stated that their main reason for coming to Britain was for work (compared with 22 per cent for formal study and 8 per cent to join/accompany a family member). Of those who came to work, around 60 per cent had a definite job and 40 per cent were looking for work (HM Government, 2014: 33). Moreover, there is no available evidence that access to benefits was a significant factor in migration patterns (ibid.: 40).
EU migrant citizens in Britain have, in comparison to many other old EU Member States, a particularly young age structure relative to the overall population (Eurostat, 2014), making them more likely to be working and thereby contributing to the economy. According to research by Dustmann and Frattini (Reference Dustmann and Frattini2014), EU migrant citizens make a significant net fiscal contribution to the public purse in Britain.
Yet, although the proportion of EU migrant citizens within the overall population remains small, immigration tends to be clustered in certain geographical areas. Data on national insurance number registrations in Britain, for example, indicate that in 2011/12 42 per cent of all migrants to Britain, including those from the EU, initially settled in London (Department of Work and Pensions, 2012). Such migration patterns can lead to, or amplify, pressures on regional and local public services and labour markets; however, it does not mean that migration has negative economic effects at the nation-state level.
Directly related to the cost of immigration from other EU countries is, of course, the uptake of benefits by EU migrant citizens. A major obstacle to evaluating such uptake for Britain is the absence of any robust longitudinal administrative data on benefit receipt or service use. The government, in its Review of the Balance of Competences between the United Kingdom and the European Union Single Market: Free Movement of Persons, concludes:
We do not record the nationality of benefit recipients at present but are working to improve the data available and have published estimates of the number of migrants accessing benefits using national insurance numbers linked to benefit administration data. With the introduction of the Universal Credit, the Government is looking to routinely collect more robust data on the nationality and immigration status of claimants on benefit payment systems. (HM Government, 2014: 39)
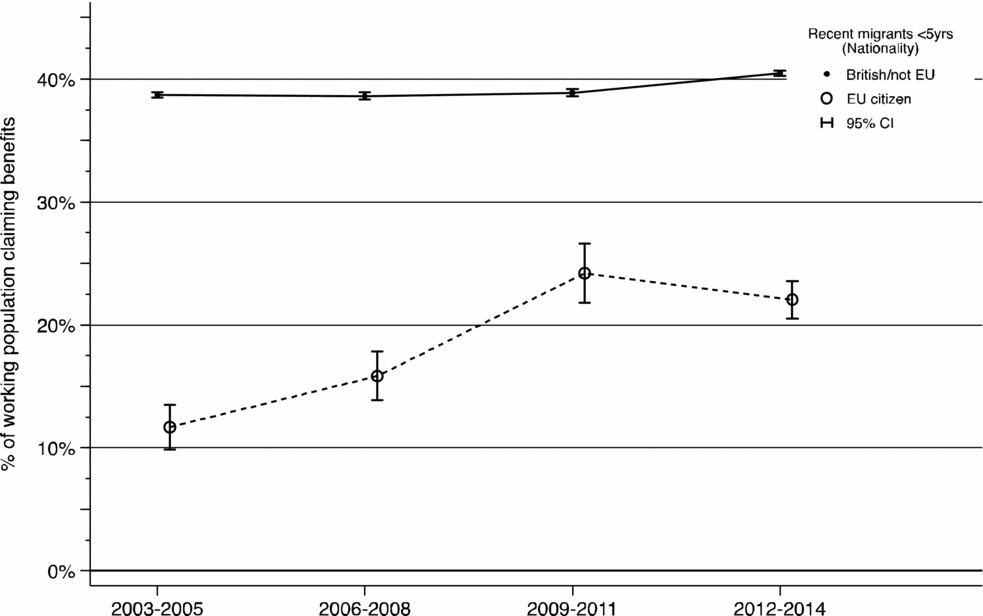
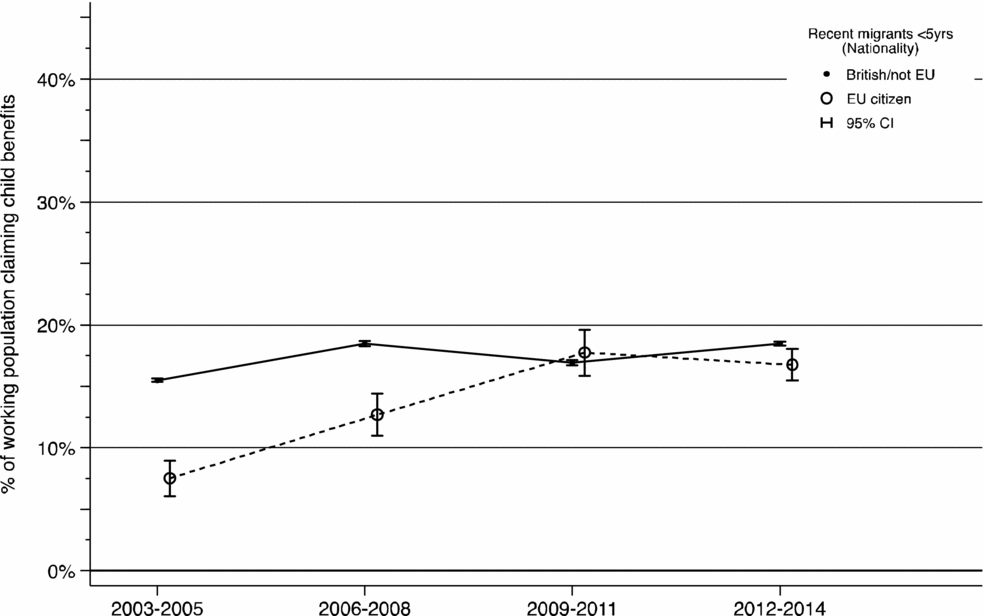
Labour Force Survey data seem to suggest that working-age EU migrant citizens are much less likely to be claiming benefits than British citizens (see figures 3 and 4).
Per cent of the working age population claiming benefits Source: Estimates based on UK Quarterly Labour Force Survey, 2003–14(Q1) – variable TPBEN (Type of Benefit Claimed),5 weighted and adjusted for sampling design. Stata 13.1.
Per cent of working age population claiming child benefits Source: Estimates based on UK Quarterly Labour Force Survey, 2003–14(Q1) – variable TPBEN (Type of Benefit Claimed; cf. note 5), weighted and adjusted for sampling design. Stata 13.1.
With the increase in EU migrant citizens in Germany, the number of recipients of means-tested benefits paid to EU nationals increased. In 2013, 6.13 million residents in Germany received means-tested social assistance benefits for the unemployed (Hartz IV), of which a total of 293,000 were EU migrant citizens, which constitutes less than 5 per cent of the total. Among EU migrant citizens, the highest number of benefit recipients were of Polish (70,000), Italian (63,000) and Greek (39,000) nationality. Benefit receipt among EU migrant citizens from EU2 (12.9 per cent) and EU8 (11.3 per cent) countriesFootnote 6 was lower than among the overall population without German citizenship (16.3 per cent), but higher than the rate of recipients among the total resident population (7.5 per cent) (BMI and BMAS, 2014: 31). The distribution of benefit receipt across Germany is very uneven, with a regional concentration in Berlin and urban centres in the west of Germany. It is important to note, however, that many EU migrant citizens receiving social assistance for the ‘unemployed’ are actually working (this is the in-work benefit discussed above). For instance, in Berlin about 12,000 working EU migrant citizens, including 7,153 from CEE countries (that is EU8 and EU2 combined), received means-tested in-work benefits because their incomes from dependent employment (8,656 workers) or self-employment (3,798) were below the relevant subsistence level for the household. The total number of social assistance recipients from EU27 countries (excluding Germany) in Berlin was 37,632 or 6.6 per cent out of a total of 568,789 recipients.
These numbers show that in Germany the probability of receiving social assistance is higher among EU migrant citizens than among the overall population, particularly among those from CEE countries. However, taking all social transfers, including social insurance benefits, into account, EU migrant citizens are, in fact, much less likely to receive benefits compared with the resident population without a migration background in Germany. Given their demographic profile, it is likely that net migration from Romania and Bulgaria will in the long term have an overall positive impact on the social insurance funds, since migrants from these countries on average are much younger and more likely to be economically active than the domestic population (Brücker et al., Reference Brücker, Hauptmann and Vallizadeh2013).
In the British debate, the receipt of child benefits for children of EU migrant citizens living outside Britain has become a further issue of contention. Based on data from December 2013, Britain was providing child benefit for 34,268 children living in other EEA states (Kennedy, Reference Kennedy2014). This equated to around 0.3 per cent of all child benefit awards, most of which were exported to families in Poland. Far fewer claims for child tax credit are made in respect of children resident in other EEA countries. At the end of December 2012, there were 4,011 child tax credit awards under EC Regulation 883/2004, covering 6,838 children. The data do not provide the nationality of recipients and it is consequently not possible to see how many of the exported benefits were in fact received by British families living abroad. German data in turn reveal that 0.64 per cent of children for whom child benefits are received actually live outside Germany. In absolute numbers, Polish (41,361) and German (23,511) parents constitute the largest groups to export child benefits (BMI and BMAS, 2014: 128).
Finally, the alleged cost and drain to the English national health service is equally an area of contention within current debates on migration and social rights. However, the cost‒benefit ratio is far from clear and it would seem plausible that the contributions by EU migrant citizens outweigh the cost, as they tend to be younger than the average British citizen. Moreover, the NHS has directly benefited from intra-EU migration which has mitigated significant skill shortage within the health service. For instance, 7 per cent of consultants within the NHS have received their qualification in an EEA country other than Britain (Blitz, Reference Blitz2014: 62f). Furthermore, emigration to other EU countries by British citizens, especially pensioners, is said to have contributed to savings for the NHS. British pensioners in receipt of a State Pension abroad, posted workers and temporary visitors to other Member States who hold a European Health Insurance Card, receive healthcare on the same terms as nationals from the ‘host’ Member State, which can then seek reimbursement for treatment from the respective authorities in Britain. As significant numbers of British citizens retire in countries where the average cost of healthcare is lower, such as Spain, this is very likely to result in a net gain for the exchequer (HM Government, 2014: 50).
In sum, given the lack of research evidence or robust administrative data to support the allegations of ‘benefit tourism’, it is surprising that EU migrant citizens are increasingly portrayed as a ‘burden’ on the public purse. Existing data seem to suggest that EU citizens are, if anything, overall less likely than nationals to claim their social rights. Anecdotal evidence from our research suggests that despite the on-going debate about ‘benefit tourism’, in reality many EU migrant citizens are unlikely to claim their social rights due to barriers such as a lack of information about entitlement to rights or insufficient language skills to access information about their entitlements.
Supporting local communities and improving state capacities
Irrespective of the overall economic gain of intra-EU migration for the European Union as a whole and for destination Member States, municipalities can be challenged by high numbers of EU migrant citizens. This suggests that practical solutions to deal with local challenges in providing social services, especially health, education and housing, require support from the national government, potentially allocating available EU funds to mitigate these challenges. However, for local authorities and municipalities to be able to plan services in a rational and effective way requires robust up-to-date data on EU immigration at the local level. Countries with population registers can rely on these. For instance, the German federal government in 2014 has pledged to provide more than €200 million in additional funding, using financial resources from the European Social Fund (ESF) and the Fund for European Aid to the Most Deprived (FEAD) for local communities significantly affected by intra-EU migration. Amongst other initiatives, this funding is intended to avoid homelessness, provide support for migrants from Bulgaria and Romania, especially those from Sinti and Roma communities and fund employment and skills initiatives as well as language courses for EU migrant citizens (BMI and BMAS, 2014). By contrast, the British government does not intend to specifically target any funds from the ESF to local authorities in England that are struggling with pressures on public services as a result of intra-EU migration.Footnote 7 The former EU Commissioner Andor (Reference Andor2015) has emphasised that the ESF exists, among other things, to address issues such as those arising from intra-EU migration. However, the degree to which the ESF or similar funds are utilised to address such challenges depends on decisions by national governments.
In addition to allocating extra funding to local authorities under pressure from intra-EU migration, measures also need to be taken to build the necessary infrastructure, knowledge and skills to enable service providers to effectively apply EU regulations. A study commissioned by the Department of Health in England (Creative Research, 2013), for example, highlighted the lack of knowledge among healthcare professionals within the NHS regarding the eligibility for medical treatment for EU citizens. This has significant implications for the public purse, as considerable amounts of money are seemingly not claimed back from EU citizens’ countries of origin, as should be the case under reciprocal arrangements for care across borders. Furthermore, the British government is not obliged to provide free health services to EU students or economically inactive EU migrant citizens during the first three months of their stay in Britain, but can insist that they have health insurance coverage, as other EU countries do. Improving cross-border charging and implementing obligatory health insurance coverage for instance for EU students and economically inactive EU migrant citizens would reduce the ‘burden’ for the NHS, but require strengthening, and further investment, in the administrative capacities of the NHS.
A further argument frequently employed in political debates is that EU workers undermine the existing terms and conditions of employment in Britain, by working longer hours or for less than the minimum wage. In reality, however, it is in fact the actions of employers and a lack of enforcement by the state that lead to exploitative employment relationships among EU migrants (see for example, Warrell, Reference Warrell2015). According to the Annual Survey of Hours and Earnings compiled by the Office of National Statistics, more than a quarter million workers were paid at less than the minimum wage in 2012, but no company has been prosecuted since 2013 (Boffey, Reference Boffey2014). Instead of scapegoating EU migrant workers, the solution lies in dealing with unlawful practices by British employers. This in turn necessitates improved capacity of the state to enforce minimum labour conditions and the minimum wage, policies which would also directly benefit British workers.
To summarise, it appears politically more acceptable to blame EU migrant citizens or Brussels for some of the challenges and issues associated with EU migration in Britain than it does to address their underlying causes. These include a lack of state capacity or willingness to enforce available regulations or to use available EU funds to address such challenges.
Conclusion
Based on the available evidence it is not possible to substantiate arguments that EU immigration has become an unsustainable burden for Britain, or that the British welfare state is exceptional with regard to its accessibility by EU migrant citizens compared to other European welfare states. In fact, the British welfare state does not radically differ from other welfare states, as many benefits and services relevant for EU migrant citizens are indeed tax-financed, even in those countries that otherwise rely heavily on social insurance contributions to fund social policies. The relatively low proportion of social insurance contributions as a percentage of total social protection funding in Britain is an insufficient indicator for the ease of access to welfare state benefits and services. Moreover, fears of ‘welfare tourism’ are unfounded since available data suggest that EU migrant citizens are less likely to receive benefits and more likely to be in employment than national citizens, partially due to the fact that they are younger than the average British citizen. The challenges often associated with intra-EU migration, therefore, appear primarily to be consequences of a combined lack of political will and state capacity to deal with the new complexities of the welfare state in a semi-sovereign world. Improving state capacity within the constraints of semi-sovereignty could lead to improved services and working conditions for all British residents.
Acknowledgements
We thank Thees Spreckelsen for his support in analysing the data. The research for this article was funded as part of the FP7 project bEUcitizen by the EU Commission (grant no 320294).