Gastric cancer remains a leading global health concern, ranking among the top causes of cancer-related mortality worldwide. According to the International Agency for Research on Cancer, gastric cancer accounted for approximately 1·09 million new cases and 768 000 deaths in 2022, with East Asia bearing a disproportionately high burden due to dietary habits, Helicobacter pylori infection and genetic susceptibility(Reference Siegel, Kratzer and Giaquinto1–Reference Morgan, Arnold and Camargo7). Accurate prognosis prediction in gastric cancer is crucial for guiding personalised treatment strategies. Current staging systems, such as the tumour–node–metastasis (TNM) staging, have been fundamental in classifying the extent of the disease. However, they have limitations in precisely predicting individual patient outcomes. For instance, patients within the same TNM stage can exhibit widely varying survival times and responses to treatment(Reference Smyth, Nilsson and Grabsch8,Reference Cao, Lu and Li9) . This variability highlights the need for additional prognostic biomarkers that can provide more accurate and personalised predictions.
Bioelectrical impedance analysis (BIA) has emerged as a promising tool in the field of medical diagnostics(Reference Malbrain, Huygh and Dabrowski10,Reference Branco, Mateus and Capelas11) . By quantifying body fluid distribution, BIA can reflect underlying metabolic and inflammatory changes in the body(Reference Cotogni, Monge and Fadda12). In cancer patients, these changes are often associated with tumour progression, treatment response and overall prognosis. Body fluids are distributed between the intracellular and extracellular compartments, and any disruption in this balance can have significant implications for cellular function and overall health. BIA measures the impedance of an electric current passing through the body, which is influenced by the volume and distribution of these fluids. Abnormalities in body fluid distribution, as detected by BIA, have been linked to various pathological conditions, including cancer. In gastric cancer, changes in fluid distribution may be related to tumour-induced inflammation, altered metabolism and the body’s response to the disease(Reference Yu, Park and Park13,Reference Kamarajah, Bundred and Tan14) .
The central hypothesis of this study is that alterations in body fluid distribution, as measured by BIA-derived water composition ratios (extracellular water (ECW)/total body water (TBW), intracellular water (ICW)/TBW, ECW/ICW), can serve as independent predictors of survival in gastric cancer patients. We postulate that these ratios can capture the physiological changes associated with gastric cancer progression and treatment response, providing valuable prognostic information. For example, an increased ECW/TBW ratio may indicate enhanced extracellular fluid accumulation, potentially due to tumour-induced inflammation or impaired lymphatic drainage, which could be associated with a poorer prognosis. Conversely, a lower ICW/TBW ratio might suggest reduced intracellular fluid, reflecting cellular dysfunction and potentially predicting a more aggressive disease course. By investigating these relationships, we aim to establish the utility of BIA-derived water composition ratios as novel prognostic markers in gastric cancer.
Materials and methods
Study population
A retrospective analysis was conducted on 385 gastric cancer patients who were treated at multiple tertiary medical centres between 2018 and 2023. Inclusion criteria were as follows: (a) patients aged 18 years or older; (b) patients with histologically or cytologically confirmed gastric malignancy; (c) patients with complete follow-up data and (d) patients with available BIA data. Patients with multiple malignancies or severe comorbidities (e.g. heart failure and renal failure) were excluded. In this study, we strictly adhered to the ethical principles of the Declaration of Helsinki in designing and conducting the research. Our study protocol was approved by the ethics committees of the participating institutions. Written informed consent was obtained from each eligible patient and their family members. To protect patient privacy and personal information, patient records were anonymised and de-identified during the study.
Data collection
Demographic information included age, gender, hypertension, diabetes, smoking and alcohol consumption, tumour stage, family history of cancer, anticancer treatment modality, length of hospital stays and hospitalisation costs. Laboratory data included leucocytes count, neutrophil count, lymphocyte count, platelet count, erythrocytes count, Hb level and albumin level. Nutritional-related data included the Patient-Generated Subjective Global Assessment and cachexia status. The primary outcome of this study was overall survival (OS), defined as the time interval from hospital admission to death or the date of last follow-up.
Bioelectrical impedance analysis measurements
The BIA was performed using the InBody 770 device, a well-established and widely used instrument in the field of body composition analysis. This device measures the impedance of an electric current passing through the body, which is then used to calculate various body composition parameters, including ECW, ICW and TBW. The ratios of ECW/TBW, ICW/TBW and ECW/ICW were the primary parameters of interest in this study. These ratios reflect the relative distribution of body fluids between the extracellular and intracellular compartments and their relationship. All measurements were performed under standardised conditions: patients fasted for 8 h, wore lightweight clothing and removed metal accessories. Measurements were conducted in the supine position with limbs slightly separated to avoid contact, following the manufacturer’s standardised protocol to minimise inter-observer and inter-centre variability. All BIA data were measured after hospital admission but prior to the initiation of any treatment.
Statistical analysis
All statistical analyses were conducted using SPSS 26·0 and R 4.2.1. Missing data were handled using multiple imputation with twenty iterations. Continuous variables were expressed as mean (standard deviation (sd)) or median (interquartile range), based on normality testing using the Shapiro–Wilk test, while categorical variables were reported as frequencies and percentages. Differences in BIA parameters and characteristics between subgroups were evaluated using the independent t test or Mann–Whitney U test for continuous variables and the χ 2 test or Fisher’s exact test for categorical variables. Receiver operating characteristic curves were constructed to determine the optimal cut-off values for the water composition ratios. Restricted cubic splines were used to display the association trends between BIA-based water composition ratios and survival in gastric cancer patients. Kaplan–Meier curves with log-rank tests were employed to compare survival distributions between groups. Cox regression analysis was used to assess the independent association of water composition ratios with OS, with hazard ratios (HR) and corresponding 95 % CI reported. To validate the robustness of the results, subgroup analyses were performed by characteristics subtype. The discriminative ability of BIA-derived water composition ratios was compared using the C-index, a measure of predictive accuracy for survival outcomes. A two-tailed P value of less than 0·05 was considered statistically significant. All tests were adjusted for multiplicity where appropriate.
Results
Optimal threshold of bioelectrical impedance analysis-based water composition ratios in gastric cancer patients
The optimal cut-off values for the BIA-based water composition ratios were determined using receiver operating characteristic curve analysis. For the ECW/TBW ratio, the optimal cut-off value was 0·389, with a sensitivity of 60·5 % and a specificity of 58·3 % for predicting survival outcomes (online Supplementary Figure S1A). For the ICW/TBW ratio, the optimal cut-off was 0·611, with a sensitivity of 59·3 % and a specificity of 58·3 % (online Supplementary Figure S1B). The optimal cut-off for the ECW/ICW ratio was 0·638, with a sensitivity of 60·1 % and a specificity of 58·3 % (online Supplementary Figure S1C).
Clinicopathological characteristics of gastric cancer patients
Among the 385 gastric cancer patients included in the study (online Supplementary Table S1), 69·4 % were male, with a mean age of 58·55 (sd 10·86) years. Comorbidities included hypertension in 15·6 %, diabetes in 8·3 %, a smoking history in 51·2 % and an alcohol consumption history in 27·5 %. A family history of cancer was reported in 67·5 %. TNM staging revealed that 32·5 % were in stages I-II, while 67·5 % were in stages III-IV. Surgical treatment was received by 88·6 % and chemotherapy by 58·2 %. The median Patient-Generated Subjective Global Assessment score was 7, with 44·9 % of patients experiencing cachexia. The 90-d mortality rate was 4·2 %, and the overall mortality rate was 34·0 %. The median length of hospital stay was 11 d, with a median hospitalisation cost of 19 978·40 yuan. Further analysis (online Supplementary Table S2) showed that elevated ECW/ICW and ECW/TBW ratios were significantly associated with male gender (P = 0·002), older age (P < 0·001), advanced TNM stages (III-IV, P = 0·043–0·044), chemotherapy (P < 0·001), low Hb levels (P < 0·001), low albumin levels (P = 0·014–0·015) and higher mortality rates (P = 0·001–0·005). Conversely, an elevated ICW/TBW ratio was associated with female gender (P = 0·003), younger age (P < 0·001), early TNM stages (I-II, P = 0·031), higher Hb levels (P < 0·001), higher albumin levels (P = 0·02) and lower mortality rates (P = 0·009).
Kaplan–Meier curves of bioelectrical impedance analysis-based water composition ratios in gastric cancer patients
For the ECW/TBW ratio, patients with values above 0.389 had significantly shorter OS compared with those below the cut-off (58·7 % v. 72·6 %, P < 0·001) (Figure 1(a)). For the ICW/TBW ratio, patients with values below 0.611 had an OS of 59·1 %, compared with 72·4 % for those above the cut-off (P < 0·001) (Figure 1(b)). For the ECW/ICW ratio, patients with values above 0.638 had an OS of 57·3 %, compared with 73·4 % for those below the cut-off (P < 0·001) (Figure 1(c)). Stratified analyses revealed that in stage I-II patients, elevated ECW/TBW (P < 0·001) (Figure 2(a)), low ICW/TBW (P < 0·001) (Figure 2(c)) and elevated ECW/ICW (P < 0·001) (Figure 2(e)) were all significantly associated with poorer OS. In stage III-IV patients, elevated ECW/TBW (P = 0·032) (Figure 2(b)) and elevated ECW/ICW (P = 0·011) (Figure 2(f)) retained significant prognostic value, while low ICW/TBW (P = 0·052) (Figure 2(d)) did not reach statistical significance.
Kaplan–Meier curve of BIA based-water composition ratios in patients with gastric cancer. (a) ECW/TBW ratio; (b) ICW/TBW ratio; (c) ECW/ICW ratio; BIA, bioelectrical impedance analysis; ECW, extracellular water; ICW, intracellular water; TBW, total body water.

Figure 1 Long description
Three Kaplan-Meier curves depict survival probabilities for different water composition ratios in patients with gastric cancer. Panel A: Kaplan-Meier curve for ECW/TBW ratio. The graph shows survival probability on the y-axis and follow-up time in months on the x-axis. The graph compares two groups: Low (blue line) and High (red line). The Low group has a survival probability of 72.6 percent, while the High group has a survival probability of 58.7 percent. The log-rank test shows a P value of less than 0.001, indicating a significant difference between the groups. The number at risk table below the graph shows the number of patients at risk at different follow-up times for both groups. Panel B: Kaplan-Meier curve for ICW/TBW ratio. The graph shows survival probability on the y-axis and follow-up time in months on the x-axis. The graph compares two groups: Low (blue line) and High (red line). The Low group has a survival probability of 59.1 percent, while the High group has a survival probability of 72.4 percent. The log-rank test shows a P value of less than 0.001, indicating a significant difference between the groups. The number at risk table below the graph shows the number of patients at risk at different follow-up times for both groups. Panel C: Kaplan-Meier curve for ECW/ICW ratio. The graph shows survival probability on the y-axis and follow-up time in months on the x-axis. The graph compares two groups: Low (blue line) and High (red line). The Low group has a survival probability of 73.4 percent, while the High group has a survival probability of 57.3 percent. The log-rank test shows a P value of less than 0.001, indicating a significant difference between the groups. The number at risk table below the graph shows the number of patients at risk at different follow-up times for both groups.
Stratified Kaplan–Meier curve of BIA based-water composition ratios based on TNM stage in patients with gastric cancer. (a) ECW/TBW ratio at Stage I-II; (b) ECW/TBW ratio at Stage III-IV; (c) ICW/TBW ratio at Stage I-II; (d) ICW/TBW ratio at Stage III-IV; (e) ECW/ICW ratio at Stage I-II; F, ECW/ICW ratio at Stage III-IV; BIA, bioelectrical impedance analysis; ECW, extracellular water; ICW, intracellular water; TBW, total body water.

Bioelectrical impedance analysis-based water composition ratios and survival in gastric cancer patients
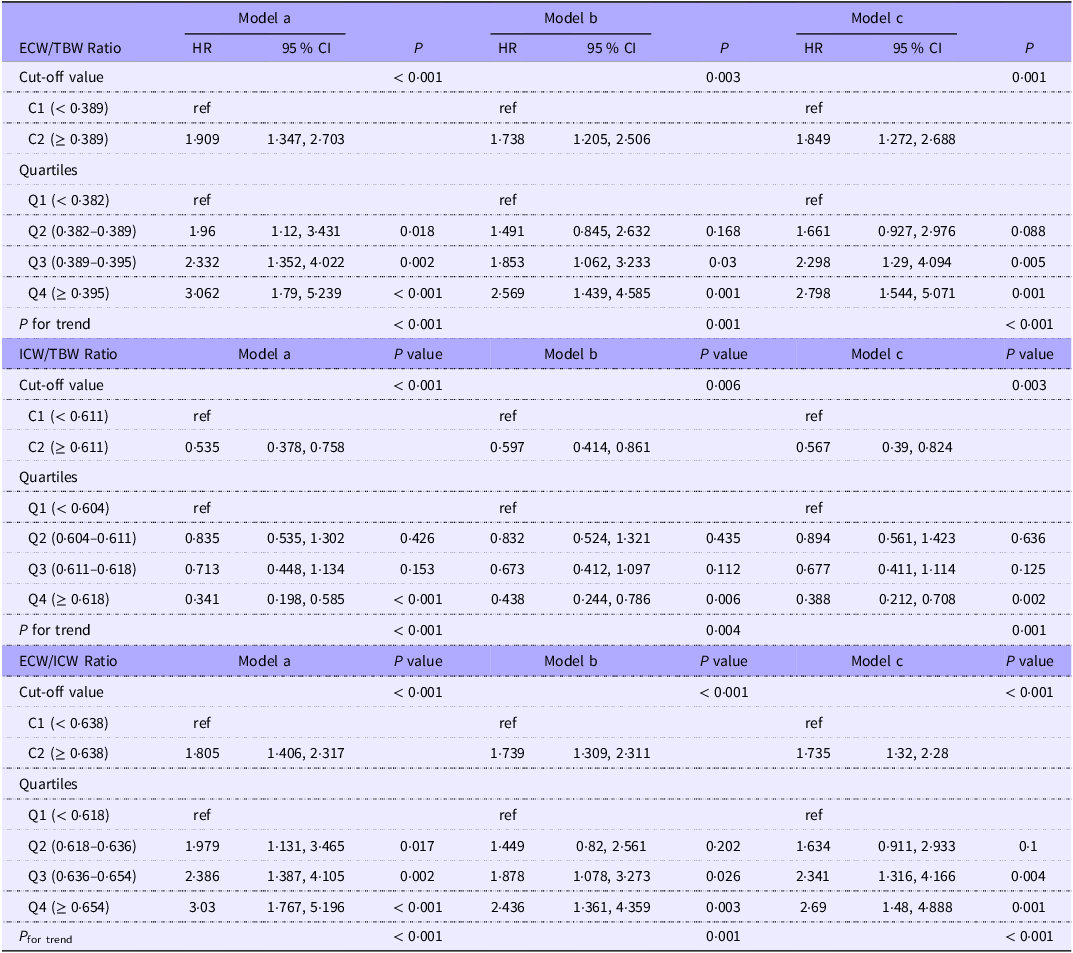
Restricted cubic spline analysis showed that in the unadjusted model (Model a), each one sd increases in ECW/TBW, ICW/TBW and ECW/ICW was associated with HR for all-cause mortality of 1·574 (95 % CI 1·246, 1·987), 0·581 (0·468, 0·721) and 1·805 (1·406, 2·317), respectively, all of which were statistically significant (P < 0·001). After adjusting for age, sex and TNM stage (model b), ECW/TBW (HR = 1·507, 95 % CI 1·162, 1·954, P = 0·002) and ECW/ICW (HR = 1·739, 1·309, 2·311, P < 0·001) remained significant predictors of mortality risk, while the protective effect of ICW/TBW was slightly attenuated but still significant (HR = 0·622, 0·485, 0·798, P < 0·001). Further adjustment for clinical variables (model c) maintained the prognostic value of ECW/TBW (HR = 1·552, 1·202, 2·005, P = 0·001) and ECW/ICW (HR = 1·735, 1·320, 2·280, P < 0·001), with the protective effect of ICW/TBW remaining significant (HR = 0·620, 0·486, 0·790, P < 0·001). These results indicate that these fluid distribution parameters remained independent prognostic indicators in gastric cancer patients after controlling for confounding factors, with the ECW/ICW ratio demonstrating the strongest predictive power (Figure 3(a)–(c)). Multivariable Cox regression analysis showed that higher ECW/TBW (HR = 1·552, 95 % CI 1·272, 2·688, P < 0·001) and ECW/ICW (HR = 1·735, 1·320, 2·280, P < 0·001) ratios independently predicted worse OS. Conversely, a higher ICW/TBW ratio was inversely correlated with mortality (HR = 0·567, 95 % CI 0·390, 0·824, P = 0·003) (Table 1). Quartile trend tests revealed consistent trends for all BIA-based water composition ratios (P < 0·05). The forest plot results in online Supplementary Figure S2 showed significant associations between BIA-based water composition ratios (ECW/TBW, ICW/TBW, and ECW/ICW) and all-cause mortality in gastric cancer patients, with consistent findings across most subgroups.
Association of BIA based-water composition ratio with mortality in patients with gastric cancer. (a) ECW/TBW ratio; (b) ICW/TBW ratio; (c) ECW/ICW ratio; BIA, bioelectrical impedance analysis; ECW, extracellular water; ICW, intracellular water; TBW, total body water. Model a: No adjusted. Model b: Adjusted for age, sex, TNM stage. Model c: Adjusted for age, sex, TNM stage, surgery, radiotherapy, chemotherapy, hypertension, diabetes, smoking, drinking and family history.

Figure 3 Long description
The image contains nine line graphs organized in a 3x3 grid, each representing different models of analysis for fluid distribution ratios and their association with hazard ratios for all-cause mortality in gastric cancer patients. Panel A: Three line graphs show the relationship between the ECW/TBW ratio and the log hazard ratio (HR) for all-cause mortality. The x-axis represents the ECW/TBW ratio, and the y-axis represents the log adjusted HR with a 95 percent confidence interval (CI). Model a shows a positive trend with HR 1.574, Model b shows a similar positive trend with HR 1.507, and Model c also shows a positive trend with HR 1.552. Panel B: Three line graphs depict the relationship between the ICW/TBW ratio and the log adjusted HR for all-cause mortality. The x-axis represents the ICW/TBW ratio, and the y-axis represents the log adjusted HR with a 95 percent CI. Model a shows a negative trend with HR 0.581, Model b shows a similar negative trend with HR 0.622, and Model c also shows a negative trend with HR 0.620. Panel C: Three line graphs illustrate the relationship between the ECW/ICW ratio and the log adjusted HR for all-cause mortality. The x-axis represents the ECW/ICW ratio, and the y-axis represents the log adjusted HR with a 95 percent CI. Model a shows a positive trend with HR 1.805, Model b shows a similar positive trend with HR 1.739, and Model c also shows a positive trend with HR 1.735. Each graph includes a blue line representing the trend and a shaded area representing the 95 percent CI. The graphs indicate that fluid distribution parameters remain independent prognostic indicators in gastric cancer patients after controlling for confounding factors, with the ECW/ICW ratio demonstrating the strongest predictive power.
Association between BIA-based-water composition ratios and survival of patients with gastric cancer

Table 1 Long description
A table comparing the association between BIA-based water composition ratios and survival of patients with gastric cancer. The table has 3 sections: ECW/TBW Ratio, ICW/TBW Ratio, and ECW/ICW Ratio. Each section includes data for Model a, Model b, and Model c, with columns for HR, 95% CI, and P values. The table is divided into rows for Cut-off value and Quartiles, with specific values provided for each category. For ECW/TBW Ratio, the Cut-off value rows show HR values of 1.909, 1.738, and 1.849 for Models a, b, and c respectively. The Quartiles rows show varying HR values across the models. For ICW/TBW Ratio, the Cut-off value rows show HR values of 0.535, 0.597, and 0.567 for Models a, b, and c respectively. The Quartiles rows show varying HR values across the models. For ECW/ICW Ratio, the Cut-off value rows show HR values of 1.805, 1.739, and 1.735 for Models a, b, and c respectively. The Quartiles rows show varying HR values across the models. The table provides a detailed comparison of the prognostic value of different water composition ratios in gastric cancer patients.
BIA, bioelectrical impedance analysis; ECW, extracellular water; ICW, intracellular water; TBW, total body water.
Model a: No adjusted.
Model b: Adjusted for age, sex and TNM stage.
Model c: Adjusted for age, sex, TNM stage, surgery, radiotherapy, chemotherapy, hypertension, diabetes, smoking, drinking and family history.
Comparison of discriminative ability of bioelectrical impedance analysis-derived water composition ratios
The ECW/TBW ratio demonstrated a C-index of 0·587 (95 % CI 0·544, 0·629), serving as the reference. The ICW/TBW ratio had a slightly lower C-index of 0·584 (95 % CI 0·541, 0·627), with a nonsignificant difference of −0·003 (P = 0·142). In contrast, the ECW/ICW ratio showed the highest C-index of 0·596 (95 % CI 0·553, 0·629), which was significantly better than ECW/TBW (difference=0·009, P = 0·024) (online Supplementary Table S3). These results indicate that ECW/ICW outperforms the other ratios in predicting survival, while ICW/TBW does not differ significantly from ECW/TBW in prognostic accuracy.
Discussion
The present multicentre cohort study demonstrates that BIA-derived water composition ratios, specifically ECW/TBW, ICW/TBW and ECW/ICW, serve as independent prognostic markers for survival in gastric cancer patients. These findings expand the current understanding of body fluid distribution as a critical factor in cancer prognosis and align with emerging evidence highlighting the interplay between metabolic dysregulation, inflammation and clinical outcomes. Our results underscore the potential of BIA to refine risk stratification and inform personalised therapeutic strategies, particularly in gastric cancer, where outcomes remain heterogeneous even among patients with identical TNM stages.
The observed association between elevated ECW/TBW and ECW/ICW ratios and reduced survival likely reflects the pathophysiological changes characteristic of advanced gastric cancer. Increased extracellular fluid accumulation, as indicated by a higher ECW/TBW ratio, may stem from tumour-induced systemic inflammation, impaired lymphatic drainage or metabolic disturbances. Chronic inflammation, driven by cytokines such as IL-6 and tumour necrosis factor-α, promotes extracellular oedema and disrupts cellular homoeostasis, contributing to cachexia and organ dysfunction(Reference Mantovani, Allavena and Sica15–Reference Xie, Ruan and Ge18). Conversely, a reduced ICW/TBW ratio, indicative of diminished intracellular hydration, may signal cellular atrophy or mitochondrial dysfunction, further exacerbating disease progression(Reference Neshan, Tsilimigras and Han19–Reference Xiao, Liu and Xie21). These mechanisms are consistent with prior studies linking BIA parameters to sarcopenia, malnutrition and systemic inflammation in cancer patients(Reference Prado, Lieffers and McCargar22,Reference Baracos, Martin and Korc23) . Kamarajah et al. (Reference Kamarajah, Bundred and Tan14) emphasised the prognostic value of muscle mass depletion assessed via BIA in gastric cancer, while Yu et al. (Reference Yu, Park and Park13) identified phase angle – a BIA-derived metric – as a predictor of postoperative complications. Our findings extend this literature by establishing fluid distribution ratios as novel biomarkers that capture both nutritional status and inflammatory burden, offering a more holistic view of disease pathophysiology.
Notably, ECW/ICW demonstrated the strongest independent association with mortality, suggesting its superiority in risk stratification. Routine BIA assessments may help identify high-risk patients who could benefit from early nutritional interventions, targeted anti-inflammatory therapies or intensified surveillance(Reference Arends, Bachmann and Baracos24). The prognostic significance of these ratios persisted even in advanced-stage (III-IV) patients, a subgroup with limited therapeutic options and poor prognoses, highlighting BIA’s potential to guide palliative care strategies such as optimising fluid balance or mitigating cachexia-related complications(Reference Fearon, Glass and Guttridge25). Furthermore, the non-invasive and cost-effective nature of BIA makes it feasible for widespread implementation across diverse healthcare settings, including resource-limited environments where advanced imaging technologies may be unavailable(Reference Kyle, Bosaeus and De Lorenzo26).
Our results align with the accumulating evidence supporting the prognostic utility of BIA in oncology. Branco et al. (Reference Branco, Mateus and Capelas11) emphasised its value in monitoring body composition changes during cancer treatment, while Cotogni et al. (Reference Cotogni, Monge and Fadda12) established links between BIA parameters and chemotherapy tolerance. However, prior studies predominantly focused on muscle mass or phase angle, with limited emphasis on fluid distribution. This study addresses this gap by demonstrating that fluid compartmentalisation – specifically, the ECW/ICW ratio – provides unique prognostic insights beyond traditional metrics. The inverse relationship between ICW/TBW and mortality further supports the notion that intracellular hydration reflects metabolic health, as reduced ICW has been associated with cellular senescence and impaired anabolic capacity in ageing and chronic diseases(Reference Cruz-Jentoft, Bahat and Bauer27). While previous studies have reported associations between ECW/TBW and mortality in general cancer cohorts and even non-cancer populations(Reference Ge, Ruan and Zhang28,Reference Wang, Liu and Hao29) , these works either included heterogeneous cancer types or lacked a focused analysis of gastric cancer-specific cut-off values and prognostic hierarchy. Our study builds on this literature by establishing gastric cancer-specific optimal cut-offs for ECW/TBW ICW/TBW and ECW/ICW and by demonstrating that ECW/ICW outperforms other hydration ratios in predicting survival—an advantage not highlighted in prior heterogeneous cohort studies.
Despite these strengths, including a multicentre design, standardised BIA protocols and rigorous adjustment for confounders, several limitations must be acknowledged. First, the retrospective design precludes causal inferences, and unmeasured variables such as dietary patterns or specific chemotherapy regimens may have influenced outcomes. Additionally, the predominantly East Asian study population limits generalisability to other ethnic groups with differing body composition profiles. While BIA minimises inter-observer variability compared with imaging techniques, hydration status at the time of measurement could affect results. Notably, due to substantial missing data on muscle mass and phase angle – parameters measurable by the InBody 770 device – we were unable to perform a comparative analysis of their prognostic ability with BIA-derived water composition ratios. This represents a key limitation, as these established BIA markers have been previously linked to outcomes in gastric cancer patients. Future prospective studies should ensure complete collection of all BIA-derived parameters to address this gap and validate whether water composition ratios offer additive or superior prognostic value beyond muscle mass and phase angle.
Conclusion
BIA-derived water composition ratios, particularly ECW/ICW, are robust predictors of survival in gastric cancer patients. These ratios reflect underlying inflammatory and metabolic disturbances, offering a practical tool to enhance prognostic accuracy. Incorporating BIA into clinical practice could facilitate personalised risk assessment and guide interventions aimed at improving outcomes in this high-mortality malignancy.
Supplementary material
For supplementary material/s referred to in this article, please visit https://doi.org/10.1017/S0007114526106606
Acknowledgements
The authors would like to thank the INSCOC project members for their substantial work on data collecting and follow-up.
This study was supported by the Youth Science Foundation Project of Guangxi Medical University (GXMUYSF 202548), the 18th batch of Special Funding from the China Postdoctoral Science Foundation (2025T180639), the Self-funded Research Project of the Health Commission of the Autonomous Region (Z-A20250372) and the Young Elite Scientist Sponsorship Program by Cast (YESS20220687).
Conception and design: H. S., H. X., X. Q. and L. W. Administrative support: S. X., B. L., Xi Zhang, and S. W. Data analysis and interpretation: H. X., L. W. Manuscript writing: H. S., H. X., L. W., and X. Q. Final approval of manuscript: All authors.
There are no conflicts of interest