Introduction
Ochlerotatus (Ochlerotatus) albifasciatus (Macquart, 1838), formerly included in the genus Aedes (Reinert, Reference Reinert2000), is the main vector of the western equine encephalomyelitis virus in Argentina (Avilés et al., Reference Avilés, Sabattini and Mitchell1992) and possibly other arboviruses (Mitchell et al., Reference Mitchell, Monath, Sabattini, Daffner, Cropp, Calisher, Darsie and Jakob1987). The finding of Onchocercidae larvae in females collected in the field (Maciá et al., Reference Maciá, García and Campos1995), together with experimental research, suggests it is a potential vector of Dirofilaria immitis (Vezzani et al., Reference Vezzani, Eiras and Wisnivesky2006). It is also a nuisance mosquito affecting beef and dairy production in the southern cone of South America (Hall & Hillyard, Reference Hall and Hillyard1993). During the rainy season, its population outbreaks in central Argentina can result in up to 11% losses in dairy production (Ludueña Almeida, Reference Ludueña1994).
This neotropical floodwater mosquito develops from egg to adult in about a week in shallow temporary ground pools filled with either fresh or brackish water, with or without aquatic vegetation (Almirón & Brewer, Reference Almirón and Brewer1996; Fischer et al., Reference Fischer, Marinone and Schweigmann2002). Immersion of Oc. albifasciatus eggs due to fluctuations of the flooding levels triggers hatching followed by synchronous adult emergence from a larval habitat (Ludueña Almeida & Gorla, Reference Ludueña and Gorla1995), thus adult mosquito abundance during spring and summer is related to larval abundance 7 to 15 days earlier (Gleiser et al., Reference Gleiser, Gorla and Ludueña1997). Female abundance shows pronounced seasonal peaks and is higher in areas prone to flooding, such as wetlands, probably because they offer a higher availability of breeding sites for this mosquito (Gleiser et al., Reference Gleiser, Gorla and Schelotto2000, Reference Gleiser, Schelotto and Gorla2002). A study in the Mar Chiquita (central Argentina) area showed a relation between Oc. albifasciatus abundance and habitat characteristics such as land cover and slope (Gleiser et al., Reference Gleiser, Schelotto and Gorla2002). In the same region, Oc. albifasciatus abundance is higher near larval habitats (Gleiser et al., Reference Gleiser, Gorla and Schelotto2000) and in Salicornia ambigua (Chenopodiaceae) & Sesuvium portulacastrum (Aizoaceae) prairies (Gleiser et al., Reference Gleiser, Schelotto and Gorla2002), a plant community that develops in areas subject to flooding, where subcircular depressions on the ground can provide temporary breeding sites for mosquitoes.
Even though the spatial pattern of Oc. albifasciatus abundance within the Mar Chiquita area has been shown to be influenced by land cover, there are differences in the mosquito productivity that cannot be explained by simple and direct relations between the variables, probably because the spatial distribution of suitable larval habitats change along the breeding season (Gleiser et al., Reference Gleiser, Schelotto and Gorla2002). An approach to explore the relative suitability of the environment for the development of Oc. albifasciatus is to map the available field data on the distribution and abundance of the mosquito within a GIS and then quantify the relationship between the species occurrence and the environmental features, thus defining its environmental preferences (Malone et al., Reference Malone, Yilma, McCarroll, Erko, Mukaratirwa and Zhou2001).
Remote sensors on board meteorological satellites periodically record images from which surrogate climatic variables or environmental proxies may be derived (Hay et al., Reference Hay, Randolph and Rogers2000; Gleiser, Reference Gleiser, Cacchione, Durlach and Larghi2004). Remote sensing is particularly relevant to countries where basic information on the distribution and prevalence of vector-transmitted diseases over extensive areas is lacking, and resources available to deal with disease problems are scarce. Data collected by meteorological satellites can help to significantly improve the efficiency of control or eradication programs for different pests, by indicating areas or periods of the year under higher risk of pest development, as well as other potential sites where they might develop (Randolph et al., Reference Randolph, Green, Peacey and Rogers2000). A previous report indicated that NOAA-AVHRR imagery may aid in the estimation of temporal changes of mosquito abundance in the field, as statistics derived from normalized difference vegetation indices (NDVI) were useful in the estimation of larval Oc. albifasciatus abundance and prediction of adult abundance seven days in advance (Gleiser et al., Reference Gleiser, Gorla and Ludueña1997). The present study complements the former by exploring whether a combination of environmental proxy data, derived from 1-km resolution AVHRR images, can be useful as a rapid tool to locate areas potentially more important for Oc. albifasciatus activity at a regional scale.
Materials and methods
Study area
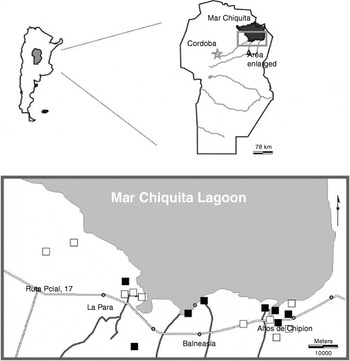
The study area is located in the southern region of Mar Chiquita depression (fig. 1), to the northeast of Córdoba Province, Argentina. The region is covered by a mosaic of cattle pastures and crops that alternate with wetland systems (Menghi & Herrera, Reference Menghi and Herrera1998; Gleiser et al., Reference Gleiser, Gorla and Schelotto2000). Herbaceous vegetation with hygro-halophyllous plant species dominate in lower areas, under fluvial and water table influences, while halophyllous succulent scrublands are associated with elevated areas occasionally subject to flooding. Even though most of the elevated areas that never flood have now become agro-ecosystems (crops and cattle pastures), xero-halophyllous woodlands dominate where natural vegetation is still present (Menghi & Herrera, Reference Menghi and Herrera1995). The climate is temperate, with an average summer temperature of 24°C and average winter temperature of 11°C; rainfalls prevail during the summer (average annual rainfall is 900 mm) (Jarsún et al., Reference Jarsún, Gorgas, Zamora, Bosnero, Lovera, Ravelo, Tassile, Gorgas and Tassile2003).
Location of the study area in central Argentina and the mosquito sampling sites. High abundance represent maximum mosquito abundance at a given site >2500 per trap per night, while low abundance represent <2500 mosquitoes per trap per night on any sampling date. ■, Low abundance; □, high abundance.

Mosquito abundance data
This retrospective study used data on female Oc. albifasciatus abundance that was available from 36 sites, monthly between August and October 1992, biweekly between October to April 1993, and approximately every ten days between October to April 1994–1995, 1995–1996 and 1996–1997. The time frames cover the warm and rainy season, when peaks of mosquito abundance are more likely to occur in the area. In all cases, mosquitoes were collected with CDC miniature light traps baited with dry ice as a source of CO2 operated from dusk to dawn (one trap per sampling site). Latitude and longitude coordinates of the sites were recorded with a global positioning system (GPS) (Garmin Surveyor Global Positioning System) for GIS processing. Details of the sampling sites (including habitat type and presence of potential breeding sites) and temporal pattern of mosquito abundance were already published elsewhere (Gleiser et al., Reference Gleiser, Gorla and Ludueña1997, Reference Gleiser, Gorla and Schelotto2000, Reference Gleiser, Schelotto and Gorla2002).
As the objective of this study was to explore the usefulness of AVHRR imagery to identify areas where Oc. albifasciatus could increase to economically important numbers, data were grouped into two abundance categories according to a mosquito abundance threshold described by Ludueña Almeida (Reference Ludueña1994) as affecting dairy production in the study area. He examined records from dairy farms in the study area and developed estimates of minimum, average and optimal milk production. By comparing expected and observed milk production, he estimated milk loss, which was highly correlated with mean density of Oc. albifasciatus in the sampling area. He reported significant losses ranging from 5 to 11% in milk production when more than 2500 mosquitoes per trap per night of capture were collected. In the present study, categories were termed high abundance (HA) if in a given site, at least for one date, more than 2500 mosquitoes per night of capture were trapped or low abundance (LA) where the maximum number of mosquitoes collected in any date was lower than 2500 mosquitoes per night of capture.
Training sites
Training sites were defined as 3×3 km pixel polygons (9 km2) centred on a mosquito sampling site and digitized into a geographic information system (IDRISI Andes, Eastman, Reference Eastman2006a). From the available data, sites located less than 3 km from at least another site were discarded to avoid overlapping information. Spatial auto-correlation analysis among all sites (Isaaks & Srivastava, Reference Isaaks and Srivastava1989; Eastman, Reference Eastman2006a) did not show a clear indication of spatial dependence between sites, and correlations between pairs of sites located at a range of distances from 1.5 to 10 km was highly variable. Also, captures from traps located 2 to 3 km apart may yield very different collection numbers depending on land cover characteristics (Gleiser et al., Reference Gleiser, Schelotto and Gorla2002); thus, all sites separated by at least 3 km from another site were used in the present study (fig. 1). Training sites were grouped in the two abundance categories (HA and LA) described above.
Satellite imagery
The remotely sensed data used in this study were 1-km AVHRR decadal (every ten days) maximum value composites of channels 1, 2, 4 and 5 (Ch1–Ch5) of northeast Cordoba Province, downloaded from the 1-km AVHRR Global Land Data dataset accessible through the World Wide Web (http://edcsns17.cr.usgs.gov/1KM/1kmhomepage.html). The available data set included images from April 1992 to September 1993 and from February 1995 to January 1996 and May 1996 (comprising a time series with 93 decadal images).
Data of the four channels were used to calculate a set of five biophysical variables, potentially related with the biology of Oc. albifasciatus, as follows:
1. Normalized difference vegetation index (NDVI)=(Ch2−Ch1)/(Ch2+Ch1).
2. Land surface temperature (LST or Tp)=Ch4+A (Ch5−Ch4) (Price, Reference Price1984), where A=3.33 for NOAA7. Ch4 and Ch5 are brightness temperature in Kelvin. The algorithm assumes emissivity Ch4=Ch5.
3. Total precipitable water (U)=A+B(Ch4−Ch5) (Eck & Holben, Reference Eck and Holben1994), where A=1.337 and B=0.387.
4. Near surface dew point temperature TdF=(ln(U)−0.113+ln(λ+1))×0.0393−1 (Smith, Reference Smith1966) (Fahrenheit scale); λ is a function of latitude and season (Smith, Reference Smith1966).
5. Vapor saturation deficit (Vpd)=0.611×(exp(17.27×C)−exp(17.27×D) (Prince & Goward, Reference Prince and Goward1995), where C=(Tp−273)×(Tp−36)−1, D=(TdK−273)×(TdK−36)−1; TdK is near surface temperature expressed in Kelvin.
The volume of data contained in each time series of the five biophysical variables were compressed using a standardized principal component analysis (PCA) (Eastman, Reference Eastman2006a, Reference Eastmanb). In general, the first principal component captures most of the spatial variability, the second component captures most of the summer-winter variability, and the third component captures most of the spring-autumn variability (Eastman & Fulk, Reference Eastman and Fulk1993; Gorla, Reference Gorla2001). These were used as the base-line data to obtain an environmental profile of the study area.
For each of the five time series, the first three components were retained to derive an environmental profile for the two mosquito abundance categories using a stepwise linear discriminant analysis (StatSoft, 2006). The accuracy of the results was estimated as the percentage of sites correctly identified by the discriminant analysis as belonging to a given category. Completeness of the classification was the percentage of field sites assigned to a given category that were correctly identified by the discriminant analysis (Dale & Morris, Reference Dale and Morris1996).
Results
The first seven components of the PCAs represented 97.8% of the total variability for the NDVI time series, 96.23% for the Tp, 79.4% for Vpd, 64.18% for the TdF, and 58.06% for the U. The first three components represented more than 94% of the total variability for the NDVI and Tp time series, while the first three components of the Vpd, TdF and U represented 73.12, 57.87 and 50.91% of the total variation, respectively.
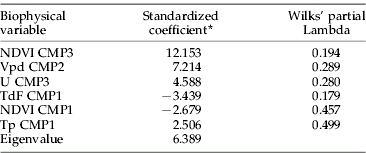
The discriminant function estimated from the three principal components of the five biophysical variables shows that information on these variables have predictive power to discriminate between low and high mosquito abundance, as the linear discriminant analysis correctly classified all 18 field sites. The standardized coefficients of the discriminant function show that the spatial variability of TdF and NDVI has an inverse relationship with the mosquito abundance, as the coefficient signs are negative (table 1). Standardized coefficients also show that the spatial variability has a lower effect than the temporal variability, as component three of VI and U and component two of Vpd are between two and six times bigger than the coefficient associated with the spatial variability. Component three of the vegetation index shows the heaviest load in the definition of mosquito abundance category.
Summary of the discriminant function analysis of the categories high and low maximum abundance.

NDVI, normalized differences vegetation index; TdF, near surface dew point temperature; Tp, land surface temperature; U, total precipitable water; Vpd, Vapour pressure deficit; CMPi, ith principal component. Wilks' Lambda for the general model, 0.13533; approx. F(6,11)=11.714; p<0.001.
* All coefficients were highly significant, P<0.01.
Discussion
Tools that allow forecasting location and timing of Oc. albifasciatus population peaks are desirable due to the medical-veterinary and economic importance of this mosquito species. Previous studies show that monitoring rainfall and average temperature can be useful to predict appearance and development of new cohorts of Oc. albifasciatus (Almirón et al., Reference Almirón, Ludueña and Brewer2000; Fontanarrosa et al., Reference Fontanarrosa, Marinone, Fischer, Orellano and Schweigmann2000; Gleiser et al., Reference Gleiser, Gorla and Schelotto2000). In those areas where ground meteorological stations are scarce, NDVI values from AVHRR imagery data may provide a useful tool for forecasting the dates of emergence of adults from the breeding sites, as a positive correlation between changes in NDVI values and an empirical coefficient that predicts larval presence in the field based on environmental variables has been reported (Gleiser et al., Reference Gleiser, Gorla and Ludueña1997). The results presented here complement the former by accurately classifying an area as potentially yielding high or low mosquito abundance based on remotely sensed variables that are easily obtained from meteorological satellites.
The first component of a PCA over a time series usually represents the mean spatial pattern of the series, and subsequent components extract temporal (seasonal, inter-annual, irregularities, etc.) variability and noise (Eastman & Fulk, Reference Eastman and Fulk1993; Gorla, Reference Gorla2001). It has been reported that the first component of a standardized PCA of a temporal series of AVHRR-NDVI data from NOAA satellites correlates with the mean vegetation index for the period of time analyzed, while the second and subsequent components are related to seasonality (Eastman & Fulk, Reference Eastman and Fulk1993; Lu et al., Reference Lu, Li and Cheng2002). The first component of the NDVI series was significant in the discriminant function, coincident with previous observations in the study area showing a significant relationship between the abundance of Oc. albifasciatus and land cover (Gleiser et al., Reference Gleiser, Gorla and Schelotto2000, Reference Gleiser, Schelotto and Gorla2002). Interestingly, the second component of the Vpd and third components of the NDVI and U were significant in the discriminant function, suggesting that besides changes in the phenotype of the vegetation, the temporal variation at the regional scale in temperature and humidity may be of particular relevance in terms of mosquito production. Tp is an estimate of land surface temperature, while the remaining three biophysical variables (TdF, Vpd and U) are related to moisture. Both temperature and humidity are important in terms of mosquito survival, larval development times and persistence of breeding sites (Ludueña Almeida, Reference Ludueña1994; Gleiser et al., Reference Gleiser, Gorla and Ludueña1997). There is not enough field data in this study linking environmental and mosquito demographic variables to test this hypothesis, so that further studies are necessary to interpret the mechanistic influence of each component on the mosquito biology.
Multi-spectral data provides a number of independent measurements of emitted electromagnetic radiation of the observed surface elements (Agassi & Yosef, Reference Agassi and Yosef1998). Multi-date image-based classifications improve land cover classification and plant identification because plant species with similar spectral reflectance during certain phenological stages typically have different phenologies (Nagendra, Reference Nagendra2001). The results presented here show that a combination of multi-spectral and multi-date data derived from NOAA-AVHRR may be a useful tool to rapidly outline areas with highest potential for the development of abundant populations of Oc. albifasciatus, as 100% of the sites were correctly classified as recording high or low abundance.
This study explored whether remotely sensed information at a rather large spatial scale is useful for rapidly identifying the most productive areas for the floodwater mosquito Oc. albifasciatus. Advantages of this approach are that large areas could be efficiently and effectively examined to assess the most meaningful locations and times for application of mosquito control measures. Results are encouraging, as 100% of the sites assigned to a given abundance category were identified correctly. However, a prospective validation of the proposed model is required before it can be used as a tool to rapidly locate areas with potential to yield highly abundant populations of Oc. albifasciatus and where more intensive field studies should be carried out and/or higher resolution imagery should be used to achieve more precise delineation of the mosquito problem areas.
Acknowledgements
We are grateful to F. Ludueña Almeida for data on mosquito abundance for 1992–1993. We thank the municipal governments of the towns within the study area for their support. We would like to acknowledge two anonymous reviewers for helpful comments on the manuscript. This work was partially funded by FONCYT and SECYT UNC. RMG and DEG are researchers of the National Research Council (CONICET) Argentina.