

In 2002, 10 women were nominated by their parties for governor. Two of these women, Kathleen Sebelius of Kansas and Jimmie Lou Fisher of Arkansas, were nominated under apparently similar circumstances. They both were Democrats and accomplished political women in their state. Sebelius was a successful state legislator and was serving as the elected state insurance commissioner when she decided to seek her party's nomination for governor. Fisher had a successful 30-year career in Arkansas politics and was serving as the elected state treasurer when she decided to run for the nomination in her state. Both women sought to lead geographically similar states where the rural influences on state politics are strong. For all the similarities, however, there was one important distinction between their nominations. Sebelius was nominated to run in what was expected to be a competitive, winnable, open-seat election. Fisher was recruited out of retirement to fight the good fight in an expected loss against a popular incumbent. Predictably, Fisher lost her election against incumbent Mike Huckabee, while Sebelius won and became the second female governor of Kansas.
These two candidacies are examples of different explanations for the nomination of women to elective office. Early research (Carroll Reference Carroll1985; Gertzog and Simard Reference Gertzog and Simard1981) found that women are more likely to win nominations that no one else wants. The researchers found that women were often used as “sacrificial lambs” in hopeless seat elections where the party just needed someone on the ballot as a placeholder to face a seemingly unbeatable incumbent. An alternative explanation is the “pipeline model.” Previous research has argued that one major reason for the lack of female officeholders is the absence of a deep pool of qualified female candidates (Conway, Steuernagel, and Ahern Reference Conway, Steuernagel and Ahern2005; Darcy, Welch, and Clark Reference Darcy, Welch and Clark1994; Ford Reference Ford2002; Welch Reference Welch1978). Therefore, a necessary step for the nomination and election of female candidates is success at lower levels, upon which women build for future successes.
Unlike most of the existing research that focuses on legislative offices, our research addresses the nomination of women for their state's chief executive office. In this study, we explore the applicability of both the sacrificial lamb and pipeline models to the nomination of women as gubernatorial candidates. The study of female legislative candidates has become more productive ever since a substantial number of women became legislative candidates. Before women sought these offices, scholars had little to study. Similarly, now that a small but substantial number of women (76 women from 1976 to 2004) have been nominated by their parties for governor, we take this opportunity to apply this research to gubernatorial nominations.
This is an important step. Early research suggested that female candidates faced different and more severe obstacles when running for executive versus representative offices (Witt, Paget, and Matthews Reference Witt, Paget and Matthews1995). Furthermore, our focus on gubernatorial nominations is important because more recent research suggests that women were less likely to run for “masculine” executive offices such as state governor (Fox and Oxley Reference Fox and Oxley2003). Finally, the office of governor is significant as both an end point and a jumping-off point for the pipeline model. It is the highest ranking position within a state's political structure (the end point of the pipeline) and a common launching point for presidential runs (Watson Reference Watson, Watson and Gordon2003).
In addition, we test for possible partisan differences in pipeline and sacrificial lamb explanations. Recent research on lower-level legislative offices suggests that Democrats are more likely to nominate women for open-seat races, while Republicans are more likely to nominate women to run for tougher seats against popular incumbents (Cooperman and Oppenheimer Reference Cooperman, Oppenheimer, Dodd and Oppenheimer2001; Sanbonmatsu Reference Sanbonmatsu2002). Other research suggests that the sacrificial lamb model is a relic of the past and that women are no more likely to be used in this manner than are male candidates. We test whether this partisan difference also holds for gubernatorial nominations.
The Pipeline Model
Success breeds success. In politics, success at one level often breeds success at the next level. Scholars have examined the qualifications of those who work their way up the political opportunity structure. At the core of much of this research is the logic behind the strategic politician literature (Jacobson and Kernell Reference Jacobson and Kernell1983). This research contends that highly qualified candidates act strategically when they determine whether to seek higher office. The research has been used to study U.S. House (Jacobson and Kernell Reference Jacobson and Kernell1983), U.S. Senate (Abramowitz and Segal Reference Abramowitz and Segal1992), and state gubernatorial elections (Squire Reference Squire1992). The belief is that highly qualified candidates—usually measured as levels of prior political experience—perform better than candidates with lower levels of candidate qualifications. Because prior political experience is an important factor in winning elections, any identifiable group needs some pool of experienced officeholders at one level who can serve as high-quality potential candidates for higher office.
Further research has addressed the advantages of developing a “political pipeline” of experienced and credible female candidates for higher office (Duerst-Lahti Reference Duerst-Lahti, Thomas and Wilcox1998; Oxley and Fox Reference Oxley and Fox2004; Simon and Palmer Reference Simon and Palmer2000). According to Lynne Ford (Reference Ford2002, 107), “the pipeline refers to the group of vetted potential candidates that have met the formal and informal requirements and have been deemed electable.” Since previous literature has argued that one major reason for the lack of female officeholders is the absence of a deep pool of qualified female candidates to draw from (Conway, Steuernagel, and Ahern Reference Conway, Steuernagel and Ahern2005; Darcy, Welch, and Clark Reference Darcy, Welch and Clark1994; Ford Reference Ford2002; Welch Reference Welch1978), a pipeline would offer the parties more experienced and viable female candidates to support for political office. Advancing through the pipeline would also provide women with the experience, connections and legitimacy necessary to seek high-profile executive-level positions (Pearson and McGhee Reference Pearson and McGhee2003; Rogers Reference Rogers1993).
This past research is important for the study of female gubernatorial nominations. It suggests that before women can consistently compete for high-profile elected offices, it is necessary for a party to develop a deep pool of politically experienced female candidates. There are two ways a pipeline can be important. One focuses on the individual candidate. For example, Sebelius worked her way through the pipeline by serving in the state legislature, as state insurance commissioner, and finally as governor.
She was therefore able to develop experience, connections, and credibility as a potential gubernatorial nominee. Although the pipeline is important for candidates regardless of gender, Peverill Squire Reference Squire(1992) suggests that prior political experience may be more important for women than for men.
The second manner in which a pipeline is important focuses on the pipeline itself rather than any one particular candidate. A well-developed pipeline in a state can help pave the way for successful female candidates by building networks for women politicians and convincing potential donors, voters, and activists that a woman can run and win in their state's political environment. Therefore, it is important to understand the success that female candidates have experienced at subgubernatorial levels, and whether this success translates into a greater number of experienced, qualified female gubernatorial candidates.
Understanding that it is important to build a pool or pipeline of potential gubernatorial candidates is easy. Identifying that pool of potential candidates is more difficult. Scholars normally look at lower-level political offices to identify the pool of potential candidates. In examining gubernatorial candidate experience from 1977 to 1989, Squire Reference Squire(1992) reports that candidates typically are former governors, U.S. House members, statewide officeholders, or state legislators. Since there are very few former female governors who could be potential gubernatorial candidates, our research focuses on the other three categories.Footnote 1
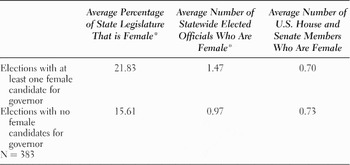
If the development of a pool of potential female candidates is a precursor to more female gubernatorial candidates, then we would expect a strong relationship between levels of female representation at these levels and the emergence of female candidates for governor. The data reported in Table 1 compare the levels of female representation in lower-level offices based upon whether a woman was nominated for governor in that state in a given year. These data provide partial support for such expectations.Footnote 2 To test this relationship, we use the percentage of women in the state legislature (both chambers for bicameral legislatures), the number of women in elected statewide offices, and the number of women elected to the U.S. Congress in the state.
Comparison of female representation in government with and without female gubernatorial candidates, 1976–2004

Note: Asterisks denote p values of 0.05 level or better.
These findings provide support for the pipeline model for two of the three measures. Higher levels of women in the state legislature are related to the emergence of female gubernatorial candidates. The same is true for the number of women who hold lower-level statewide elected offices like lieutenant governor, attorney general, state insurance commissioner, and other statewide elective offices. There does not appear to be a relationship between the number of women in a state's U.S. congressional delegation and the emergence of female gubernatorial candidates. The lack of evidence for the last relationship is not very surprising since very few congresswomen have decided to run for governor—especially when compared to the number of statewide officeholders. Only one congresswoman has received a party nomination for governor. By far the most likely source for gubernatorial candidates among women is lower-level statewide offices (32) and the state legislature (19). Therefore, it is not surprising that the pipeline results indicate a relationship for state legislators and statewide officeholders but not U.S. congresswomen.
The Sacrificial Lamb Model
An alternative explanation for the nomination of women is the sacrificial lamb model. Unlike the pipeline approach, the sacrificial lamb explanation for receiving nominations is not based upon past success. The basis for this model is that parties face a tough situation when trying to fill a nomination for a race they are not expected to win. The strategic politician literature cited earlier suggests that ambitious, well-qualified potential candidates actively seek nominations when their party's prospects look good. Alternatively, these same strong potential candidates will avoid running for office when their chances of winning are low. Why risk being viewed as a loser and hurting future chances for office by running in a hopeless situation?
Early research suggested that parties often turned to women to “take one for the team” by being the sacrificial lamb, since they may not have viewed women as candidates with future careers to protect (Carroll Reference Carroll1985; Gertzog and Simard Reference Gertzog and Simard1981). There are other reasons, however, why parties may turn to female candidates as sacrificial lambs. Party leaders may actively recruit women for these seemingly hopeless races to try to shake up the dynamics of the contest by injecting gender into the race. The lack of interest in the nomination may also clear the way for historically nontraditional candidates like women who seek to be chief executive of their state.
Further factors may be involved in the sacrificial lamb model. Party leaders may more actively recruit women for hopeless races, primary voters may be increasingly willing to nominate women when their party has little chance of winning, or highly qualified male candidates may simply decide to skip these races. Any or all of these explanations may be accurate; determining which part of the party is responsible for using women as sacrificial lambs is, however, beyond the scope of this project. In this article, we are simply interested in whether women are more likely to secure nomination as sacrificial lambs in seemingly hopeless elections. If this model still holds true for one or both parties, the source of such activity can be the subject of future research.
The most fundamental criterion used by scholars to identify “hopeless” seats that attract sacrificial lamb candidates is the presence of an incumbent from the opposing party (Carroll Reference Carroll1985; Gertzog and Simard Reference Gertzog and Simard1981). Research on the incumbency advantage tells us that incumbents have a high likelihood of being reelected; thus, the chances of a challenger defeating an incumbent are highly unlikely. Hence, the presence of an incumbent from the opposing party defines this “hopeless” category.
Two other indicators have been used to identify sacrificial lamb races in the study of legislative politics. One is the competition in a party's primary (Carroll Reference Carroll1985). In cases where candidates who are not incumbents lack competition in the primary, this often means that chances of winning the general election are small; we therefore also categorize these cases as “hopeless.” However, primaries that attract a significant amount of competition often indicate that the chances for the party and its candidate in the general election are good. Alternatively, the lack of primary competition could also be a sign of the party's uniting behind a single strong candidate to maximize chances of capturing a winnable seat.
A second indicator is the level of voter support the winning candidate received in the preceding election. If the winning candidate received at least 60% of the vote in the previous election, we identified this as indicating a strong level of partisan support within that district. Consequently, when partisan support for candidates is less than 40% in the preceding election, these seats are considered “hopeless.” Despite the logic behind this measure of partisan support, 60% of partisan support in the preceding election may not guarantee a safe seat for the party in subsequent elections (Gertzog and Simard Reference Gertzog and Simard1981).
Note that the literature used to define safe seats has focused on legislative rather than gubernatorial elections (Erikson Reference Erikson1976; Weber, Tucker, and Brace Reference Weber, Tucker and Brace1991); measures based on legislative nominations might be less appropriate for gubernatorial elections. Unlike legislative elections, gubernatorial districts cannot be gerrymandered into a safe seat for a political party. Even in an era when we are supposedly polarized into “red states” and “blue states,” there are no safe seats for a party when it comes to gubernatorial elections. In fact, 20 states are currently governed by someone from a party different than the winning party in the state's 2004 presidential election. These include reliably “red states” like Kansas, Oklahoma, and Wyoming and reliably “blue states” like California, Hawaii, and Connecticut. Therefore, we refrain from using these two measures and rely upon the simple and more fundamental measure of whether an incumbent is seeking reelection.
Another variable that may help us understand whether a nomination is a sacrificial lamb nomination is the strength of the state party. Although ultimately a gubernatorial election is a contest between one individual and another individual, the recent success of the party in state politics may be an indicator of potential success in upcoming gubernatorial elections. The most timely measure for any given year is the success of the partisan composition of the state legislature immediately prior to the gubernatorial election. This measure has the advantages of not mixing national party images with state party images and of being as current as possible. Therefore, for this study, we include two measures for the sacrificial lamb model: incumbency status of the gubernatorial race and partisan composition of the state legislature. On the basis of the sacrificial lamb model, we expect women more likely to be nominated for governor when an incumbent from the other party is seeking reelection and/or when they are of the minority party in the state legislature.
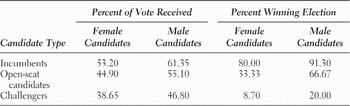
As expected, running as a sacrificial lamb is substantially different from running as a candidate in a race that is expected to be easy or at least competitive. This point is easily seen by looking at vote percentages and winning percentages for candidates based upon incumbency status. In Table 2, we present data from all mixed-gender gubernatorial elections from 1976 to 2004. A comparison of the data is based upon gender of the candidate and whether the candidate was an incumbent, a challenger, or running in an open-seat election. Comparisons between the percent of voting and winning percentage for each of the three groups were conducted using the Analysis of Variance (ANOVA) method. All of the differences reported in the table achieved statistical significance at the 0.05 level.
Percentage vote received and winning elections by candidate type and gender in mixed-gender gubernatorial campaigns, 1976–2004

Note: ANOVA analyses were conducted for Percent of Vote Received and Percent Winning Election using open-seat candidates as the comparison group. The differences reported achieved statistical significance at the 0.05 level. The races in this table include 10 with female incumbents, 39 open-seat races, and 23 female challengers. These data do not include the 4 female gubernatorial candidates who ran against other women (Nebraska 1986 and Hawaii 2002).
The results are exactly as one would expect. Incumbents perform better than candidates for open seats, who, in turn, perform better than challengers running against incumbents. Very few female challengers win election. Furthermore, their average percentage of the vote (below 40%) suggests that many of the races are not even close. In comparison, women running in open-seat elections do better. One interesting observation, based on the numbers reported in Table 2, is that it appears that male candidates fare better at the polls than comparable female candidates. On the basis of average percentage of the vote and winning percentage, male challengers perform about as well as female open-seat candidates, and male open-seat candidates fare as well as female incumbents. Regardless of gender, however, the substantial difference between sacrificial lamb and competitive seats is clearly suggested.
Republican Lambs and A Democratic Pipeline?
The term “gender gap” is generally used in political science to refer to differences in party loyalties among voters, and the typical description is that Democratic candidates are favored by women and Republican candidates are favored by men. More recently, the term has also been used to explain differences in candidate recruitment and election success. In recent work, Rosalyn Cooperman and Bruce Oppenheimer (2001) argue that an important gender gap exists between the parties in recruitment for U.S. House races. In this study of gubernatorial candidates, we explore a partisan gender gap in the nomination of women. In this section, we begin by exploring partisan differences in nomination and success based upon the likely competitiveness of the general election campaign. We then conduct a multivariate analysis to explain the likelihood of a woman being nominated for governor in each party.
A Partisan Gap in the Sacrificial Lamb Model
Like most victories in politics, not all successes are created equal. Is there a partisan difference in the perceived competitiveness of the gubernatorial races in which women are nominated? Since women comprise a larger and more important component of the Democratic Party than do women in the Republican Party, we anticipate that Democratic women will be more likely to receive their party's nomination for governor in a competitive seat than will Republican women. Our expectation stems from the findings of Cooperman and Oppenheimer Reference Cooperman, Oppenheimer, Dodd and Oppenheimer(2001) and Kira Sanbonmatsu Reference Sanbonmatsu(2002), respectively, for U.S. House and state legislative races.
Beyond the previously cited empirical analyses of a partisan gender gap in the nomination of women to elective office, there are other reasons to suspect a partisan gender gap. In her description of the political cultures of the parties, Jo Freeman Reference Freeman(1986) identifies the different career paths in the Democratic and Republican Parties. She states that the success of a constituent group is important within the Democratic Party but not particularly important within the Republican Party; alternatively, Republicans do not take group membership into consideration as much as do Democrats. Freeman writes (1986, 336):
The different structure of the parties has different consequences for the fate of activists. Since the Democratic Party is composed of groups, the success of individuals whose group identification is highly salient, such as blacks and women, is tied to that of the group as a whole. They succeed as the group succeeds. That is not the case within the Republican Party. It officially ignores group characteristics, though it is obvious that it does pay attention to them when it feels the need to cater to the interest of the voting public in a particular group.
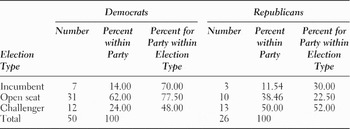
Freeman's description suggests a partisan difference in the nomination of women to office. Similarly, a comparative study of the United States and Great Britain found that the more leftwing party (in the U.S. case, Democrats) is more likely to nominate women to elective office than the rightwing party (Welch and Studlar Reference Welch and Studlar1996).Footnote 3 Based upon research on legislative elections and the culture of the parties, cited earlier, our expectation is that in gubernatorial elections, Democratic women are more likely to be nominated for the more desirable open-seat contests, while Republican women are more likely than Democratic women to be nominated as sacrificial lambs in seemingly hopeless elections. As a simple test of this expectation, we compare the raw numbers and estimate a cross-tabulation of type of election and partisanship for all female gubernatorial candidacies from 1976 to 2004. The results are presented in Table 3.
Partisan comparison of female candidacies by type of election, 1976–2004

Note: Chi-square test suggests that the difference between open-seat and challenger elections is statistically significant (P < .05).
As seen in Table 3, Democratic women are far more likely to be nominated in open-seat elections than are Republican women. One way of looking at this question is to see the partisan breakdown of nominations by type of election. As reported in the table, 77.5% of all women running for governor in open-seat elections are Democrats. Alternatively, 52% of women challenging incumbent governors are Republicans. Therefore, it appears that Republican women are more likely to win their party's nomination when the nominee faces an incumbent seeking reelection. Democratic women, on the other hand, appear to be more successful in obtaining the more desirable open-seat nominations. We can also examine the question by looking at the breakdown of nomination by type of election within each party. The data illustrate that while 50% of the Republican women nominated for governor were challenging an incumbent Democrat, only 24% of the Democratic women were challengers. A full 62% of the Democratic women nominated by their party were in open-seat elections, compared to only 38% of nominated Republican women. These findings are similar to those found by scholars studying U.S. House elections (Cooperman and Oppenheimer Reference Cooperman, Oppenheimer, Dodd and Oppenheimer2001) and state legislative races (Sanbonmatsu Reference Sanbonmatsu2002).
The small number of cases available requires us to conclude with caution. Nonetheless, Republican women appear to be more likely than Democratic women to receive nominations when prospects for winning the general election are low. This pattern is suggested by the partisan difference in the nomination of women to run in open seats or as challengers to incumbent governors. Part of the difference in the partisan makeup of female governors in general is due to the fact that Democratic women specifically have a slightly better chance at winning nomination for a competitive seat, while Republican women are more likely to win nomination as sacrificial lambs. The pattern is clear and is worthy of further study as more cases emerge in the future.
Testing for Partisan Differences in Female Nominations for Governor
Because Democrats are more likely to nominate women to competitive gubernatorial elections, one might expect the importance of the female candidate pool to differ by political party as well. It is reasonable to believe that a strong pipeline is needed in order for women to obtain nominations to competitive seats. Since Democrats are more likely to nominate women in competitive races instead of as sacrificial lambs, we hypothesize that the pipeline theory holds—but only among Democrats. If Republicans are primarily nominating women in hopeless seat situations, a deep pool is not needed for such nominations. It takes only a pool of one to produce a sacrificial lamb.
We test the pipeline and sacrificial lamb explanations using data from all gubernatorial campaigns from 1980 to 2004.Footnote 4 The dependent variable is the nomination of a female for governor. The dichotomous nature of the dependent variable usually means that the data would be analyzed using logit analysis. Because women nominees are still fairly rare, however, we use Rare Event Logit (King and Zeng Reference King and Zeng1999a; King and Zeng Reference King and Zeng1999b; Tomz, King, and Zeng Reference Tomz, King and Zeng1999). The analyses were conducted separately for the nomination of Democratic women and Republican women. Therefore, in the first column the dependent variable is coded 1 if the Democrats nominated a woman for governor and 0 if not. In the second column, the dependent variable is coded 1 if the Republicans nominated a female for governor and 0 if not.
Three different types of independent variables are included in the analyses: pipeline, sacrificial lamb, and state characteristics. The pipeline variables are based on the three levels of office used in Table 1: statewide elected officials, members of Congress, and state legislature membership. For each level, we use the number for each party prior to the election. Therefore, for Democrats, the value for the statewide officeholders pipeline variable in Kansas for 2002 is the number of Democratic women who held statewide elective office in Kansas immediately prior to the 2002 election. Because of the greater attractiveness of running in open-seat races instead of against incumbents, the sacrificial lamb variable is based on the presence of an incumbent in the other party seeking reelection. In the analysis of Democratic nomination of women, a value of 1 is given if there is not a Republican incumbent seeking reelection (thus indicating a desirable open-seat election) and a 0 if a Republican incumbent is seeking reelection. For the analysis of Republican nomination of women, the values are the same but based on the presence of a Democratic incumbent seeking reelection. We also use a measure of the state partisan balance. Because we are focused on the highest office of a state government, we use a measure of state partisan balance based upon the parties’ relative strength in winning state legislative seats. This measure is based on the work and data provided by Carl Klarner Reference Klarner(2003). We used the percentage of the state legislature controlled by the Democrats.
On the basis of the partisan aspect of the pipeline and sacrificial lamb models, we expect a positive relationship between the pipeline variables and the nomination of Democratic women but no relationship with the nomination of Republican women. Furthermore, we expect the first sacrificial lamb variable (open seat) to be negatively correlated with the nomination of Republican women (indicating that they are more likely to be nominated to face a Democratic incumbent), but with no such relationship for Democratic women; and we expect the second variable (state partisan balance) to be positively correlated with the nomination of a Republican woman, but with no such relationship for Democratic women.
In addition to the pipeline and sacrificial lamb variables, we include a number of measures to capture state characteristics. Some studies suggest that political women are more successful in areas where more women have been active in the workforce (Nechemias Reference Nechemias1987; Welch and Studlar Reference Welch and Studlar1996). Therefore, we include the percentage of women in the workforce for each state in a given election year.Footnote 5 Likewise, scholars suggest that region may impact the nomination of women to elective office (Burrell Reference Burrell1994; Lublin and Brewer Reference Lublin and Brewer2003). Like much of the study of American politics, our regional focus concerns the South. Therefore, we include a dummy variable to account for regional effects (1 for southern states, 0 for all other states).Footnote 6 On the basis of the aforementioned literature concerning ideology we also include a measure of citizen ideology (Berry and Ringquist Studlar Reference Berry and Ringquist1998). Because much of the important maneuvering for nomination politics takes place before the election year, we use the measure of citizen ideology for a state from the previous election cycle.Footnote 7 Past research also suggests that women candidates are less accepted in areas with older populations, due to the change in accepted gender roles over time (Lee Reference Lee2001). Therefore, we also include a measure indicating the percentage of a state's population over the age of 65. Finally, we include a dummy variable indicating elections after 1991, given the impact of the 1992 “Year of the Woman” (Wilcox Reference Wilcox, Cook, Thomas and Wilcox1994). It is expected that the nomination of women will be more likely in states with more women in the workforce, in nonsouthern, more liberal, and younger states, and after 1991.
Findings
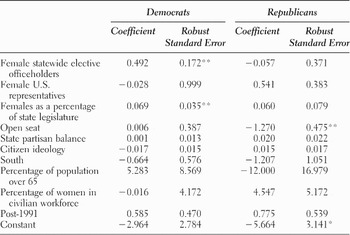
The results of the analyses are reported in Table 4. The findings provide some support for the expected partisan differences. Two of the three pipeline variables reach statistical significance: women as statewide elective officeholders and as a percentage of the state legislature. These findings suggest that the candidate emergence for Democratic women follows the long-standing belief that women as a group first needed to achieve substantial success at one level before they would be successful at higher levels. Note that for gubernatorial candidates, this pipeline comes from both lower-level executive offices and from state legislative offices, and that none of the pipeline variables reach statistical significance among Republicans. This partisan difference supports the findings of Freeman Reference Freeman(1986) cited earlier.
Rare Event Logit analyses of female gubernatorial nominations by party, 1980–2004

Note: ** denotes p values of 0.05 or better in two-tailed tests of statistical significance and * denotes p values of 0.1 or better in two-tailed tests of statistical significance.
The findings also suggest a partisan difference for the sacrificial lamb variable. Women are more likely to be used as sacrificial lambs to run against an incumbent of the other party, but only among Republicans. There was no statistically significant relationship between partisan strength and the nomination of a female candidate for either party. The finding for the first sacrificial lamb variable is consistent with our expectations, based upon the cultural differences of the parties (Freeman Reference Freeman1986) and studies of legislative races at the national level (Cooperman and Oppenheimer Reference Cooperman, Oppenheimer, Dodd and Oppenheimer2001) and the state level (Sanbonmatsu Reference Sanbonmatsu2002). Although there are obviously some high-profile examples to the contrary (for example, Christine Todd Whitman of New Jersey), the general rule seems to be that women in the Republican Party are more likely to be nominated only when the nomination results in the less-than-desirable prospect of facing a Democratic incumbent in the general election.
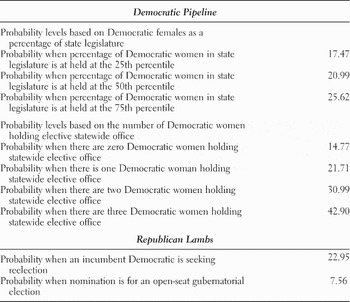
Because logit results are difficult to interpret, we present changes in the likelihood of nominating a woman for governor based on different levels of the statistically significant variables. These results are presented in Table 5. Probabilities based on the percentage of a state legislature's seats controlled by Democratic women are reported in the top part of the table. We used values of that pipeline variable held at the 25th, 50th, and 75th percentile for comparison purposes. A state that has a relatively low percentage of Democratic women in the state legislature (25th percentile) has a 17.47% chance of a woman winning the Democratic nomination. As the presence of Democratic women in that state legislature moves to the 50th percentile, the likelihood increases to 20.99% and increases even move to 25.62% for those states in the 75th percentile. The results for lower-level statewide officeholders are similar. As the number of women Democrats elected to lower-level statewide offices increases from 0 to 1, the likelihood of the Democrats nominating a woman increases from 14.77% to 21.71%. In those instances when there are two female Democrats holding such offices, the likelihood increases to 30.99%. In the rare instances where the number increases to three, the likelihood increases to 42.90%. For both of these pipeline variables, the findings suggest that women are more likely to receive the Democratic nomination for governor under those circumstances where a strong pipeline has developed.
Change in probability of nominating a female for governor due to political conditions

The probabilities for nominations were computed with the setx and relogitq commands in STATA. When computing the probabilities the following variables were held at their mean values: 1) female U.S. Representatives, 2) citizen ideology, 3) percentage of the population over 65, 4) percentage of women in the civilian workforce, and 5) tate partisan balance. Values for the dummy variables were used, indicating nonsouthern states and post-1991. For the probabilities of receiving the Democratic nomination, we used the value indicating no Republican incumbent seeking reelection. When estimating probabilities based on level of Democratic women in the state legislature, the number of female statewide elective officeholders was set at one. When estimating probabilities based on the number of statewide elective officeholders, the percentage of Democratic women in the state legislature was held at its mean. When computing probabilities for receiving the Republican nomination, the number of Republican female statewide officeholders and the value for Republican females as a percentage of the state legislature were held at their mean values.
The comparable results for the significant sacrificial lamb variable are reported in the bottom portion of the table. With all other factors held constant, Republican women are far more likely to receive their party's nomination for governor when a Democratic incumbent is seeking reelection. When a Democrat is seeking reelection, the probability of the Republicans nominating a woman is 22.95%. The probability of the Republicans nominating a woman drops substantially—to only 7.56%—when the nomination is for an open-seat race.
Conclusion
This study began with an exploration of two different models explaining the nomination of women to high office: the pipeline explanation and the sacrificial lamb explanation. Two primary conclusions can be drawn from our findings. First, both explanations are still relevant today, but each explanation is only relevant for one political party. Based upon the gubernatorial elections from 1980 to 2004, our findings suggest that most female gubernatorial candidacies are the result of the tendency of the Republicans to nominate women as sacrificial lambs or the existence of an established Democratic pipeline, conceptualized as a state-level variable. These findings not only are consistent with research at other levels but are also important for the future of women in politics. Because the most likely way to become governor is to avoid running against an incumbent and to secure nomination during an open-seat election, the partisan difference on the sacrificial lamb variable becomes more substantively significant. If this trend continues, the relative advantage of Democratic women running in open-seat elections should lead to an increase in the gap between the number of Democratic and Republican women governors. The increased number of successful women within the Democratic Party may encourage more women to seek higher office, thus reinforcing the partisan difference.
These findings are also important for our scholarly understanding of women in elections. This is the first analysis to address these questions by focusing on gubernatorial nominations. Because the role of a governor as a policy entrepreneur is an important one, and as more women occupy this political office, we should be able to study the questions about the impact of women serving as governor. For men, the office is also a common stepping-stone to the presidency. If we are interested in the question of a woman running for president, we need to understand the politics of women being nominated and elected to the office of governor. Before a woman can be elected governor, however, she must win nomination. This study furthers our understanding of the gender politics behind gubernatorial nominations and, we hope, provides a foundation for further research as more women run for governor.
The partisan difference helps to explain the growing partisan gap found in women's election to office. Since the early 1990s, the relative proportion of Democratic women in office compared to Republican women has grown substantially. If the success of Democratic women is built upon a well-developed pipeline, then we should continue to see large numbers of Democratic women seeking and winning the gubernatorial elections in their states. If the nomination of Republican women is not built upon a pipeline but upon the sacrificial lamb model, we will continue to see the number of elected Republican women diminish in comparison to the number of elected Democratic women.