Introduction
Recently, broadcasting satellites have been extensively used at Ku-band. An antenna is a key component of the telecommunication satellite. It transmits and/or receives waves for a satellite. Spacecraft configuration is largely governed by antenna technology. The objective is to design, fabricate, and characterize a contoured-beam antenna for uplink and downlink in Ku-band. In this article, a single antenna has been designed for 11.7–12.2 GHz for transmit (Tx) and 17.3–17.8 GHz for receive (Rx) bands. The frequency band ratio is 1:1.52 (bandwidth 41.4%). Design challenges begin to occur due to large bandwidth (41.4%) requirement, higher frequencies for receive band (17.3–17.8 GHz), enhanced edge of coverage (EoC) gain requirement at transmit band, accommodation complexity at larger spacecraft platform (enhanced I3K-bus), etc. For this purpose, a Gregorian reflector antenna has been selected and designed. This antenna illuminates 3.5 million square kilometers of landmass, including the Indian mainland, Lakshadweep, and the Andaman and Nicobar (A&N) Islands. The RF performance degrading constituents of the spacecraft body and scatterers are properly identified and compensated by monitoring and control of scattering fields, ray clearance with spacecraft by east tilt and yaw rotation of the complete antenna, and optimization strategies, etc.
A survey of the current state of the art in spacecraft antenna and its emerging trends shows that a number of reflector antenna design procedures have been devised for contoured-beam antennas for satellite communication. Different design solutions have been explored for these purposes [Reference Gupta, Sagi and Mahajan1–Reference Pino12]. Researchers have used different antenna design options for contoured beam applications. Prime focus reflector antenna [Reference Sharma, Rao and Shafai2, Reference Ramesh Chandra Gupta and Mahajan8] suffers from feed blockage and poor aperture efficiency. Single-shell offset reflector antenna [Reference Stutzman and Terada3] suffers from poorer cross-polarization due to asymmetry in geometry toward the offset direction. A dual-gridded reflector (DGR) antenna [Reference Sharma, Rao and Shafai2] provides good cross-polarization, but reduced EoC gain for a rear-shell polarized signal due to high losses caused by inter-coastal structure. Additionally, DGR needs two overlapped 2.5 m shells, which causes a higher weight. Therefore, we have chosen Gregorian reflector antenna to achieve enhanced EoC gain for both polarizations as well as good cross-polar isolation (XPI). Gregorian antenna [Reference Granet4, Reference Fenn, Mills, Robey, Dufilie and Hecht5] provides many advantages over DGR and offset reflector antennas. A Gregorian dual-reflector antenna is designed and configured by complying with Muziguchi’s condition [13, 14] to provide good XPI without degradation of EoC Gain. Main-reflector (MR) and sub-reflector (SR) of Gregorian antenna have offsets in opposite direction, whereas MR and SR of Cassegrain antenna [Reference Granet4] have offsets in same direction. Therefore, Gregorian Antenna is much compact in the horizontal direction and possesses favorable accommodation capability in the lateral direction of the spacecraft; in comparison with the Cassegrain antenna. SR of Gregorian antenna creates amplitude variation of aperture field during shaping. MR of Gregorian antenna makes phase variation of the aperture field during shaping. Whereas, a single shell reflector provides phase variation only during its shaping. This causes an enhancement in EoC gain for Gregorian antenna.
This paper describes the design and development of ϕ2.5 m Gregorian reflector antenna for Contoured Beam covering India and its Islands at 11.7–12.2 GHz (Transmit band) and 17.3–17.8 GHz (Receive band). We have used Common radial corrugated horn with turnstile orthmode transducer (OMT), as a Ku-Tx-Rx feed system. This feed system has a large variation in the phase center for transmit and receive bands due to wide band-separation. It makes shaping challenging to achieve higher EoC Gain. The optimization is carried out to achieve enhanced EoC gain and XPI through surface shaping of MR and SR, as well as the feed coordinate system. We have controlled minimum RoC of the MR and SR surfaces for ease in their fabrication. Scattered fields causing XPI degradation are also carefully monitored and reduced during surface shaping.
Design and shaping of Ku-band Gregorian antenna
The basic design goals for the contoured-beam antenna are listed in Table 1.
Design goal of the Gregorian antenna

First of all, we have computed the diameter of a reflector antenna 2500 mm for required EoC gain over the specified coverage and satellite position at lowest frequency. To fulfill desirable requirements, an East mounted, deployable contoured-beam Gregorian reflector antenna was designed and analyzed. Fig. 1 shows Gregorian antenna model, which is considered in RF analysis, and expanded view of feed system and SR. This single antenna serves both transmit and receive operations at Ku-band to save mass and space at the satellite. This shaped reflector antenna is optimized to cover the Indian mainland, A&N, and Lakshadweep Islands. Due to volume of launch vehicle fairing, constraints are imposed for antenna volume. Hence, antenna diameter is restricted to 2500 mm, and height of the antenna should be lesser than 4500 mm.
(a) Gregorian antenna with nearby potential scatterers. (b) Expanded view of feed system and sub-reflector.

We have carried out several iterations to select optics of Gregorian antenna for its accommodation on spacecraft with no blockage of rays from feed system, SR, and MR. We have used a new technique for Gregorian Antenna placement on spacecraft with suitable RF clearance. Using design equation, we have created parameterized model of Gregorian antenna in Ticra Grasp [14]. We have imported CAD file for spacecraft model. By changing dynamically parameters (MR aperture diameter, MR focal length, angle between MR axis and SR axis, distance between foci, SR eccentricity) of Gregorian antenna, we have checked blockage using ray and visually. The beam center for the Gregorian antenna has been kept at 82.5° East and 22° North. Due to North tilt of the antenna, the rays are blocked by spacecraft panels. We have devised a new method to compensate for the ray blockage due to North tilt of antenna. The antenna is first tilted in Eastward direction and then yaw rotation is applied for blockage-free accommodation of the Gregorian Antenna. The spacecraft is tilted in opposite direction by same amount to nullify electrical impact of east tilt of the antenna. Feed System is equally rotated in opposite direction of yaw rotation of the antenna to compensate for its impact of polarization. East tilt and yaw rotation are also parameterized in the antenna model with spacecraft. Several iterations of east tilt and yaw rotation have been carried out to get its optimized value for blockage-free condition. Also, extensive optics are studied for accommodation of Gregorian antenna and its interfaces at the enhanced-I3K satellite bus. Due to antenna beam center bias, SR moves toward one corner of cutout of the earth viewing (EV) deck. Feed clearance with cutout in EV-panel and inclined panel is obtained by providing 2° east antenna tilt in azimuth direction. To compensate for this tilt, spacecraft is biased by 2° West. To provide SR clearance from EV-Deck and cut-out, complete Gregorian antenna is rotated −2.6° in yaw-rotation. The feed system is rotated in opposite direction (+2.6°) to correct polarization reference of the antenna.
Shaping of MR and SR surfaces has been performed to achieve desired EoC Gain, XPI, minimum RoC, and reduced near field at feed aperture. We have optimized Gregorian antenna for goal of EoC Gain. Subsequently, Gregorian antenna is optimized for goal of XPI, RoC and near field suppression. Each goal has been added one by one after the convergence of RF performance. Different RF goals for optimization of Gregorian antenna have been defined separately for Tx and Rx bands. Scattered Fields in vicinity of aperture of feed system due to reflected ray from SR have been monitored and controlled to avoid degradation in RF performance of the Gregorian antenna. The radius of curvature of MR and SR is controlled to facilitate their fabrication using composite material (carbon fiber reinforced polymer [CFRP]). To minimize ripples in the service area, localized gain and XPI goals are defined and optimized. Spline adjustable surfaces are used for MR and SR shaping. Spline surface is very good for local surface shaping, and its optimization is much faster than Zernike polynomial. Gregorian antenna has been optimized to achieve contoured beam over India, Lakshadweep, and A&N Islands. Minimax-optimization algorithms are used for surface shaping and optimization of RF performance for Gregorian antenna. Feed position wrt FCS (Feed coordinate system) is also kept in optimization to get increased EoC gain at Tx-Band. For contoured beam of Gregorian antenna, we have considered “diverged ray shaping.” Diverge Ray shaping is used, instead of “converged ray shaping,” to get relatively enhanced EoC gain. Further, analysis of Gregorian Antenna is carried out accounting spacecraft panel and other potential scatterers. Iterative re-shaping of the Gregorian antenna is carried out to minimize impact of spacecraft panels. We have adapted multi-interaction analysis using physical optics (PO) and methods of moments (MoM). We have considered feed system, SR, MR, spacecraft panel, SR supporting mast, etc in the analysis. Impact of antenna bias is also considered in RF analysis. Impact of CFRP conductivity of MR and SR has also been accounted for in the analysis. CFRP causes 0.1 dB gain loss in transmit band and 0.3 dB in receive band. Complete antenna with spacecraft scatterers (MR and SR, horn antenna, East panel, feed inclined deck, SR supporting mast, etc) are analyzed using complete 3D- method of moments (MoM) also. Port is defined at horn input. Horn, SR, MR, spacecraft body, SR supporting mast are defined as a scatterer cluster. In 3D-MoM of Gregorian antenna, mutual coupling among scatterers is considered. Enhanced accuracy of the MoM is applied. Sufficient gain and XPI uncertainty are accounted for the analysis. Table 2 depicts parameters and optical details of the Gregorian antenna.
Optics of the Gregorian antenna

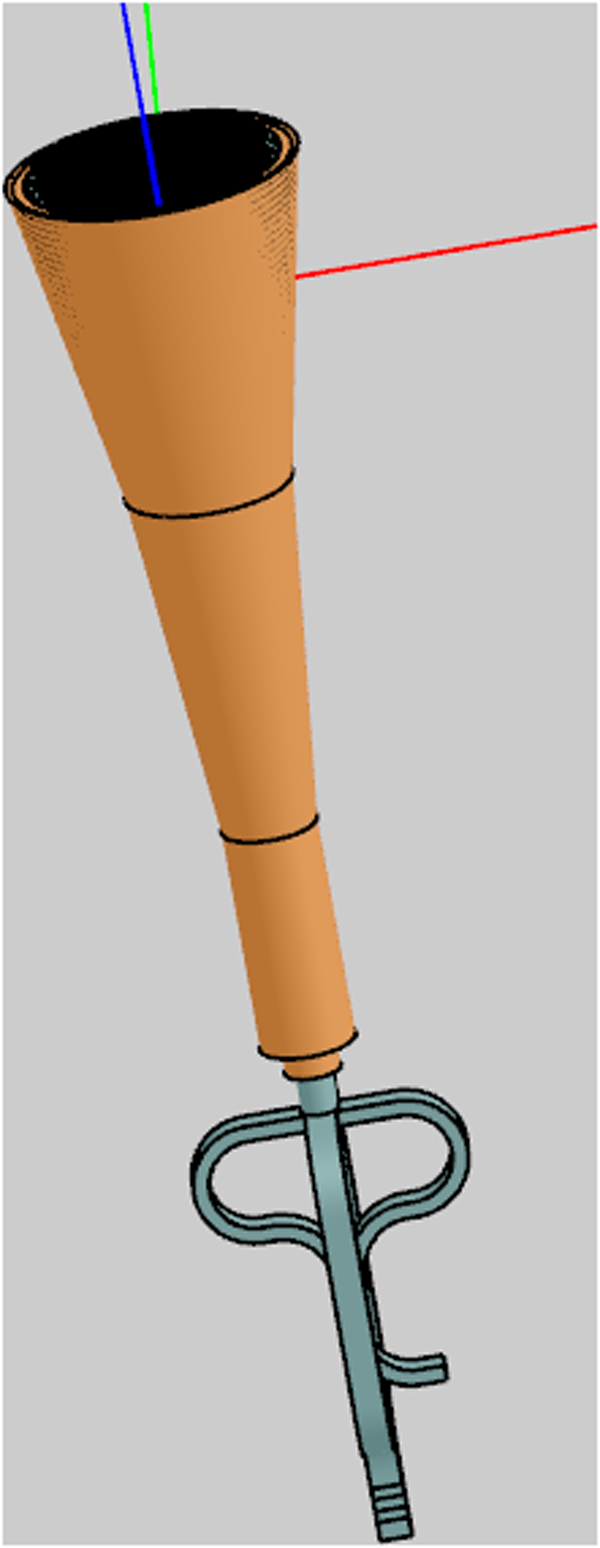
Fig. 2 shows feed systems for Gregorian antenna. We have designed a radial corrugated horn to achieve high illumination taper at edge of SR and to have good cross-polarization over transmit and receive bands. A wideband turnstile junction-based OMT is connected to the horn antenna for dual linear polarizations for both transmit and receive bands. The horn profile, aperture, and semi-flare angle are optimized using Ticra Champ-3D software for the required illumination over the SR edge. For designing and analyzing OMT, mode-matching-based Mician software has been used. An integrated feed system has been analyzed using Ansys HFSS software.
Ku-Tx-Rx feed system for Gregorian Antenna.

Fig. 3 compares amplitude and phase pattern of transmit and receive bands for horn antenna. Horn antenna has large variation for both amplitude and phase for both bands, which poses challenges to comply target RF performance at Tx and Rx bands using single antenna.
Comparison of amplitude and phase patterns of Tx and Rx bands for horn antenna.

The phase center and edge taper of Ku-Tx-Rx feed system have been listed in Table 3.
Characteristics of the feed system

The phase center varies from 2.4λ to 10λ for Tx and Rx bands, which makes it hard to achieve EoC gain at Tx and Rx bands along-with other RF requirements. We have optimized phase center during shaping of Gregorian antenna for higher EoC gain at Tx-band. The optimized value for phase center is −70 mm inside the horn aperture.
Radius of curvatures (RoC) for shaped surfaces of the MR and SR have been constrained doting optimization for its manufacturing with minimum fabrication error. During shaping of MR and SR, we have given minimum curvature constraints of 100 mm in Ticra POS Software. The optimized RoCs are listed in Table 4. The RoC is greater than minimum feasible fabrication value (50 mm).
Surface radius of curvature

SR projected diameter is slightly increased to reduce spill-over losses and enhance EoC gain.
The near field in vicinity of feed due to reflected rays from SR for both polarization is monitored and controlled proactively, in range of −60 to −70 dB, to avoid any RF degradation due to scattered field. The near field, along-with geometry of antenna and ray plots, is shown in Fig. 4.
Near field at feed aperture due to reflected rays from sub-reflector.

Development and measurement of the Gregorian antenna
The MR and SR have been fabricated using CFRP. Fig. 5 shows the photograph of fabricated Ku-Tx-Rx Gregorian antenna and feed system. MR and SR are kept bare-CFRP. Horn and OMT of the feed unit are fabricated using aluminum alloy.
Photograph of fabricated (a) Gregorian antenna, (b) feed system.

Results and discussion
The functional test sequences of the antennas have involved measurement of return loss, gain, and pattern. The antenna pattern and gain were measured in compact antenna test range of Space Applications Centre, Ahmedabad. The measured and predicted results of gain and contour pattern have good matching.
We have also measured return loss at two ports (Lin-H and Lin-V ports) and inter-port isolation of Ku-band feed system, in presence of SR and MR. A portable vector network analyzer (VNA), Anritsu S820E has been used for these measurements Fig. 6. We have calibrated VNA separately for Tx and Rx bands. Coaxial calibration (short, open, matched, and through) has been used. Port-1 of VNA is connected to coupled port of feed (Lin-H Port) and, Port-2 of VNA is attached to direct the port (Lin-V Port).
Photograph of VNA for measuring return loss of feed system.

Measured of return loss is better than 20 dB and inter-port isolation is approximately – 55 dB for Tx Band, as shown in Fig. 7. Measured return loss comply the design target.
Measured of return loss (−ve) and inter-port isolation of Ku-band feed system, in presence of sub and main reflectors, for Tx band.

Measured of return loss is better than 18 dB, and inter-port isolation is approximately −57 dB for Rx-Band and given in Fig. 8. Measured return loss also fulfill the RF requirement.
Measured of return loss (−ve) and inter-port isolation of Ku-band feed system, in presence of sub and main reflectors, for Rx band.

We have used WR-62 test adapters at input ports of feed system for gain and pattern measurement. Test adapter has insertion loss 0.11 dB at Tx band and 0.09 dB at Rx band.
The Gregorian antenna has been analyzed using Physical Optics/Physical Theory of Diffractions (PO/PTD) of Ticra Grasp. For feed system, Mode Matching Technique and MoM have been used from Ticra Champ-3D. Multiple reflections have been considered among scatterers such as MR and SR, feed system. Fig. 9 shows comparison of measured and predicted radiation pattern at 11.72 GHz Lin-V polarization for fabricated Gregorian antenna. There is good correlation between predicted and measured results.
Comparison of measured and predicted contours for (a) EoC gain (b) XPI for Gregorian antenna (11.72 GHz Lin-V), solid line: measured, dotted line: predicted.

Fig. 10 depicts overlaid measured and predicted pattern at 17.32 GHz Lin-H for the Gregorian antenna. Measured and predicted patterns are matching well.
Comparison of measured and predicted contours for (a) EoC gain, (b) XPI for the Gregorian antenna (17.32 GHz Lin-H), solid line: measured, dotted line: predicted.

We have summarized measured and predicted peak gain and EoC gain for Indian mainland for Gregorian antenna in Table 5. Measured EoC gain for Indian mainland is 32.3 dB at Tx band. EoC gain at A&N and Lakshadweep Islands is 29.7 dB for Tx band. Cross-polar isolation (XPI) is −30 dB for Tx channels. Measured EoC gain for the Indian mainland is 31.15 dB at Rx band. EoC gain at A&N and Lakshadweep Islands is 29.7 dB for Rx band. Cross-polar isolation (XPI) is −30 dB for all Rx channels.
Measured and predicted gain of Gregorian antenna

Photogrammetry targets were affixed on MR, during the measurement of pattern and gain of Gregorian antenna Fig. 11. Impact of the photogrammetry target on RF performance of Gregorian Antenna, has been analyzed and found variation of ±0.1 dB in Gain and ±1 dB in XPI.
Photogrammetry targets on surface of main reflector.

The Photogrammetry targets are used to measure surface of MR. Target for photogrammetry are retro-reflective material. Details of photogrammetry targets are given in Table 6.
Details of photogrammetry targets

Photogrammetry target has been modeled for Unit cell analysis in Ansys HFSS. Different layers for the target’s unit cell model are shown in Fig. 12. Using transmission and reflection coefficients, *.tep file in Ticra compatible format is created using Matlab code. *.Tep file has been imported in tabulated electrical properties object of Ticra Grasp software. The tabulated electrical properties are included in object for MR of Gregorian antenna. Thus, impact of photogrammetry targets on RF performance of Gregorian antenna, has been analyzed.
Photogrammetry target (a) layers for the target, (b) unit cell model in HFSS.

Delta-pattern has been computed by subtracting grid-pattern for Gregorian antenna with photogrammetry-target and Pattern for Gregorian antenna without photogrammetry-target. Thus, delta-gain (dB) and delta-XPI (dB) provide impact of photogrammetry targets. Both delta-gain and delta-XPI are plotted in Fig. 13. The gain is varying ±0.1 dBi within coverage, and XPI is varying ±0.5 dB within coverage, due photogrammetry target.
(a) Delta-gain in dB and (b) delta-XPI in dB within the coverage; due to impact of photogrammetry target.

Conclusion
Gregorian Antenna was placed East side on spacecraft using a new method for suitable RF clearance. It is demonstrated using analysis and measurement that photogrammetry targets have a small and negligible impact on RF performance of Gregorian Antenna. Feed coordinate is also optimized during shaping to achieve the goal of higher gain at Tx band. Design complexity and its solution for Gregorian antenna for communication spacecraft has been established and demonstrated by measurement of its engineering model.
Acknowledgments
The authors want to thank Shri Nilesh M. Desai, Director, SAC (ISRO), for his inspiration for scripting the research article. We acknowledge the valuable contribution of the whole engineering team at SAC, whose solid experience was essential to successful design and implementation of the antennas. The list of names is too long to include here, but particular mention must be made of our colleagues Shri Kripa Shankar and Shri Amit Agarwal for fabrication and alignment, respectively, and to engineers from anechoic chamber and compact antenna test range for measurement of the feed system and Gregorian antenna.
Competing interests
The authors report no conflict of interest.

Ramesh Chandra Gupta received the Bachelor of Engineering (Electronics) from Shivaji University in 2000, the Master of Engineering in Communication from Rajiv Gandhi Proudyogiki Vishwavidyalaya in 2002, and Doctor of Philosophy in Electronics from IIT-BHU, Varanasi in 2006. He worked at IIT-BHU as a Senior Research Fellow from 2004 to 2006. He is the author of more than 64 papers in international journals and conferences. He is currently working at Space Applications Centre (SAC), Indian Space Research Organisation (ISRO), Ahmedabad, India, as Head of Advanced Antenna Technology Division from 2024, and a Scientist/Engineer-SG from July 2024 with responsibility for projects concerned with the design and manufacture of antennas and feed systems for satellite communications. He has been with SAC, ISRO as a Scientist/Engineer-SC since 2006. His interests include contoured-beam antenna, steerable-beam antenna, transmit-array, dichroic antenna, dual gridded reflector antenna, and feed-horn antennas for communication spacecraft, antenna design using machine learning, and techno-management. He has delivered 6 expert lectures. He is the Recipient of the Prof Lot Shafai Award-2019. He is serving as a Technical Reviewer for several international journals and conferences. He has guided two master’s scholars for their project work.

Abhishek Shukla completed his Bachelor of Engineering in 2008 from Abdul Kalam Technical University, Uttar Pradesh. He is currently working at Space Applications Centre (SAC), Indian Space Research Organisation (ISRO), Ahmedabad, India, as a Deputy Project Director of Navigation Satellites NVS series. He is a Scientist/Engineer-SF with responsibility for design, analysis, and development of Satcom antennas. He has good expertise in passive intermodulation (PIM) testing of antennas. He has joined SAC, ISRO as a Scientist/Engineer-SC from September 2009. His main research interests are the design and optimization of compact feed systems at S-Band, horn antennas, ortho-mode transducers, and reflector antennas.

Jaswant Sharma completed his Bachelor of Engineering in 2007 from the University of Rajasthan. He is currently working at Space Applications Centre (SAC), Indian Space Research Organisation (ISRO), Ahmedabad, India, as a Deputy Head of Antenna CATF and Near Field Division (ACND) from 03 Jan 2024, and a Scientist/Engineer-SF with responsibility for antenna measurement at the Compact antenna test range and near field test range. He joined SAC, ISRO as a Scientist/Engineer-SC from February 2008. He is a Fellow of Institution of Electronics and Telecommunication Engineers (IETE), India, from December 2020. He has worked at Deso International India Pvt Limited from Jun 2007 to November 2007. His main research interests are the design and optimization of compact antenna test ranges, drone-based measurement.

Sagi Sravan Kumar was born in Guntur (Dist.), Andhra Pradesh, India, on March 16, 1976. He received the B.E. in Electronics and Communication Engineering from Andhra University (1997), M.E. in Microwave & Radar from University of Roorkee, India (1999). He joined as Scientist/Engr-SC in Space Applications Centre, Indian Space Research Organisation, Ahmedabad, India (1999). Currently, he is working as Group Director and Scientist/Engineer–G in Satcom and Navigation Antenna Group, SAC, ISRO, Ahmedabad. He is working in the field of communication, Navigation satellite antennas, and ground terminal antennas. His research interests include wide-band antennas, multifrequency printed antennas, microstrip reflect array antennas, high-power helical array antennas, shared aperture antennas, frequency selective surfaces, and array synthesis techniques. He is the author of more than 50 papers in international journals and conferences.

Milind B. Mahajan received the B.E. degree in Electronics from Marathwada University in 1991, the Master of Technology in microwave engineering from IIT-BHU in 1993, and the Ph.D. degree from Dharmsinh Desai University, Nadiad, in 2015. In 1993, he started his career with the Spacecraft Payload Group, Space Applications Centre, Ahmedabad. He was a Guest Scientist with the German Aerospace Centre (DLR) in 2001. He is currently the Outstanding Scientist and Deputy Director of the Antenna Systems Area at Space Application Centre, ISRO, Ahmedabad, India. He has more than 100 publications in national/international journals and conferences, and three patents to his credit. His current research interests include contoured beam reflectors and digital beamforming antennas. He has led the team to develop the antenna systems for navigation, radar imaging, communication satellites, and interplanetary missions. He was a recipient of the Space Gold Medal of the Astronautical Society of India in 2005 and the ISRO’s Team Excellence Awards in 2007, 2008, 2015, and 2017.