Highlights
Open-to-tidal lagoonal depositional settings of platform carbonates subjected to 4–5 km of tectonic burial.
Depositional and diagenetic heterogeneities confining high-angle fractures.
Varying multiscale spacing distributions in diffuse and localized fracture networks.
Fracture density and intensity do not vary in proportion to the bed thickness.
Greatest values of fracture density and intensity are calculated within coarse-grained carbonate beds.
1. Introduction
It is well known that platform carbonates deposited in lagoonal/peritidal environments often form well-layered successions (Tucker, Reference Tucker1985), and include low-porosity rocks (Lucia, Reference Lucia1983; Lucia & Fogg, Reference Lucia and Fogg1990; Flügel, Reference Flügel2004) bounded by primary interfaces at the scales of single beds, bed packages and bed package associations (Moore, Reference Moore2002; Spalluto, Reference Spalluto2008, Reference Spalluto2012; Giuffrida et al. 2020; La Bruna et al. Reference La Bruna, Lamarche, Agosta, Rustichelli, Giuffrida, Salardon and Marié2020). Within low-porosity carbonates, typical of Type I fractured reservoirs (Nelson, Reference Nelson2001), the total amount of effective porosity is often enhanced by fractures (Odling et al. Reference Odling, Gillespie, Bourgine, Castaing, Chilés, Christensen, Fillion, Genter, Olsen, Thrane, Trice, Aarseth, Walsh and Watterson1999; Korneva et al. Reference Korneva, Tondi, Agosta, Rustichelli, Spina, Bitonte and Di Cuia2014; Giuffrida et al. 2019). Fractures can occur at both micro- and mesoscale and might result confined within discrete rock intervals forming single mechanical units (Gross, Reference Gross1993; Gross et al. Reference Gross, Fischer, Engelder and Greenfield1995; Panza et al., Reference Panza, Agosta, Rustichelli, Zambrano, Tondi, Prosser, Giorgioni and Janiseck2016, 2019; Smeraglia et al. Reference Smeraglia, Giuffrida, Grimaldi, Pullen, La Bruna, Billi and Agosta2021 a). Bed-parallel pressure solution seams often localize within the primary interfaces (Rustichelli et al. 2012, 2015) and act as mechanical boundaries inhibiting the vertical fracture propagation (Nur & Israel, Reference Nur and Israel1980; Gross et al. Reference Gross, Fischer, Engelder and Greenfield1995, 1997; Wu & Pollard, Reference Wu and Pollard1995; Becker & Gross, Reference Becker and Gross1996). The interaction between primary interfaces and fracture geometry and distribution is assessed by fracture stratigraphy analysis as first proposed by Berry et al. (Reference Berry, Stearns and Friedman1996) and subsequently refined by Laubach et al. (Reference Laubach, Olson and Cross2009). Accordingly, layered rock successions are subdivided into discrete intervals according to fracture characteristics (i.e. height, spacing, density, intensity) and/or specific failure modes (Pollard & Aydin, Reference Pollard and Aydin1990; Dershowitz & Herda, Reference Dershowitz and Herda1992; Bai & Pollard, Reference Bai and Pollard2000; Antonellini et al. Reference Antonellini, Tondi, Agosta, Aydin and Cello2008; Agosta et al. Reference Agosta, Alessandroni, Tondi and Aydin2009, Reference Agosta, Wilson and Aydin2015).
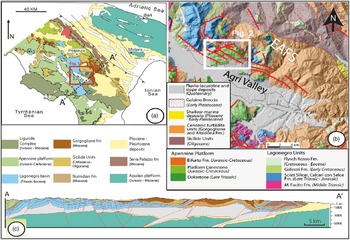
In this work, we analyse the fracture characteristics in layered Mesozoic carbonates pertaining to the Apennine Platform exposed along the axial zone of the southern Apennines fold-and-thrust belt, Italy (Patacca & Scandone, 2007; Schettino & Turco, Reference Schettino and Turco2011). The Mesozoic carbonates crop out at the Viggiano Mountain area (Fig. 1). Their polyphasic tectonic evolution caused the formation of multiple fracture sets forming diffuse and/or localized networks (Cello & Mazzoli, 1998; Maschio et al. Reference Maschio, Ferranti and Burrato2005). Focusing on carbonate rock volumes mainly cross-cut by diffuse fractures, which crop out away from the major fault zones, we apply a variety of methods aimed at unravelling their stratigraphic, petrographic, mineralogical and structural properties. The results of field stratigraphic logging and petrographic and mineralogical analyses are discussed to decipher the palaeodepositional environments, diagenetic evolution and overall primary architecture of the studied Mesozoic carbonates. Also, the results of quantitative field fracture analysis are considered to assess the fracture density and intensity variations throughout the sedimentary succession. We discuss these variations in terms of the geometrical and mechanical control respectively exerted by carbonate bed thickness and carbonate rock texture on the distribution of diffuse high-angle fracture sets. Possible applications of the acquired knowledge span from groundwater management and preservation (Andreo et al. Reference Andreo, Vías, Durán, Jiménez, López-Geta and Carrasco2008; Marín & Andreo, Reference Marín and Andreo2015; Petrella et al. 2015; Corniello et al. Reference Corniello, Ducci, Ruggieri and Iorio2018) to geothermal fluid circulation (Bellani et al. Reference Bellani, Brogi, Lazzarotto, Liotta and Ranalli2004; Smeraglia et al. Reference Smeraglia, Mercuri, Tavani, Pignalosa, Kettermann, Billi and Carminati2021 b) and hydrocarbon production (Mosca & Wavrek, Reference Mosca and Wavrek2002; Shiner et al. Reference Shiner, Beccacini and Mazzoli2004).
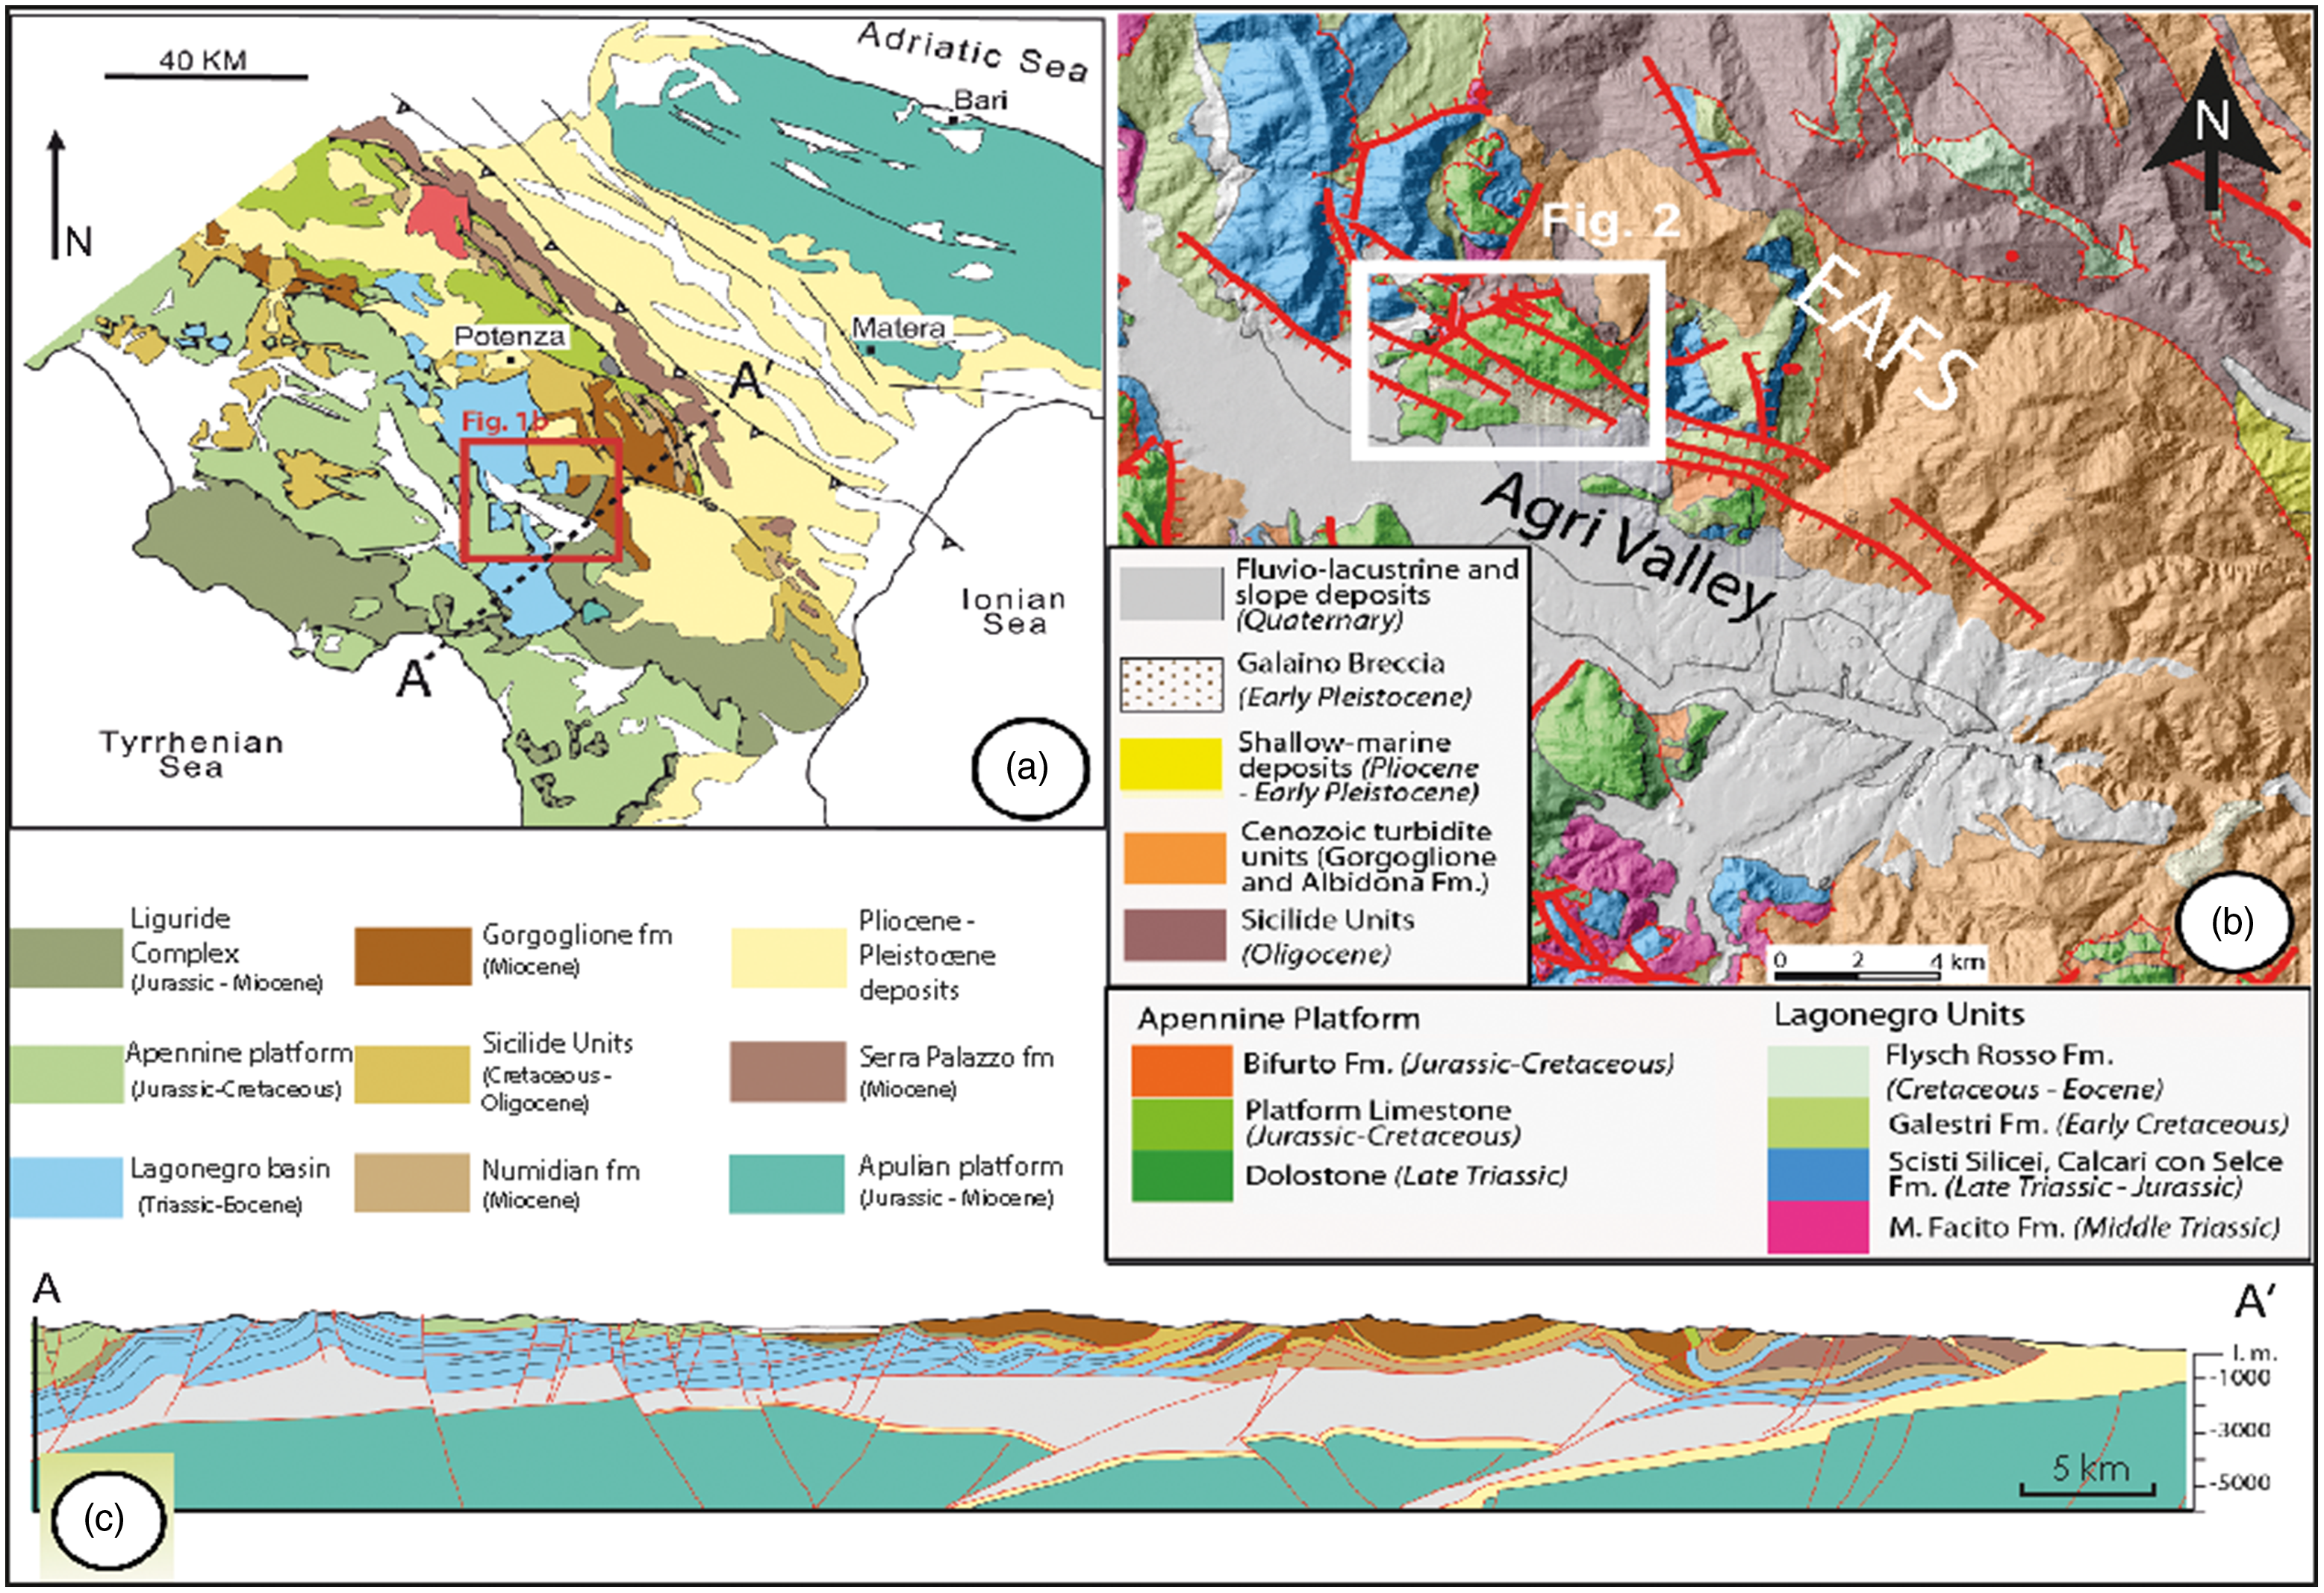
(a) Simplified structural map of the southern Apennines fold-and-thrust belt, Italy (modified after Piedilato & Prosser, Reference Piedilato and Prosser2005). (b) Geological map of the High Agri Valley, southern Italy. The white square represents the location of the Viggiano Mountain study area. (c) Geological cross-section of the southern Apennines along the A–A′ transect (modified after Prosser et al. Reference Prosser, Palladino, Avagliano, Coraggio, Bolla, Riva and Catellani2021).
2. Geological setting
The southern Apennines of Italy extends from the southern Abruzzo – alto Molise area (Ortona – Rocca Monfina tectonic lineament; Patacca et al. Reference Patacca, Sartori and Scandone1990) to the Calabrian–Lucanian border (Sangineto tectonic lineament; Amodio-Morelli et al. Reference Amodio-Morelli, Bonardi, Colonna, Dietrich, GiunTa, Ippolito, Liguori, Lorenzoni, Paglionico, Perrone, Piccarreta, Russo, Scandone, Zanettin-Lorenzoni and Zuppetta1976). The southern Apennines are bounded westward by the Tyrrhenian back-arc extensional region (Malinverno & Ryan, Reference Malinverno and Ryan1986; Kastens & Mascle Reference Kastens and Mascle1990; Patacca et al. 1992a, Reference Patacca, Scandone, Bellatalla, Perilli, Santini, Tozzi, Cavinato and Parotto1992 b), and eastward by the Bradanic Trough including Plio-Pleistocene foredeep basinal sedimentary successions (Patacca et al. Reference Patacca, Sartori and Scandone1990; Patacca & Scandone, 2007). The structural setting of the southern Apennines consists of E-to-NE-vergent thrust sheets forming a multi-duplex emplaced since the late Oligocene – early Miocene due to combined thin- and thick-skinned tectonics (Mostardini & Merlini, Reference Mostardini and Merlini1986; Casero et al. Reference Casero, Roure, Endignoux, Moretti, Müller, Sage and Vially1988, Reference Casero, Roure, Vially and Spencer1991; Monaco et al. Reference Monaco, Tortorici and Paltrinieri1998; Improta et al. Reference Improta, Iannaccone, Capuano, Zollo and Scandone2000; Noguera & Rea, Reference Noguera and Rea2000; Shiner et al. Reference Shiner, Beccacini and Mazzoli2004). Since the Pliocene, this multi-duplex has been dissected by transtensional and extensional faults (Mostardini & Merlini, Reference Mostardini and Merlini1986; Hippolyte et al. Reference Hippolyte, Angelier and Barrier1995; Giano et al. Reference Giano, Maschio, Alessio, Ferranti, Improta and Schiattarella2000; Cello et al. Reference Cello, Tondi, Micarelli and Mattioni2003; Novellino et al. Reference Novellino, Prosser, Spiess, Viti, Agosta, Tavarnelli and Bucci2015) associated with the Tyrrhenian Basin opening and/or with the gravitational collapse of the orogen (Doglioni et al. 1996; Cello & Mazzoli, 1998; Scrocca et al. Reference Scrocca, Carminati and Doglioni2005).
At a regional scale, the Apennine carbonate platform now forms a main thrust sheet encompassed between upper Ligurian/Sicilian and lower Lagonegro tectonic units (Vezzani et al. Reference Vezzani, Festa and Ghisetti2010, and references therein). During the Mesozoic, this carbonate platform developed along the western portion of the Jurassic Ligurian Tethys Ocean (Patacca & Scandone, 2007; Schettino & Turco, Reference Schettino and Turco2011) and included the following three main stratigraphic units (Patacca & Scandone, 2007):
-
(1) Capri–Bulgheria, representing the westernmost portion of the ancient carbonate platform: It included Triassic–Jurassic, shallow-water, internal transitional carbonate facies and Cretaceous–Miocene marls interbedded with resedimented carbonates.
-
(2) Alburno–Cervati, the ancient platform-interior portion. It contained open Triassic dolomites and dolomitic limestones, Jurassic–Cretaceous shallow-water limestones and Miocene slope carbonates and terrigenous deposits.
-
(3) Maddalena Mountain, the easternmost portion of the ancient platform. It was made up of transitional facies deposited between the Alburno–Cervati Unit to the west and the Lagonegro Basin to the east.
2.a. Viggiano Mountain area
The Viggiano Mountain is located along the NE margin of the High Agri Valley, which is an intra-mountain tectonic basin filled with Quaternary fluvio-lacustrine deposits (Di Niro et al. Reference Di Niro, Giano and Santangelo1992). The WNW–ESE elongated High Agri Valley basin is bounded by high-angle transtensional faults forming the East Agri Valley fault system (EAFS; Fig. 1b) and the Monti della Maddalena fault system (Cello & Mazzoli, 1998; Cello et al. 2000, Reference Cello, Tondi, Micarelli and Mattioni2003; Maschio et al. Reference Maschio, Ferranti and Burrato2005; Prosser et al. Reference Prosser, Palladino, Avagliano, Coraggio, Bolla, Riva and Catellani2021). The studied Mesozoic carbonates of the Viggiano Mountain are cross-cut by faults pertaining to EAFS. According to Cello & Mazzoli (1998) and Cello et al. (2000), the EAFS includes N120E (left-lateral slip), N30E (right-lateral transtensional slip), N90–110E (left-lateral transtensional slip) and N130–150E (left-lateral transpressional slip) high-angle fault sets. Differently, Maschio et al. (Reference Maschio, Ferranti and Burrato2005) documented left-lateral transtensional slip along WNW–ESE-striking, left-stepping master faults, and localized dilation within the releasing jogs of interacting WNW–ESE faults due to NE–SW-striking normal faults. High-angle faulting involved slope deposits and palaeosoils 39 and 18 ka old, respectively (Giano et al. Reference Giano, Maschio, Alessio, Ferranti, Improta and Schiattarella2000), and caused historical seismicity in the whole Agri Valley area (Mallet, Reference Mallet1862; Cello et al. Reference Cello, Tondi, Micarelli and Mattioni2003, Buttinelli et al. Reference Buttinelli, Improta, Bagh and Chiarabba2016; Hager et al. Reference Hager, Dieterich, Frohlich, Juanes, Mantica, Shaw, Bottazzi, Caresani, Castineira, Cominelli, Meda, Osculati, Petroselli and Plesch2021).
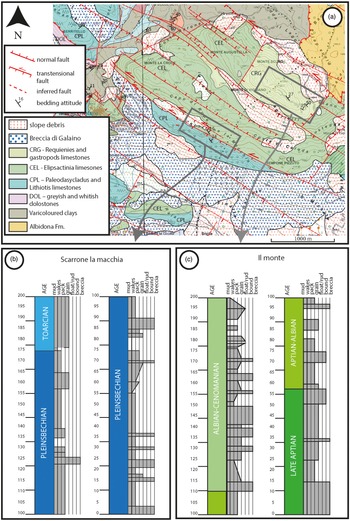
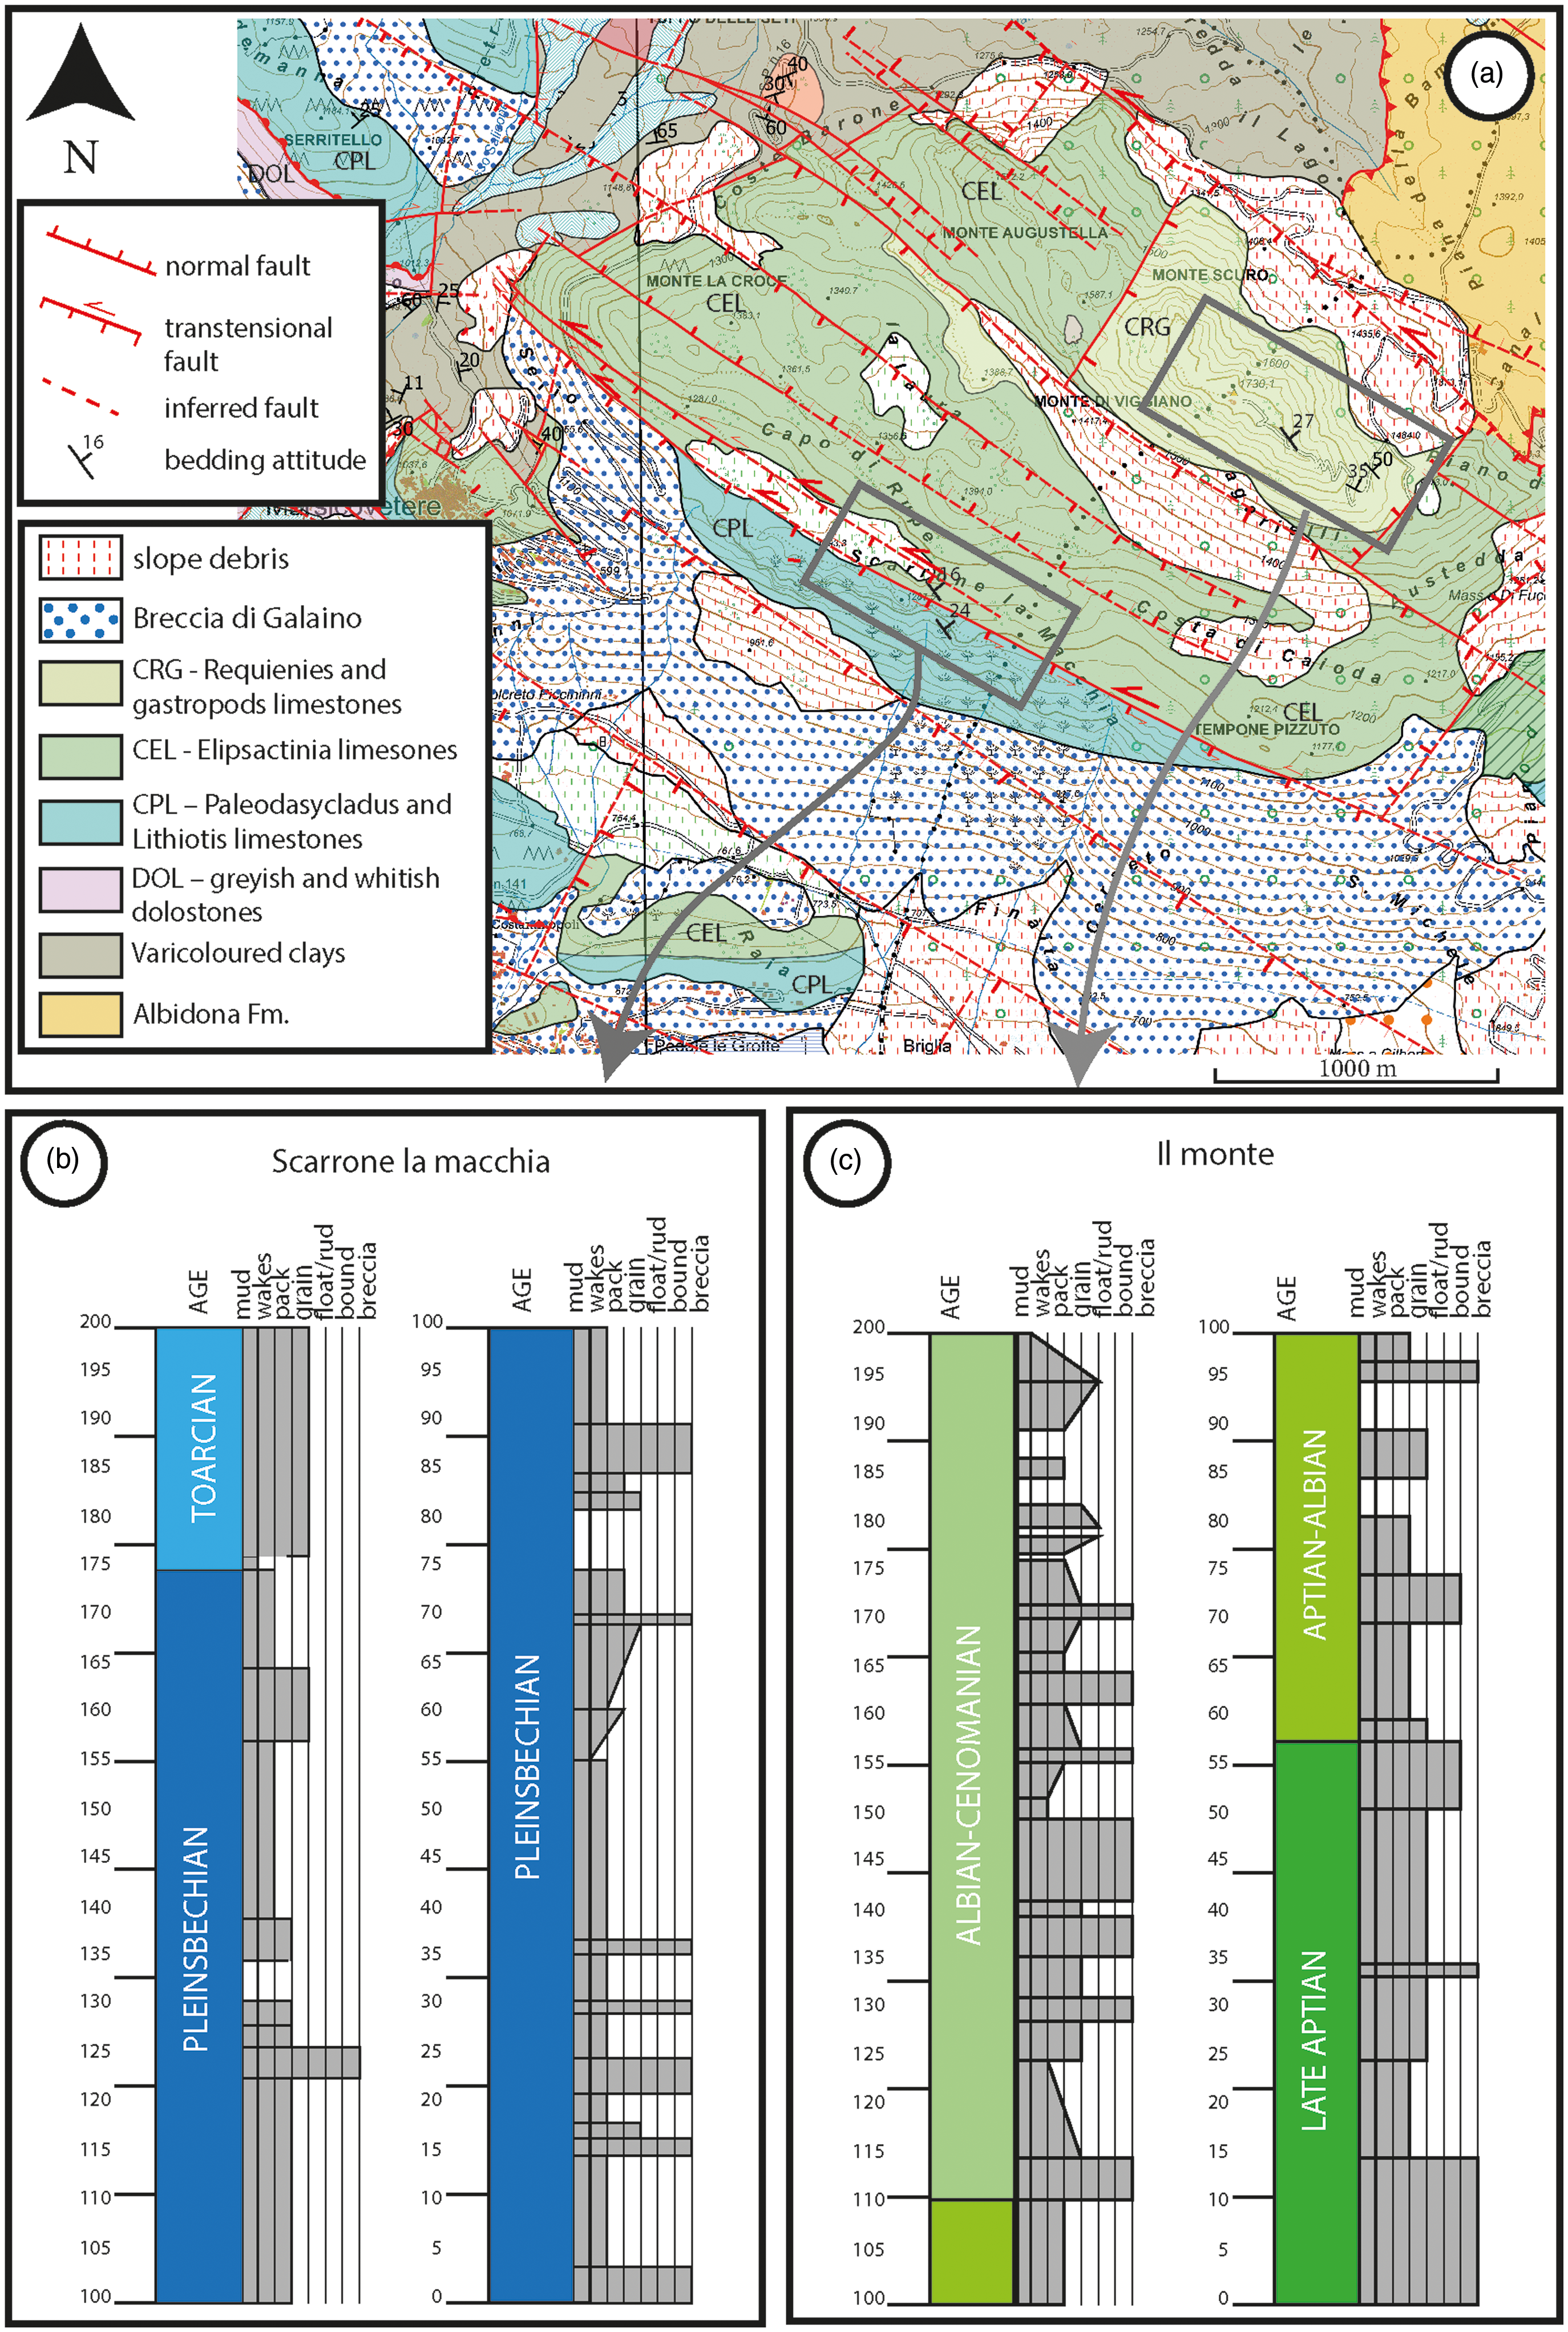
According to the latest geological map available for the study area (G Palladino et al. in prep.), the Viggiano Mountain carbonates are bounded northward and southward by WNW–ESE-striking, high-angle transtensional faults, and westward and eastward by NE–SW-striking, high-angle extensional faults (Fig. 2a). The high-angle faults dissect the buried, NE–verging, low-angle thrust juxtaposing the Viggiano carbonates against the Lagonegro II Unit (Patacca & Scandone, 2007; Bruno et al., Reference Bruno, Caliri, Carbone, Chiocchini, Di Stefano, Giano, Guarnieri, Lentini, Martorano and Piccarreta2014), and the associated anticline forelimb. The bottom portion of the Viggiano carbonates includes Triassic dolostones, lower Jurassic wackestones and packstones, with thick-shelled bivalve (Lithiotis), green algae (Palaeodasycladus mediterraneus) and foraminifera (Siphoalvulina sp, Pseudocyclammina liassica) marking the Pleinsbachian age (Lechler et al. Reference Lechler, Frijia, Mutti, Palladino and Prosser2012). These carbonates formed in a subtropical, inner platform depositional environment, and were topped by thick, massive oolites postdating the Early Toarcian Anoxic event (Wignall & Bond, Reference Wignall and Bond2008; Trecalli et al., Reference Trecalli, Spangenberg, Adatte, Föllmi and Parente2012; Caruthers et al., Reference Caruthers, Smith and Gröcke2013). The upper portion of the Viggiano carbonates consists of Albian–Cenomanian rudstones and grainstones with gastropods, bivalves, rudists (Radiolitidae) and foraminifera (Lechler et al. Reference Lechler, Frijia, Mutti, Palladino and Prosser2012). The topmost carbonate beds are made up of mudstones-to-rudstones and boundstones (Lithocodium) with geopetal structures and rudists (Conicorbitolina conica, Salpingoporella turgida and Caprinidae).
(a) Geological map of the Viggiano Mountain area, located along the northern edge of the High Agri Valley (G Palladino et al. in prep.). Location of both Scarrone la macchia and Il monte study sites is reported. (b, c) Schematic stratigraphic logs of (b) Scarrone la macchia and (v) Il monte areas (modified after Lechler et al. Reference Lechler, Frijia, Mutti, Palladino and Prosser2012).
3. Methods
The present study focuses on two main sites labelled as ‘Scarrone la macchia’ (40° 22.484′ N, 15° 50.383′ E) and ‘Il monte’ (40° 22.678′ N, 15° 51.693′ E), which are respectively located along the southern cliff (Fig. 2b) and upper portion of the Viggiano Mountain (Fig. 2c).
3.a. Stratigraphic analysis and rock sampling
Field stratigraphic logging was performed aiming at assessing both bed thickness and carbonate lithofacies (Dunham, Reference Dunham1962). The bed thickness was measured orthogonal to laterally continuous bed interfaces. The carbonate lithofacies were characterized by means of a portable magnifying lens. A total of 70 samples were collected at the Scarrone la macchia site, and 51 samples at the Il monte site. Regarding the former, ten samples derive from outcrops exposing the bottommost portion of the oolithic carbonates and the associated primary interfaces.
3.b. Petrographic analysis
The analysis was carried out using an optical microscope (Leitz Laborlux 12 Pol) associated with the Zen software for photomicrograph acquisitions. Microfacies textural classifications are after Dunham (Reference Dunham1962) and Embry & Klovan (Reference Embry and Klovan1971). A total of 19 thin-sections obtained from samples collected at the Scarrone la macchia and 14 at the Il monte sites were analysed. Biostratigraphic analysis of the Lower Jurassic carbonates was based on biozonal schemes and chronostratigraphic references related to the Tethyan inner-carbonate platforms (De Castro, Reference De Castro, Barattolo, De Castro and Parente1991; Chiocchini et al., Reference Chiocchini, Farinacci, Mancinelli, Molinari, Potetti and Mancinelli1994; Barattolo & Romano, Reference Barattolo and Romano2005; BouDagher-Fadel, Reference BouDagher-Fadel2008). Biostratigraphic analysis of the Cretaceous carbonates is after the distribution ranges already described for the Tethyan realm (Chiocchini et al., Reference Chiocchini, Farinacci, Mancinelli, Molinari, Potetti and Mancinelli1994; Di Stefano & Ruberti, Reference Di Stefano and Ruberti2000).
3.c. Mineralogical analysis
Twenty powders obtained from the hand samples collected at the bottommost portion of the oolithic carbonates exposed at the Scarrone la macchia site were investigated. X-ray powder diffraction (XRPD) analysis was carried out by means of the Rigaku D/Max 2200 diffractometer with &obar;–&obar; Bragg–Bentrano geometry, equipped with CuKα radiation, automatic sample holder spinner, secondary graphite monochromator and scintillation detector. The following instrumental conditions were adopted: (i) power 40 mA × 30 kV, (ii) step scan 0.02 °2&obar;, (iii) speed 3s/step, (iv) divergent slit 1° and receiver slit 0.3 mm. Random powders and oriented specimens were respectively analysed in the angular range of 2–70 °2&obar; and 2–32 °2&obar;. Mineralogical analyses were performed on bulk samples, on their terrigenous components and on the <2 μm terrigenous fraction (Table 1).
Sample code, lithology, components and fractions determined by XRPD on samples collected from the Scarrone la Macchia stratigraphic section
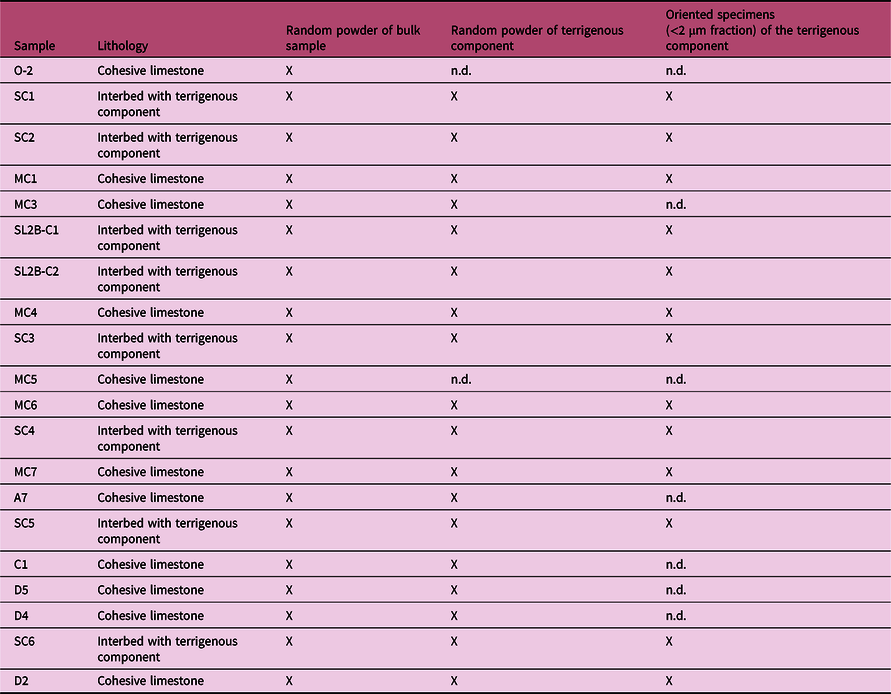
Note: n.d., not detected because it is present in very small quantities.
Hand samples were first crushed, then one aliquot was pulverized by friction in a concentric-disc agate mill, whereas another aliquot was treated with diluted HCl to first remove the carbonates (Cuadros & Altaner, Reference Cuadros and Altaner1998). The remaining silicate component was washed several times with distilled water and then collected by centrifugation. About 0.5 g of the collected silicates was manually milled using mortar and pestle, and then used for random specimen analyses by means of side loading. Also, c. 1.5 g of the collected silicates were used for clay fraction (<2 μm) separation according to Stock’s law. The clay fraction was then saturated with 1N MgCl2 solution and finally used for orientated specimen analysis by settling it on a glass slide (Moore & Reynolds, Reference Moore and Reynolds1997). The oriented specimens were air-dried, ethylene glycol solvated and then heated at 375 °C (Moore & Reynolds, 1997).
3.d. Structural analysis
Field structural analyses were carried out by means of circular and linear scanline methods (Priest & Hudson, Reference Priest and Hudson1981; Mauldon et al. Reference Mauldon, Dunne and Rohrbaugh2001). The former consisted of circles drawn on the rock surface delimiting a circular window (symmetric sampling area), in which the number of fracture intersections, n, and the number of fracture endpoints inside the sampling area, m, were measured. All fracture traces longer than 3 cm were considered. Outcrops were chosen based on accessibility, dimensions (width > 10 m) and distance from main fault zones. The measured m and n values were respectively employed for 2D fracture density (P20) and intensity (P21) calculations (Mauldon et al. Reference Mauldon, Dunne and Rohrbaugh2001).
P20 represents the number of fracture trace centres per unit area (1/m2), and is obtained by applying the following equation:
 $${\rm P20} = m/2 \pi r$$
where r is the radius of the circular scanline.
P21 represents the mean total trace length of fractures per unit area (m/m2), and is obtained by applying the following equation:
 $${\rm P21} = n/4r$$
Eighty-five circular scanlines were conducted within single carbonate beds. According to the bed thicknesses, the diameter of the circular scanline varied between 15 and 50 cm. In order to obtain representative P20 and P21 estimations, circular scanlines included at least 30 endpoints (Rohrbaugh et al. Reference Rohrbaugh, Dunne and Mauldon2002).
Thirteen linear scanline analyses were performed by considering ideal lines drawn on the rock and measuring both the attitude and distance from origin of all surveyed fractures. As a result, true fracture spacing values (S r) were computed for single fracture sets. Computations were performed by applying trigonometric corrections to the apparent spacing values (S a) in light of the α and β values (α: azimuthal angle formed by fracture strike direction and scanline trend; β: zenithal angle formed by fracture dip angle and scanline plunge).
True fracture spacing is obtained by applying the following equation:
 $$S_r =S_a* (cos\ \alpha) * (cos\ \beta)$$
At both sites, ten of the aforementioned linear scanlines were positioned parallel to carbonate beds, away from mesoscale faults, to measure the 1D fracture intensity, P10, of the high-angle WNW–ESE (Scarrone la macchia) and WSW–ENE (Il monte) fracture sets. The three other linear scanlines, respectively labelled S1 to S3, were performed along orthogonal outcrops of the Scarrone la macchia site to assess the multiscale spacing distribution of the outcropping, high-angle fracture sets. Both S1 (N230E/40°) and S3 (N100E/31°) were positioned away from mesoscale faults, whereas the S2 (N180E/25°) was located across a c. N110E-striking, high-angle transtensional fault.
4. Results
In this chapter, we first present the stratigraphic, petrographic and mineralogical data. Then we document the geometry, density, intensity and multiscale spacing distribution of the surveyed fracture sets.
4.a. Carbonate stratigraphy
4.a.1. Scarrone la macchia site
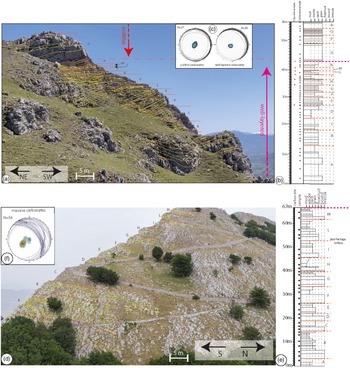
The c. 56 m thick succession includes two informal units (Fig. 3). The lower one is made up of well-layered carbonates with dark limestones and marly intercalations. The carbonates show a total thickness of c. 43 m (Fig. 3a) and dip NE (Fig. 3c). They are subdivided into 12 single bed packages, respectively labelled A to N bottom up, whose thickness varies from c. 13 m (bottom) to c. 1 m (top) (Fig. 3b). Single bed packages show fining-upwards carbonate textures, with thick beds of coarse-grained limestones at the bottom, and thin beds of fine-grained limestones at the top. The bed packages are bounded by laterally continuous, 5–10 cm thick, clay-rich carbonate interfaces including anastomosed pressure solution seams. Single carbonate beds are delimited by mm- to cm-thick bed interfaces, which might include pressure solution seams with siliciclastic films of insoluble material.
(a) Panoramic view of the Scarrone la macchia site. Bedding surfaces (yellow lines), bed package interfaces (orange lines) and sedimentary unit interfaces (magenta line) are reported. (b) Stratigraphic log of the Scarrone la macchia site. The aforementioned interfaces are also reported. (c) Lower-hemisphere, equal-area stereographic projection of bedding planes measured in well-layered carbonates and oolithic carbonates. (d) Panoramic view of the Il monte site. Bedding surfaces (yellow dashed lines), bed package interfaces (orange lines) and sedimentary unit interfaces (magenta line) are highlighted. (e) Stratigraphic section of Il monte site. The aforementioned interfaces are also reported. (f) Lower-hemisphere, equal-area stereographic projection of bedding planes measured in the massive carbonates.
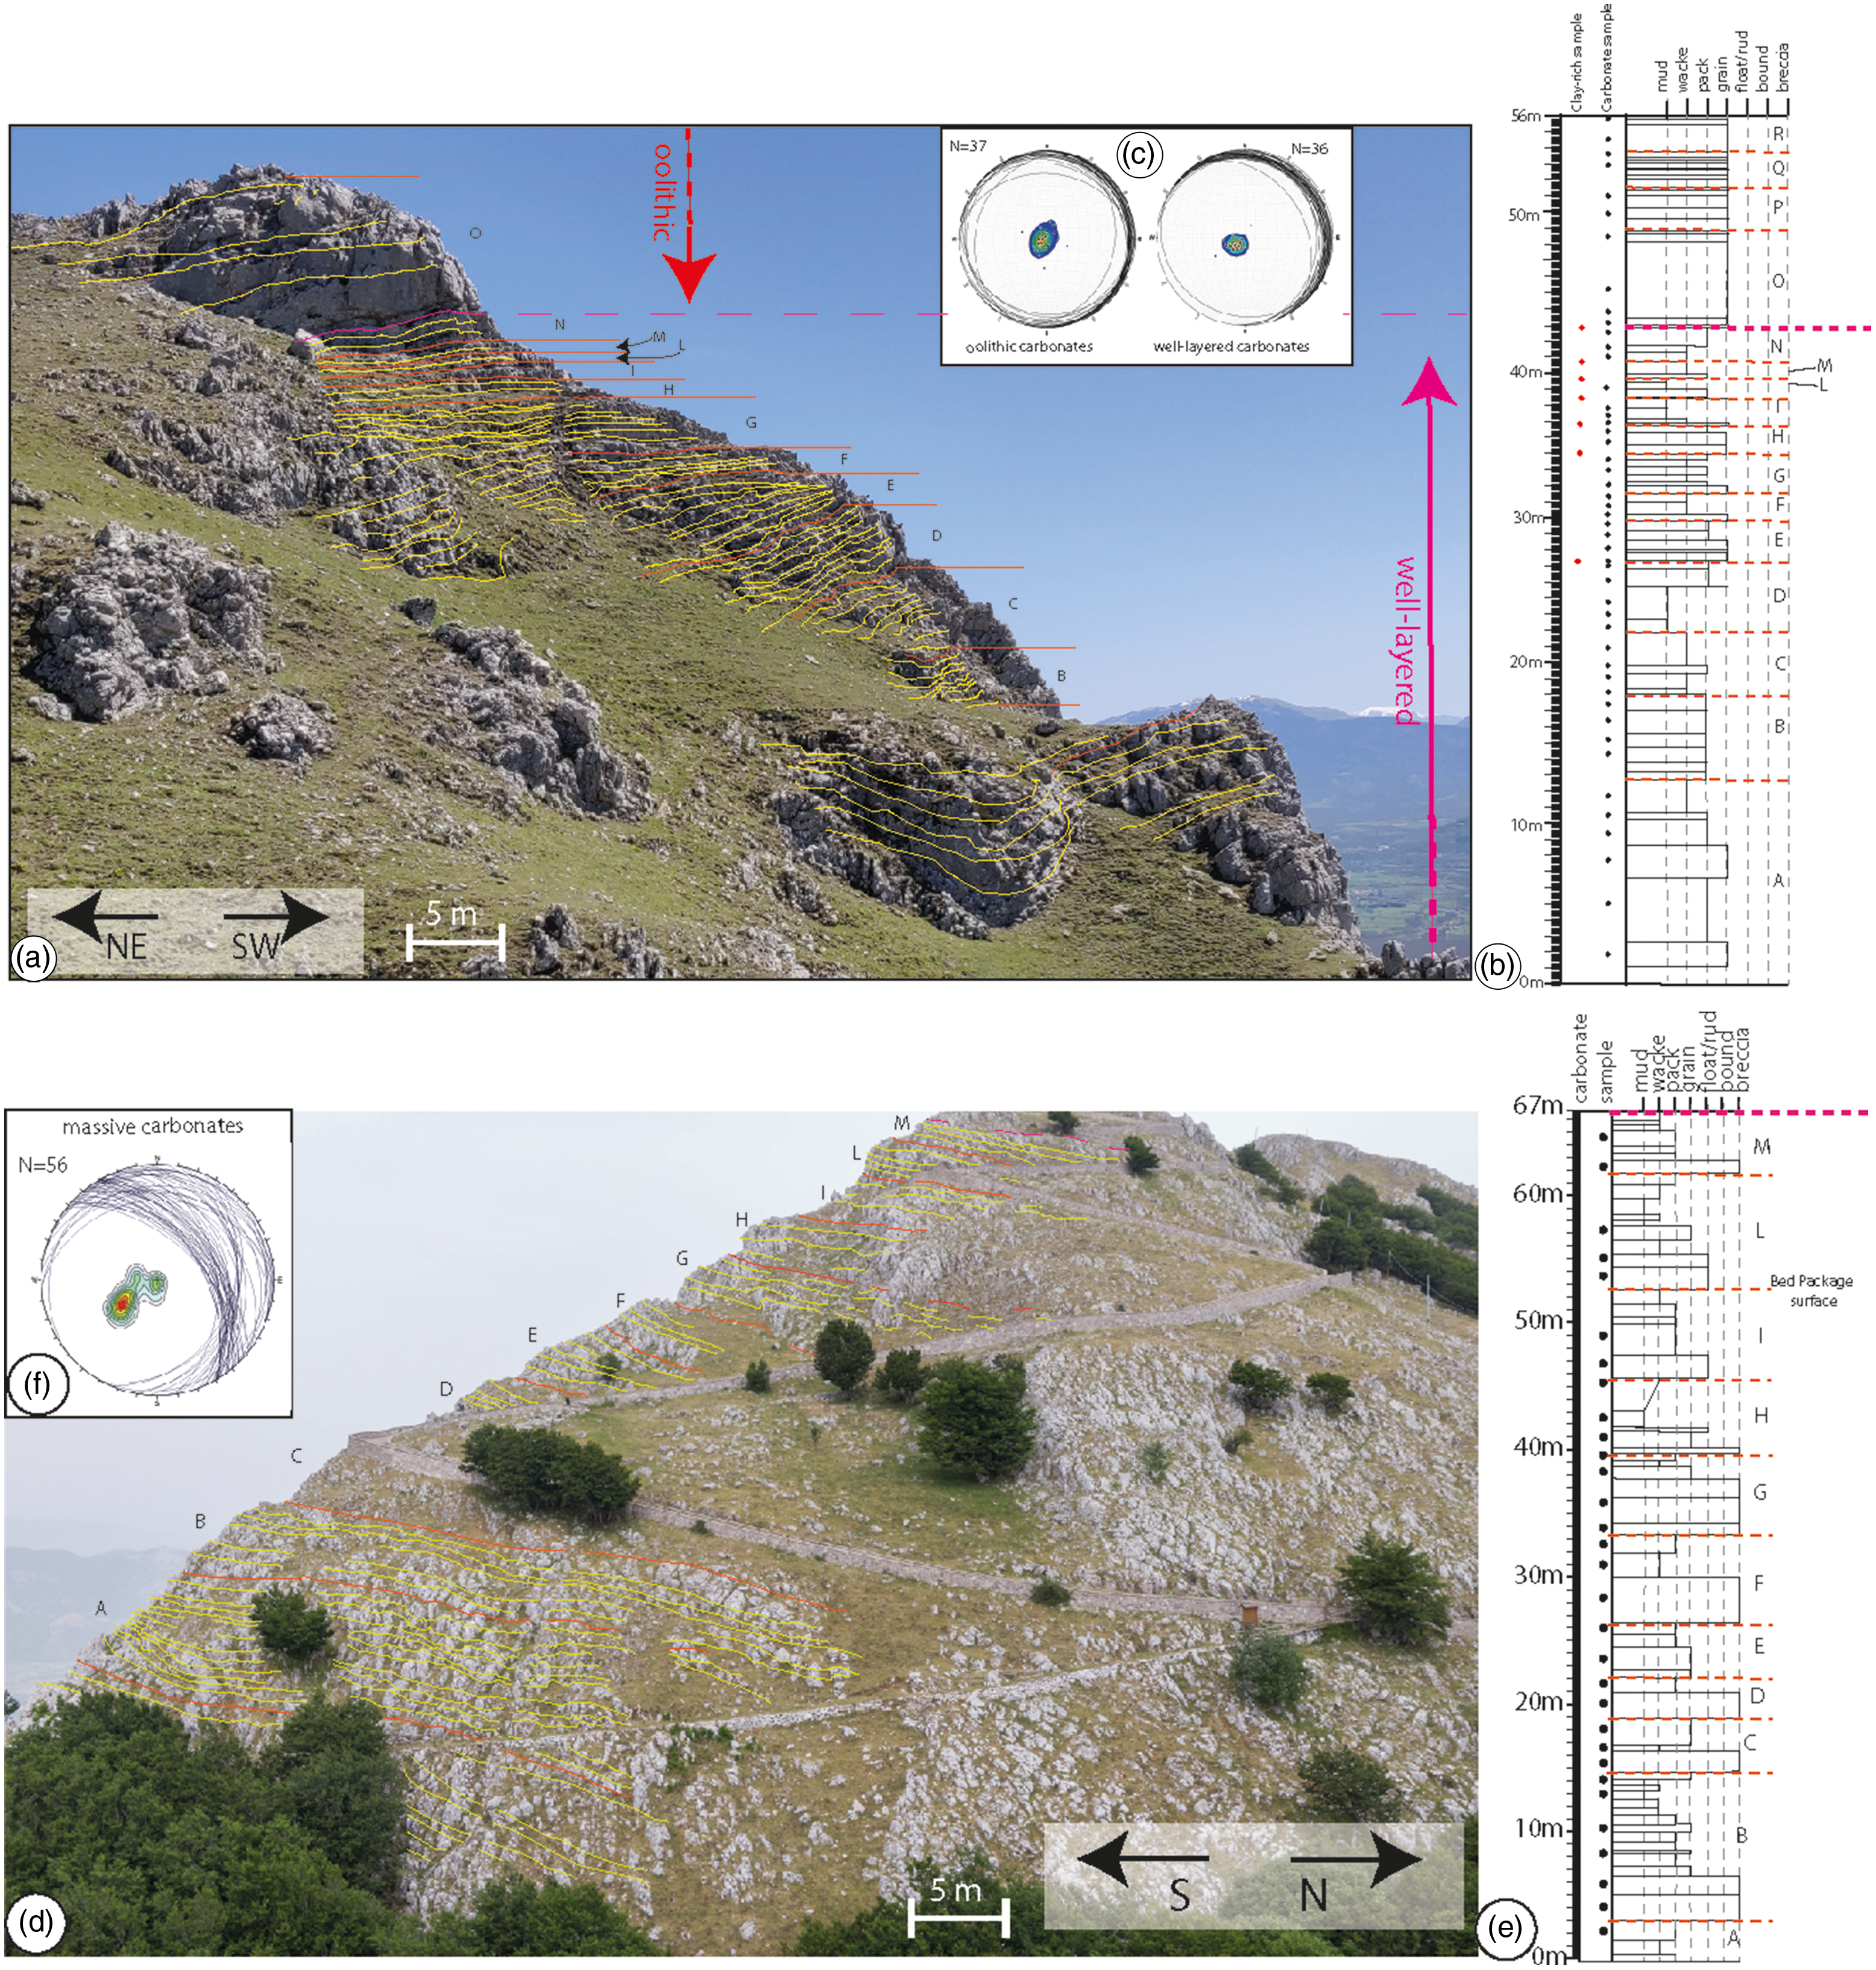
The well-layered carbonates are topped by an up to 15 cm thick, clay-rich carbonate layer including mm- to cm-sized elongated carbonate clasts embedded in a fine-grained matrix. The outcropping 13 m thick oolithic grainstones above mainly dip NE (Fig. 3c), forming a large-scale, open syncline. The outcropping oolithic unit at the Scarrone la macchia includes four main bed packages, respectively labelled O to R (Fig. 3a, b), delimited by laterally continuous, mm-thick, clay-rich carbonate interfaces. The single 5–40 cm thick carbonate grainstone beds show a pronounced amalgamation and significant lateral thickness variations. Bed interfaces are marked by localized pressure solution seams. At a close view, the single pressure solution seams do not show any visible insoluble clayish material.
4.a.2. Il monte site
The 67 m thick massive carbonates dip NE and include 11 bed packages labelled A to M bottom up (Fig. 3d, f). The bed packages are delimited by laterally continuous, erosive surfaces, and show fining-upward trends characterized by carbonate breccia and bioclastic rudstone/floatstone at the bottom, and carbonate grainstones and/or mudstone at the top (Fig. 3e). Single carbonate breccia and rudstone/floatstone beds include rudist fragments. Bed interfaces show a very pronounced amalgamation and the presence of pressure solution seams with tabular shapes.
4.b. Carbonate petrography
4.b.1. ‘Scarrone la macchia’ site
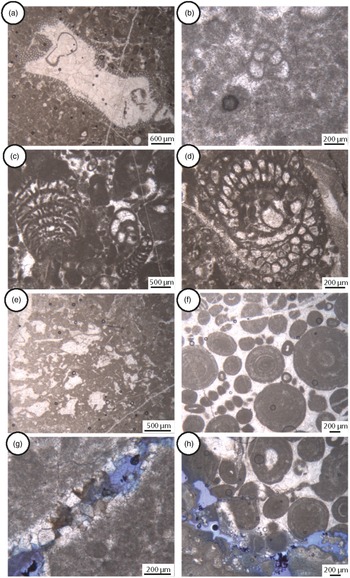
The well-layered carbonates include abundant benthic foraminifera and calcareous algae (including Haurania sp., Siphovalvulina sp., Lituosepta sp., Palaeodasycladus mediterraneus and Thaumatoporella parvovesiculifera (Fig. 4a–e)). Microfractures are partially occluded by blocky cement (Fig. 4g).
Microfacies of the Scarrone la macchia: (a–e) well-layered carbonates, (f–h) oolithic carbonates. (a) Packstone with Thaumatoporella parvovesiculifera. (b) Grainstone–packstone with Siphovalvulina sp. (c) Grainstone–packstone with benthic foraminifera (Siphovalvulina sp., Haurania deserta, Lituosepta sp.). (d) Palaeodasycladus mediterraneus. (e) Bacinella–Lithocodium agregatum. (f) Oolithic grainstone. (g) Open fractures partially occluded by dolomitic cements. (h) Intergranular porosity.
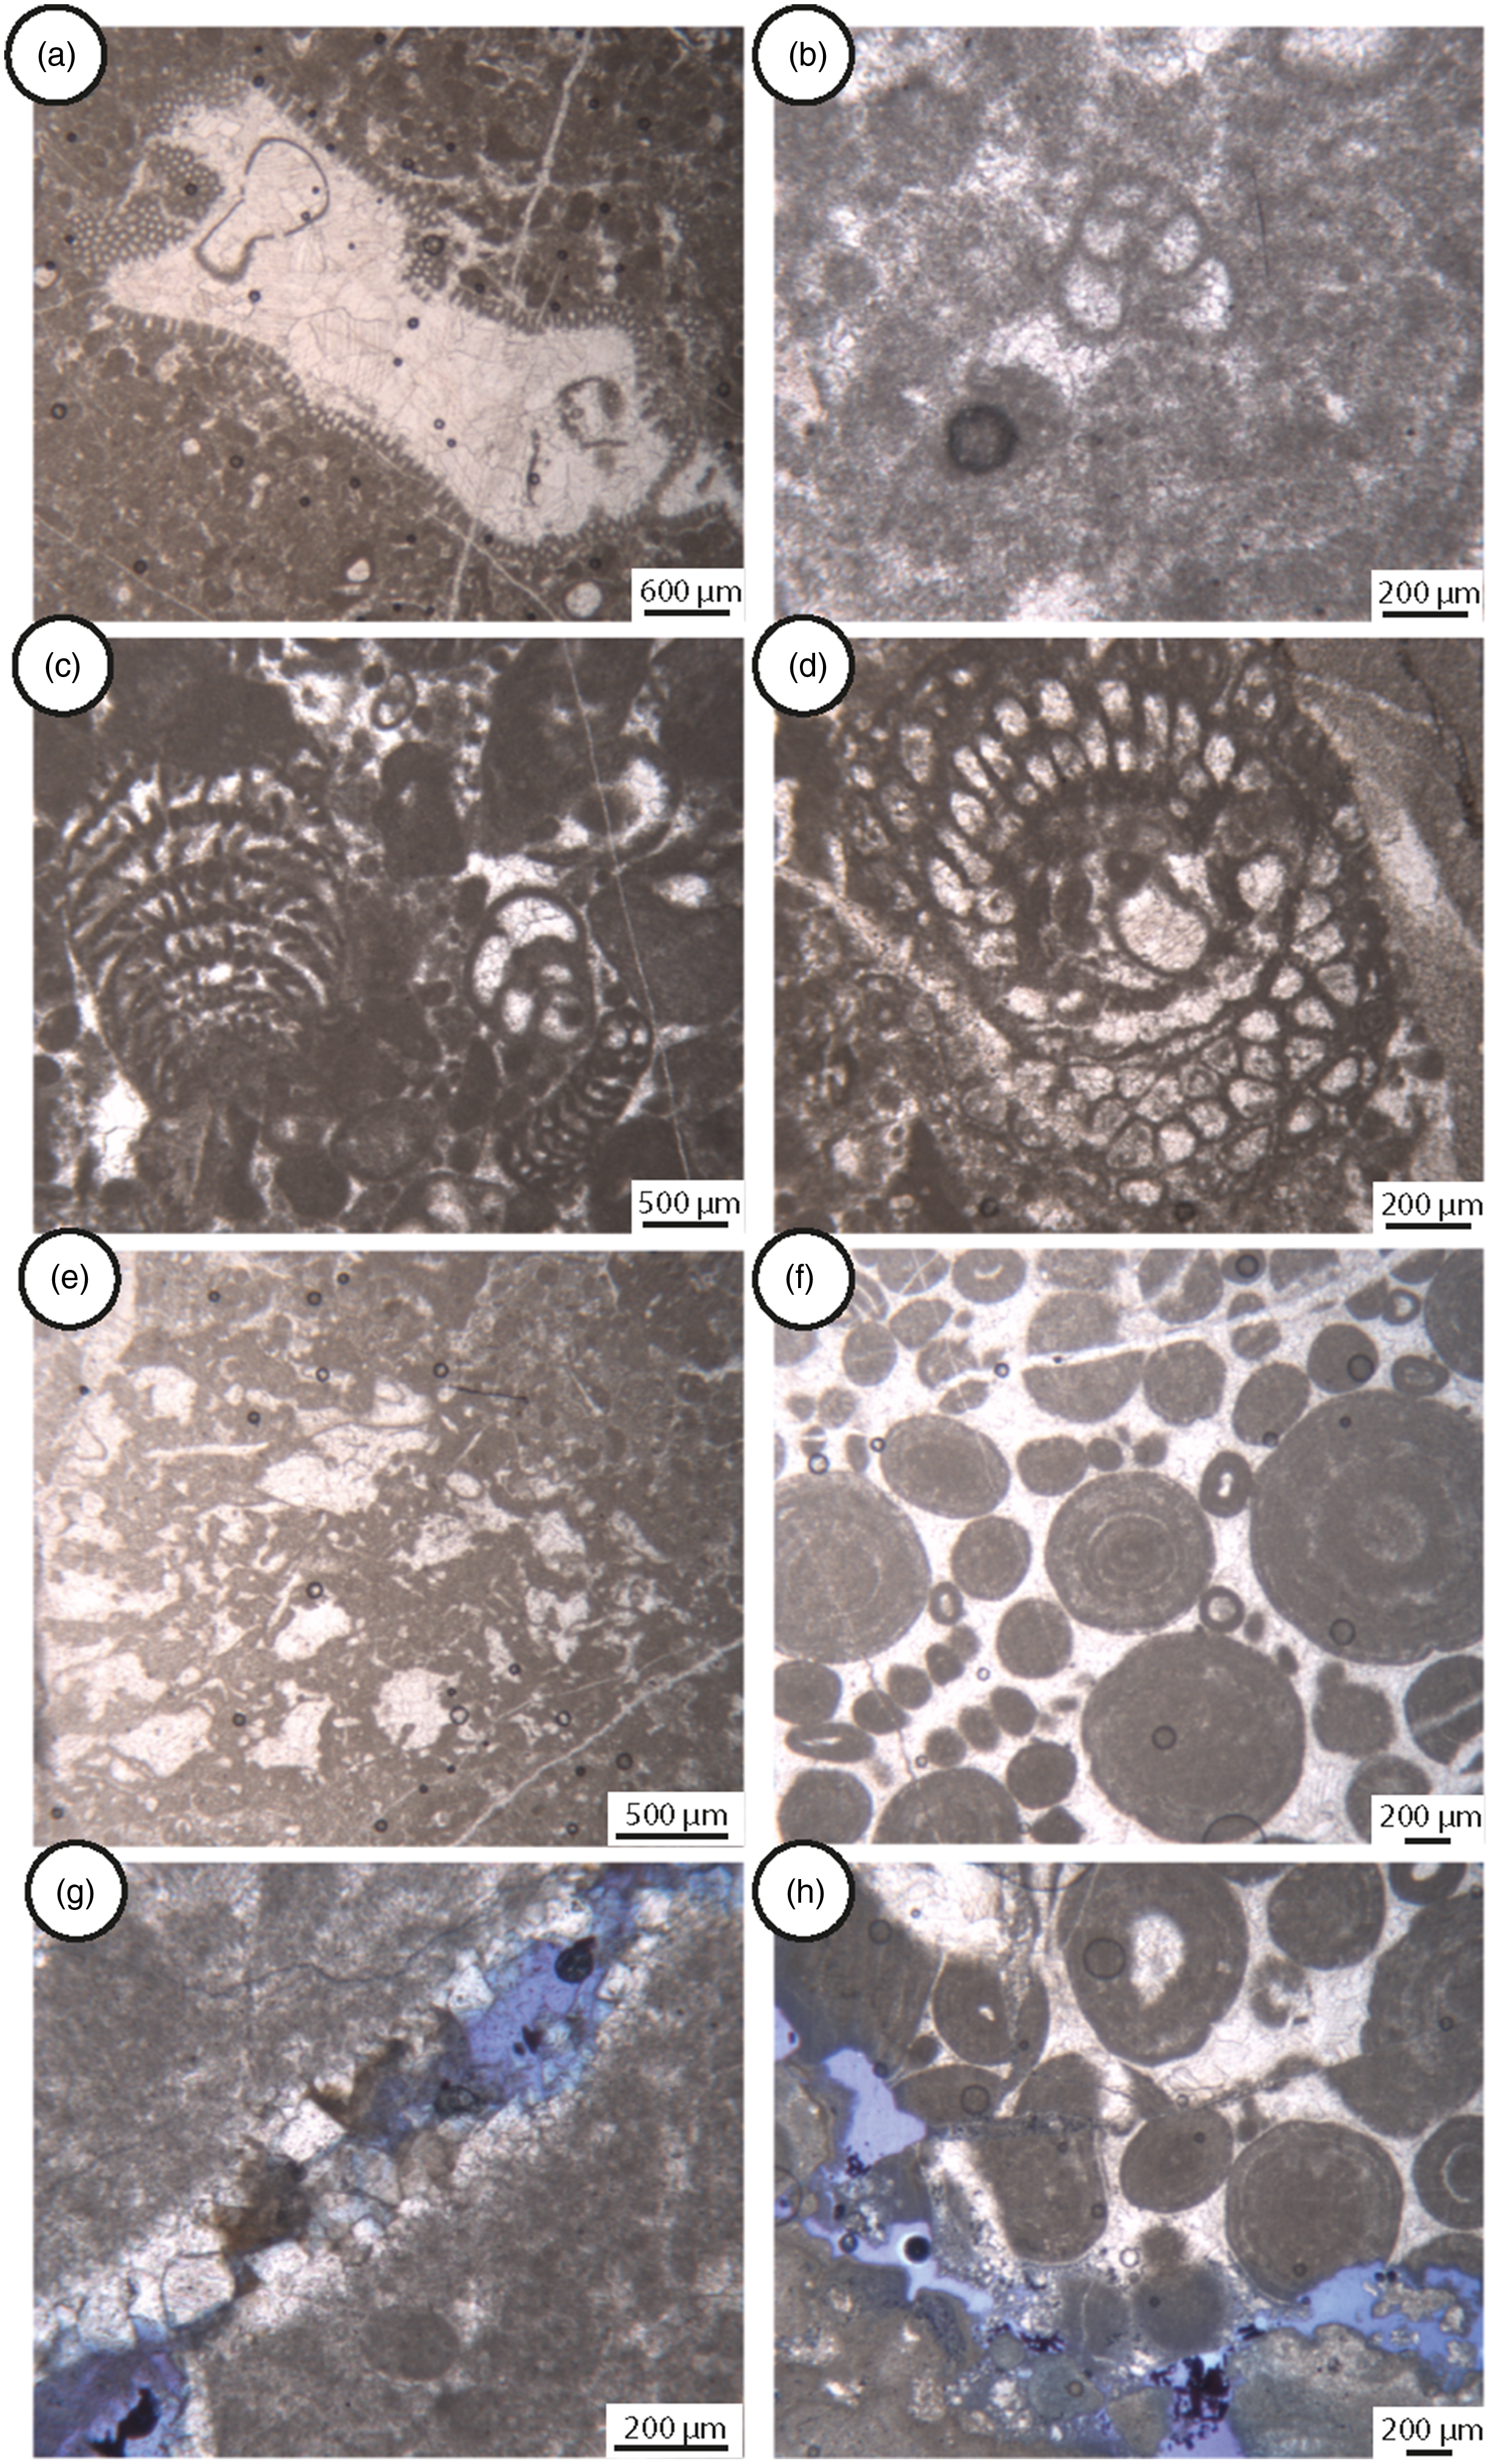
The oolithic limestones are made up of ooids with obliteration of the laminae due to intense micritization (Fig. 4f). However, in some cases, the original fabric consisting of concentric laminae is preserved. Ooids are 500–1000 µm in size, cemented with blocky calcite, and consist of alternations of laminae (<1 cm thick) including micrite oncoids (>1 mm). Their nuclei are made up of skeletal grains, peloids and rare mineral grains. Suture-like contacts among grains are absent, while microfractures are visible (Fig. 4h).
4.b.2. Il monte site
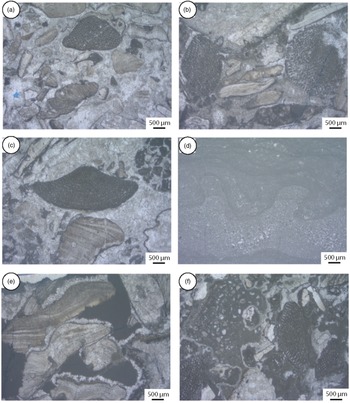
The massive carbonates include rudist fragments, gastropods, algae and benthic foraminifers (Orbitolinids) (Fig. 5a, b, c, e). Single rudist fragments, up to c. 5 cm in size, are micritized and affected by both microboring (cf. Fig. 5b) and pervasive dissolution (Fig. 5e–f). Rare stromatolitic laminae associated with oncoids and ostracods are also documented (Fig. 5d). Both granular and meniscus cements and isopachous crusts are present (Fig. 5e, f). Intergranular pores are filled with carbonate cements, barren silts and ostracod-rich sediments (Fig. 5e, f).
Microfacies of the Il monte section. (a–c) Grainstone to rudstone with fragments of rudists shell, orbitolinids. (d) Stromatolitic laminae with peloids. (e) Meniscus cements connecting the grains and isopacous cements rims around the rudists fragments. Barren silt filled the residual cavities. (f) Meniscus cements connecting the grains. The residual cavity is filled by a silt rich in ostracods.

4.c. Mineralogical analysis
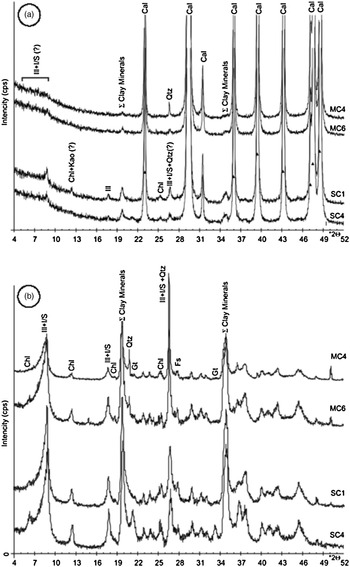
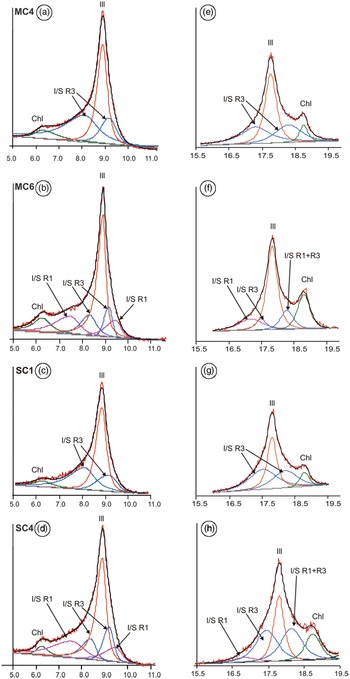
The results of the XRPD qualitative analyses are reported in Table 2 and Figures 6 and 7. Random powder analysis of the bulk rocks shows that all samples mainly include calcite (Fig. 6a). The silicates include quartz, feldspars (plagioclase), goethite and clay minerals such as illite, mixed-layer illite/smectite (I/S), chlorite and kaolinite (Fig. 6b). Mixed layers show ordered R1 with 80 % of illite, and R3 with 90 % of illite (Fig. 7; Table 2).
Mineralogical assemblages of the study samples

Note: Cal, calcite; Chl, chlorite; Qtz, quartz; Fs, feldspars; Gth, goethite; I/S, mixed layers illite–smectite; Ill, illite; Kao, kaolinite. n.d., not detected; X indicates the presence of mineral phase.
Representative XRD patterns of selected samples. (a) Bulk samples and (b) terrigenous components. Cal = calcite; Qtz = quartz; Fs = feldspars; Gt = goethite; Ill = illite; I/S = mixed layers illite/smectite; Chl = chlorite; Kao = kaolinite; Σ Clay minerals = sum clay minerals.

Representative XRD patterns of ethylene glycol solvated clay fraction powders of selected samples. On the left (a–d) decomposition at low angles; on the right (e–h) decomposition at higher angles. Ill = illite; I/S = mixed layers illite/smectite; Chl = chlorite.

4.d. Structural analysis: fracture orientation
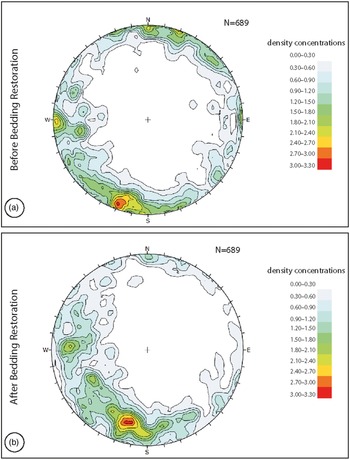
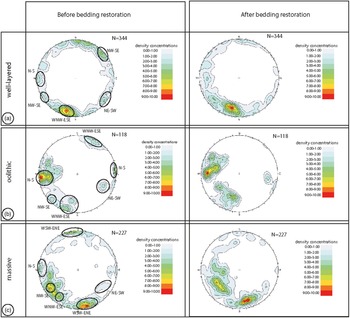
The cumulative plots of fracture poles are shown in equal-area, lower-hemisphere projections (Allmendinger et al. Reference Allmendinger, Cardozo and Fisher2011) as present-day data (Fig. 8a) and after bedding restoration (Fig. 8b). Fracture data were restored by considering the attitude of single carbonate beds. The fracture poles mainly cluster around N199E/06 and N195E/23 (trend/plunge), which are related to c. WNW–ESE-striking fractures respectively dipping 84° and 67°.
Cumulative lower-hemisphere, equal-area stereographic projection of fracture poles (a) after field measurements and (b) after bedding restoration. Fracture data restored considering the attitude of single beds from which data were gathered.

In order to precisely document the fracture orientation, the available data are subdivided into three different subsets respectively corresponding to the well-layered, oolithic and massive carbonates. Five main high-angle sets are shown by both original and restored data (Fig. 9):
fractures striking WNW–ESE;
fractures striking WSW–ENE;
fractures striking N–S;
fractures striking NW–SE;
fractures striking NE–SW.
Lower-hemisphere equal-area stereographic projection of fracture poles after field measurements (left) and after bedding restoration (right), subdivided into three subsets, according to the related carbonate units: (a) well-layered carbonates; (b) oolithic carbonates; (c) massive carbonates.

The WNW–ESE-striking fractures show a dense pole cluster in the well-layered carbonates, forming a 68° cut-off angle with bedding. They are also present in the oolithic carbonates, determining a 56° cut-off angle. The WSW–ENE-striking fractures are mainly present in the massive carbonates, forming a c. 70° cut-off angle with bedding. The N–S-striking fractures are rare in both well-layered and massive carbonates, whereas they form a dense pole cluster in the oolithic carbonates determining a c. 70° cut-off angle with bedding. The NW–SE-striking fractures form low-density pole clusters in all study carbonates, with cut-off angles of 74° (well-layered carbonates) to 55° with bedding (both oolithic and massive carbonates). The NE–SW-striking fractures form low-density pole clusters in all study carbonates, with cut-off angles of 86° (well-layered carbonates), 71° (massive carbonates) and 67° with bedding (oolithic carbonates), respectively.
4.e. Structural analysis: fracture density and intensity
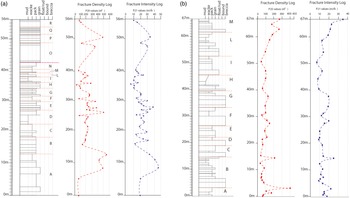
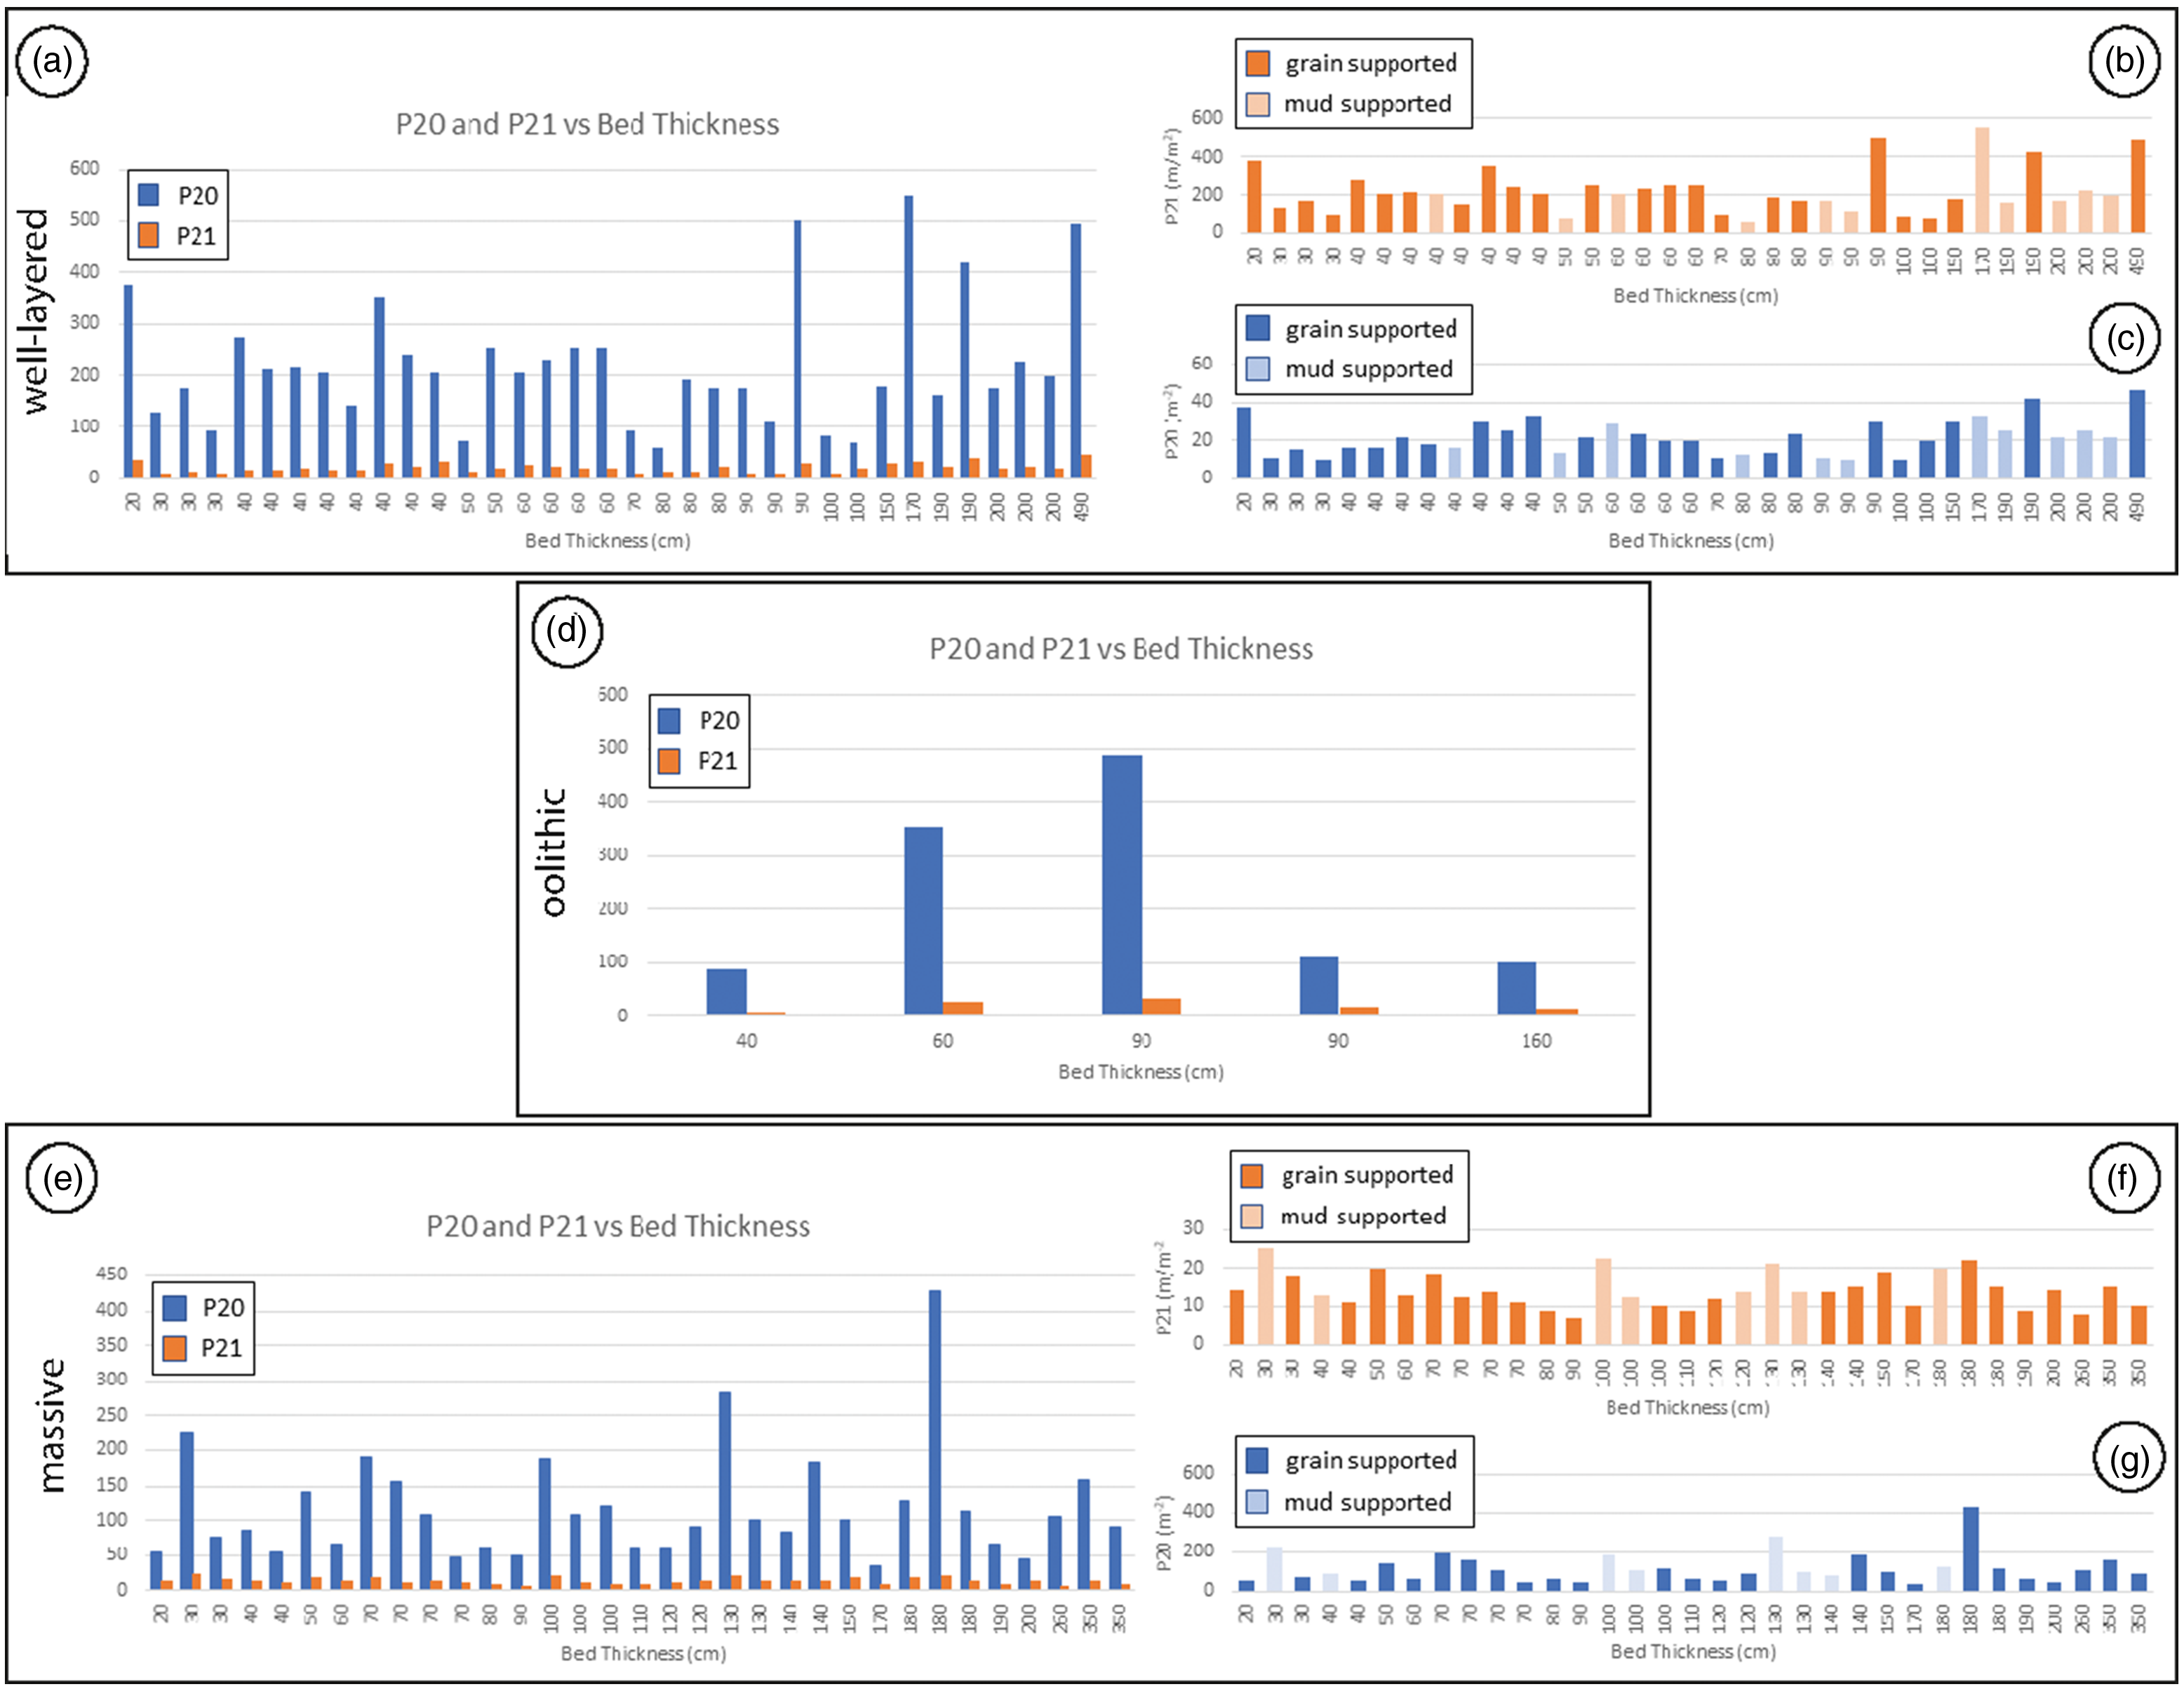
At the Scarrone la macchia site, (Figs 10a, 11) P20 varies from 61 m−2 (1 m thick carbonate wackestone bed, c. 35 m above the base level) to 552 m−2 (40 cm thick carbonate packstone bed, c. 14 m above the base level) throughout the well-layered carbonates. There, P20 commonly decreases upward within single bed packages. In the same carbonate unit, P21 varies from 10 m−1 (1 m-thick carbonate wackestone bed, c. 35 m above the base level) to 46.7 m−1 (1.6 m thick carbonate grainstone bed, c. 7 m above the base level). Similar to fracture density, P21 also decreases upward within single bed packages.
Fracture density (P20) and intensity (P21) logs after field circular scanline measurements conducted across (a) well-layered and oolithic carbonates, and (b) massive carbonates.

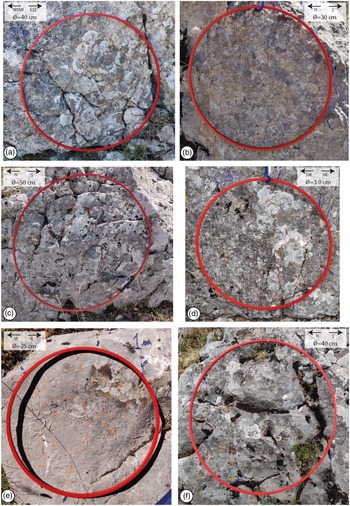
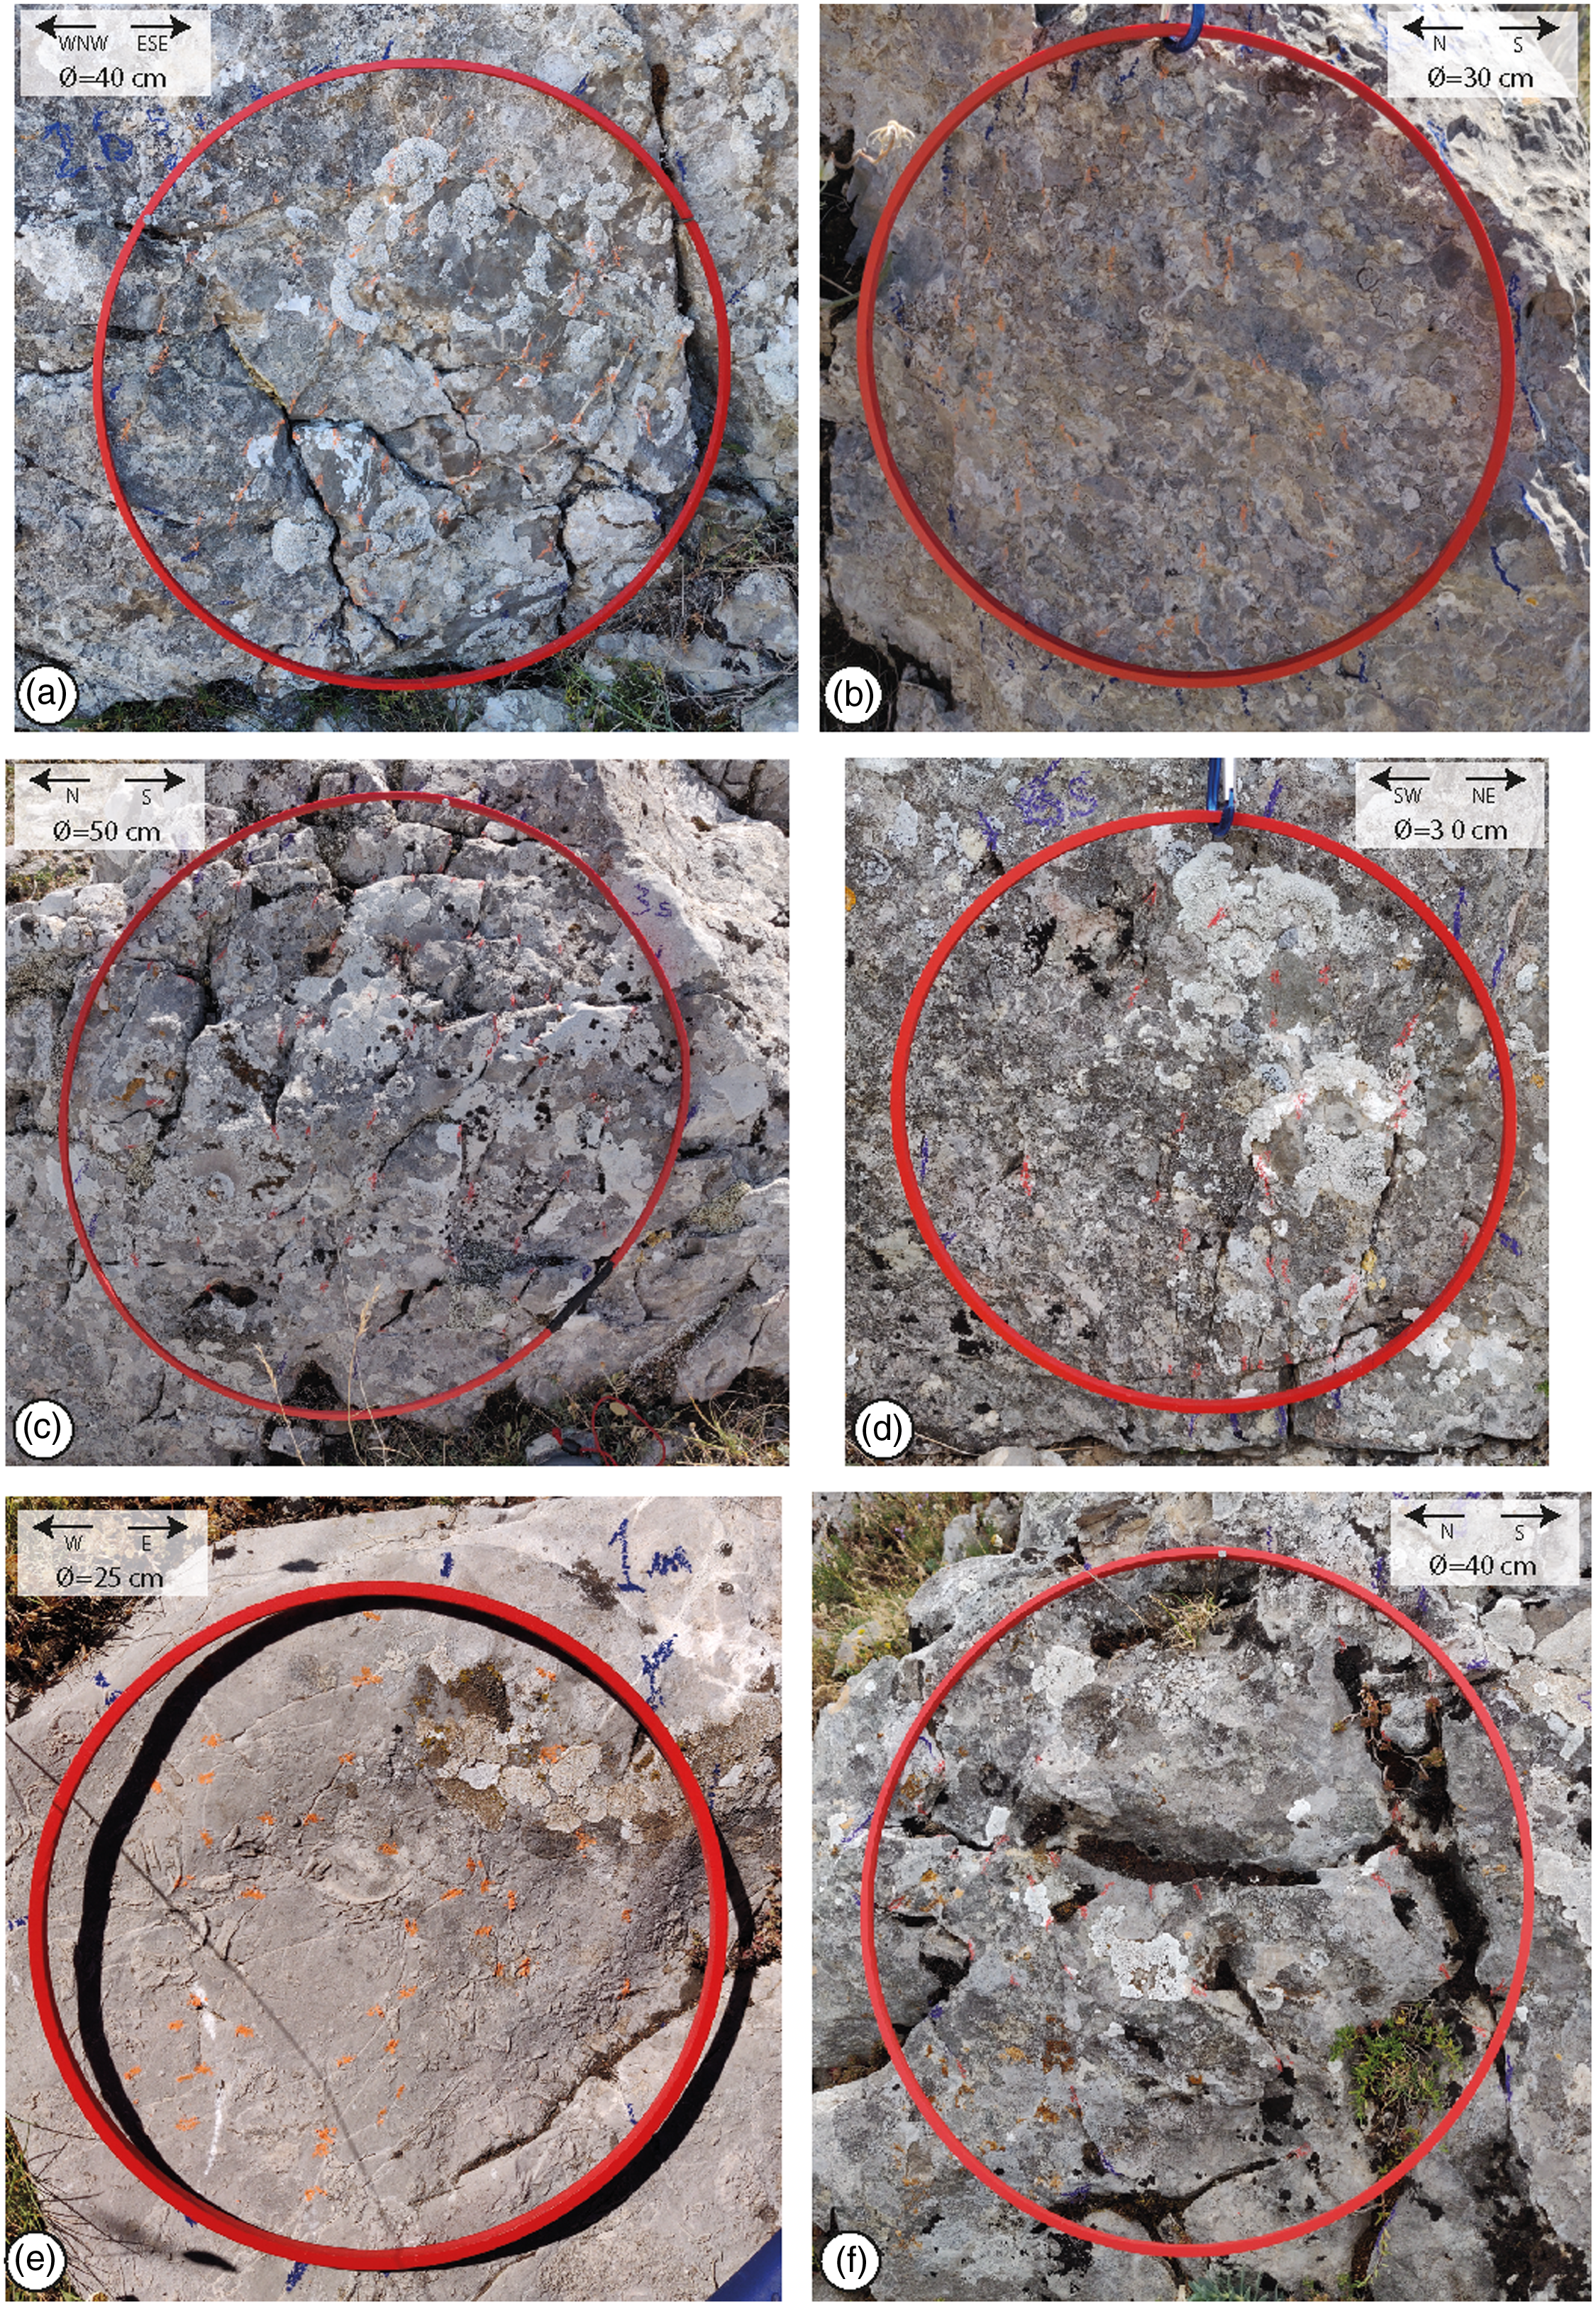
Outcrop images of the investigated carbonate beds by means of circular scanlines: (a, b) well-layered carbonates; (c, d) oolithic carbonates; (e, f) massive carbonates. The right column (a, c, e) shows the beds characterized by high fracture density and intensity; the left column (b, d, f) shows the beds with high fracture density and intensity.
In the oolithic carbonates (Fig. 10a), P20 varies from 87.6 m−2 (90 cm thick carbonate grainstone bed, c. 55m above the base level) to 488 m-2 (50 cm thick carbonate grainstone bed, c. 50 m above the base level). P21 ranges from 1.0 m−1 (90 cm thick carbonate grainstone bed, c. 55 m above the base level) to 47.5 m−1 (50 cm thick carbonate grainstone bed, c. 50 m above the base level). The highest values of both P20 and P21 characterize the topmost beds of single bed packages.
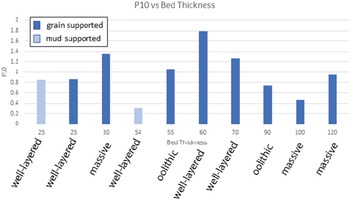
The P10 values computed for the WNW–ESE and WSW–ENE-striking, high-angle fractures respectively associated with the denser pole clusters documented within the well-layered and massive carbonates are between c. 0.3 and 1.8 m−1 (Table 3).
P10 variations for the JV1 fracture set

At the Il monte site (Figs 10b, 11), the massive carbonates show P20 varying from 43.3 m−2 (20 cm-thick mudstone bed, c. 14 m above the base level) to 184 m−2 (3 m thick carbonate breccia bed, c. 4 m above the base level). There, P21 ranges from 8 m−1 (60 cm thick carbonate packstone bed, c. 51 m above the base level) to 25 m−1 (2 m thick carbonate breccia bed, c. 14 m above the base level).
4.e. Structural analysis: multiscale fracture spacing properties
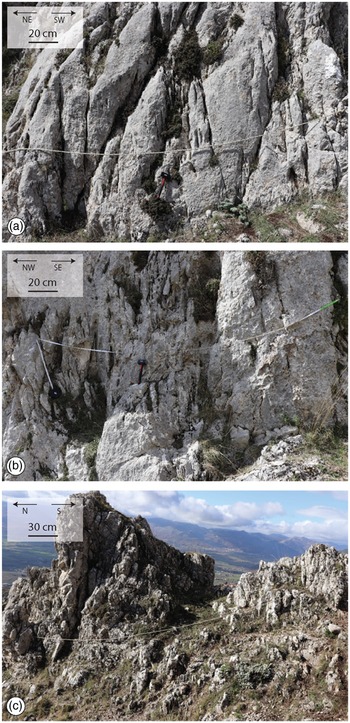
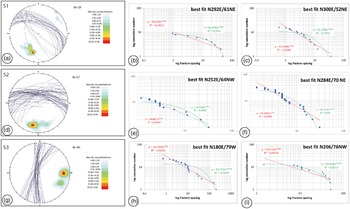
The fracture poles obtained after S1, S2 and S3 linear scanline measurements (Fig. 12) are reported in equal-area, lower-hemisphere projections (Fig. 13a, d, g). Along S1, the two main fracture sets respectively striking N292E and N300E show an exponential best fit (R 2 = 0.97) and a power law best fit (R 2 = 0.93) in the bilogarithmic fracture spacing vs cumulative number plots (Fig. 13b, c). Along S2, the two main fracture sets striking N252E and N284E are respectively characterized by power law (R 2 = 0. 96) and exponential (R 2 = 0.93) fracture spacing distributions (Fig. 13e, f). Along S3, the two main fracture sets striking N180E and N206E respectively show power law (R 2 = 0.92) and exponential (R 2 = 0.87) fracture spacing distributions (Fig. 13h, i).
Outcrop images of the (a) S1, (b) S2 and (c) S3 linear scanlines.

Multiscale fracture spacing distribution. (a) Lower-hemisphere, equal-area stereographic projection of fracture poles of the S1 scanline; (b) log cumulative number vs spacing and best fit relative to the N292 striking set; (c) log cumulative number vs spacing and best fit relative to the N300 striking set; (d) lower-hemisphere, equal-area stereographic projection of fracture poles of the S2 scanline; (e) log cumulative number vs spacing and best fit relative to the N252 striking set; (f) log cumulative number vs spacing and best fit relative to the N284 striking set; (g) lower-hemisphere, equal-area stereographic projection of fracture poles of the S3 scanline; (h) log cumulative number vs spacing and best fit relative to the N180 striking set; (i) log cumulative number vs spacing and best fit relative to the N206 striking set.

5. Discussion
In this section, we first discuss the results of stratigraphic, petrographic and mineralogical analyses to assess the palaeodepositional environments and diagenetic conditions. Then the computed P20, P21 and P10 values are considered, to unravel the fracture stratigraphy properties of the Mesozoic platform carbonates.
5.a. Depositional setting
The Apennine Platform is considered as part of the bridge that connected the African Plate to the Adria microplate (Zarcone et al. Reference Zarcone, Petti, Cillari, Di Stefano, Guzzetta and Nicosia2010; Randazzo et al., Reference Randazzo, Di Stefano, Schlagintweit, Todaro, Cacciatore and Zarcone2021). Its carbonate factory was established during the Late Triassic, and lasted until the middle Cretaceous (Selli, Reference Selli1957; Sartoni & Crescenti, Reference Sartoni and Crescenti1961, Reference Sartoni and Crescenti1962). Previous studies ascribed the Viggiano Mountain carbonates to the Alburno–Cervati Unit (Lechler et al. Reference Lechler, Frijia, Mutti, Palladino and Prosser2012). In this study, we support this interpretation, and provide further constraints for the assessment of their depositional setting.
According to the presence of large benthic foraminifera and algae, the well-layered carbonates formed at tropical and subtropical latitudes within an inner shallow platform environment (Flügel, Reference Flügel2004) characterized by well-oxygenated, warm waters (Fugagnoli, Reference Fugagnoli2004). Furthermore, the presence of ooids, irregular clasts and thick shells of Lithiotis bivalves is consistent with occasional turbulent conditions, build-ups and sand shoals (Clari, Reference Clari1976; Flügel Reference Flügel2004; Gale et al. Reference Gale, Kennedy, Voigt and Walaszczyk2005). Accordingly, we assess that carbonate deposition took place in a lagoonal environment protected by sand shoals. The informal litho-biostratigraphic zonation is mainly based on benthic foraminifers and calcareous algae association. The Palaeodasycladus mediterraneus distribution covers the whole Lower Jurassic (Barattolo, Reference Barattolo1991); however, the presence of these algae with benthic foraminifera such as Haurania sp., Siphovalvulina sp. and Lituosepta sp. is consistent with upper Sinemurian–Pliensbachian age (Todaro et al. Reference Todaro, Di Stefano, Zarcone and Randazzo2017 and references therein).
The oolithic carbonates formed in high-energy water conditions, above fair-weather wave base, within depositional environments characterized by a wide, low-gradient ramp rimmed by sand shoals (Flügel, Reference Flügel2004; BouDagher-Fadel, Reference BouDagher-Fadel2008). Formation of the sandy margin was due to the absence of sponge reefs, as a consequence of the end-Triassic mass extinction (Di Stefano et al. Reference Di Stefano, Alessi and Gullo1996, Todaro et al. Reference Todaro, Rigo, Randazzo and Di Stefano2018). The lithofacies transition between well-layered and oolithic carbonates hence marked both relative deepening and landward migration of the depositional setting, similar to other Lower Jurassic carbonate platforms of western Tethys (Mei & Gao, Reference Mei and Gao2012; Ettinger et al. Reference Ettinger, Larson, Kerans, Thibodeau, Hattori, Kacur and Martindale2021). Accordingly, the Pliensbachian–Toarcian extinction is associated with a sequence boundary related to transgression (Hallam, Reference Hallam1997; Haq, Reference Haq2018), which drowned the carbonate platform and therefore affected the carbonate factory.
The massive carbonates formed in a high-energy shelf environment (Flügel, Reference Flügel2004). In detail, the shallow-water biota, rounded skeletal fragments and/or pristine rudist fossils (Caprinids bouquet in growth position; Bentivenga et al. Reference Bentivenga, Palladino, Prosser, Guglielmi, Geremia and Laviano2017) are consistent with moderate- to high-energy depositional environments close to the platform margin (reef to fore-reef) (Di Stefano & Ruberti, Reference Di Stefano and Ruberti2000; Hughes & Tanner, Reference Hughes and Tanner2000). On the other hand, the stromatolites, ooids and oncoids are consistent with more internal lagoonal–tidal environments not far from the platform margin, as also documented in northern Sicily (Di Stefano & Ruberti, Reference Di Stefano and Ruberti2000). Moreover, the stromatolitic laminae and meniscus cements respectively recorded relative sea level oscillations and near-surface fluid circulation conditions (Flügel, Reference Flügel2004).
5.b. Diagenetic evolution
Clay mineral analysis is useful for assessing palaeoclimatic conditions and diagenetic rock evolution (Hoffman & Hower, Reference Hoffman, Hower, Scholle and Schluger1979; Chamley, Reference Chamley1989; Cavalcante et al., Reference Cavalcante, Fiore, Piccarreta and Tateo2003, 2011; Mazzoli et al., Reference Mazzoli, D’Errico, Aldega, Corrado, Invernizzi, Shiner and Zattin2008; Waliczek et al., Reference Waliczek, Machowski, Poprawa, Świerczewska and Więcław2021). The very low amount, or absence, of goethite, kaolinite, hematite and boehmite in the study powders suggests the lack of any terrigeneous component associated to possible post-sedimentary reworking processes and/or subaerial alteration (Agosta et al. 2021, and references therein). The presence of mixed illite/smectite layers with R1 and R3 ordering with a high percentage of illite is consistent with c. 130 °C thermal maturity, typical of high diagenetic conditions (Merriman & Peacor, Reference Merriman and Peacor1999; Cavalcante et al., Reference Cavalcante, Belviso, Laurita and Prosser2012; Perri et al., 2016; Waliczek et al., Reference Waliczek, Machowski, Poprawa, Świerczewska and Więcław2021). However, since smectite illitization and mixed-layer formation are also time-dependent processes (McCubbin & Patton, Reference McCubbin and Patton1981; Pollastro, Reference Pollastro1993), and a function of K-availability (Cavalcante et al., Reference Cavalcante, Fiore, Lettino, Piccarreta and Tateo2007, Reference Cavalcante, Prosser, Agosta, Belviso and Corrado2015), we assess 100–130 °C diagenetic temperature range conditions. Assuming 20–25 °C temperature gradients, typical of accretionary wedges (Merriman, Reference Merriman2005), a c. 4–5 km burial is therefore estimated for the study carbonates. Considering that the overall platform carbonate thickness is less than 1 km (Patacca & Scandone, 2007), the aforementioned diagenetic conditions were likely related to the structural stacking of the Apennines allochthonous units.
5.c. Diffuse vs localized fractures
Within the well-layered carbonates, the exponential fracture spacing distributions assessed for the N292E, N284E and N206E fracture sets are due to a deformation that took place under uniform, remote stress fields (Dershowitz & Einstein, Reference Dershowitz and Einstein1988). Fracturing in this case is hence comparable to a Poissonian process (Cruden, Reference Cruden1977), in which the probability that a fracture could enucleate within a given space interval (i.e. single carbonate beds) is constant. The three aforementioned fracture sets therefore form a diffuse fracture network, whose failure modes and relative timing of formation are not yet assessed. However, the power-law fracture spacing distributions computed for the N300E, N252E and N180E fracture sets are due to a deformation that occurred under local stress fields (Bonnet et al. Reference Bonnet, Bour, Odling, Davy, Main, Cowie and Berkowitz2001, and references therein). These fracture sets therefore form a localized network and their fractal dimension, D, corresponds the slope of the best-fit line (Mandelbrot &Wheeler, Reference Mandelbrot and Wheeler1983). The computed D values for the three aforementioned localized fracture sets are between 0.56 and 0.76, suggesting poorly developed N180E fractures and moderately developed N300E and N252E fractures, respectively (Gillespie et al. Reference Gillespie, Howard, Walsh and Watterson1993). Our results are similar to those gathered by Panza et al. (2016) and Giuffrida et al. (2019), who respectively documented D values between 0.45 and 0.69, and between 0.39 and 0.81 for fractures measured away from major fault zones cross-cutting Apulian platform carbonates. Regarding the Viggiano Mountain study area, Cello et al. (2000) also documented a low degree of fracture development within the carbonate fault damage zones, with D values between 1.25 and 1.40 after box-counting methodology.
Focusing on the WNW–ESE-striking fractures, the most common set within the well-layered carbonates (cf. Fig. 8), both N284E- and N292E-striking fractures pertain to the diffuse network, and the N300E-striking fractures to the localized network. We interpret these results as due to multiple stages of fracture nucleation and subsequent development. Specifically, we propose that the WNW–ESE fractures first nucleated under uniform, remote stress fields likely associated with burial diagenesis (Korneva et al. Reference Korneva, Tondi, Agosta, Rustichelli, Spina, Bitonte and Di Cuia2014; Lavenu et al. Reference Lavenu, Lamarche, Salardon, Gallois, Marié and Gauthier2014; Lavenu & Lamarche, Reference Lavenu and Lamarche2018; La Bruna et al. Reference La Bruna, Lamarche, Agosta, Rustichelli, Giuffrida, Salardon and Marié2020; Agosta et al. 2021) and/or palaeo-foreland bulging of the carbonates (Tavani et al. Reference Tavani, Storti, Lacombe, Corradetti, Muñoz and Mazzoli2015; Corradetti et al. Reference Corradetti, Tavani, Parente, Iannace, Vinci, Pirmez, Torrieri, Giorgioni, Pignalosa and Mazzoli2018). Subsequently, sub-parallel fractures formed under local stress fields associated with mesoscale faulting, as documented for faulted carbonates of the Apulian Platform exposed in the Majella Mountain (Agosta et al. Reference Agosta, Alessandroni, Antonellini, Tondi and Giorgioni2010; Volatili et al. Reference Volatili, Zambrano, Cilona, Huisman, Rustichelli, Giorgioni, Vittori and Tondi2019; Romano et al. Reference Romano, Bigi, Carnevale, De’haven Hyman, Karra, Valocchi, Tartarello and Battaglia2020), and Murge Plateau of Italy (Panza et al. Reference Panza, Agosta, Zambrano, Tondi, Prosser, Giorgioni and Janiseck2015, 2016; Zambrano et al. Reference Zambrano, Tondi, Korneva, Panza, Agosta, Janiseck and Giorgioni2016).
5.d. Fracture stratigraphy
Fracture density is related to nucleating fracture networks according to fracture linkage configuration (Myers & Aydin, Reference Myers and Aydin2004; Agosta & Aydin, Reference Agosta and Aydin2006; De Joussineau & Aydin, Reference De Joussineau and Aydin2007; Antonellini et al. Reference Antonellini, Tondi, Agosta, Aydin and Cello2008; Agosta et al. Reference Agosta, Alessandroni, Antonellini, Tondi and Giorgioni2010), and to rock elastic properties (Gross et al. Reference Gross, Fischer, Engelder and Greenfield1995; Agosta et al. Reference Agosta, Wilson and Aydin2015; Rustichelli et al. Reference Rustichelli, Torrieri, Tondi, Laurita, Strauss, Agosta and Balsamo2016). However, fracture intensity is associated with well-connected fracture networks, which often localize within fault damage zones (De Joussineau & Aydin, Reference De Joussineau and Aydin2007; Aydin et al. Reference Aydin, Antonellini, Tondi and Agosta2010; Demurtas et al. Reference Demurtas, Fondriest, Balsamo, Clemenzi, Storti, Bistacchi and Di Toro2016; Giuffrida et al. 2019; Mercuri et al. Reference Mercuri, Carminati, Tartarello, Brandano, Mazzanti, Brunetti, McCaffrey and Collettini2020; Camanni et al. Reference Camanni, Vinci, Tavani, Ferrandino, Mazzoli, Corradetti, Parente and Iannace2021).
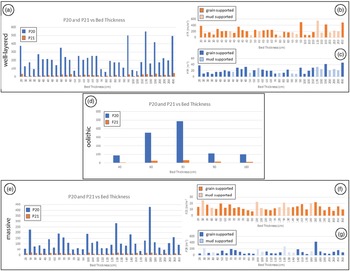
At the Viggiano Mountain, neither P20 nor P21 varies proportionally with the bed thickness (Fig. 14a, d, e). Such a lack of proportionality is also displayed by the P10 values computed for the WNW–ESE (well-layered) and ENE–WSE (massive carbonates)-striking fractures (Fig. 15), the most common in those sedimentary units. This finding contrasts with common spacing distributions documented for single fracture sets in layered rock masses (Nur & Israel, Reference Nur and Israel1980; Gross et al. Reference Gross, Fischer, Engelder and Greenfield1995; Bai & Pollard, Reference Bai and Pollard2000; Schöpfer et al. Reference Schöpfer, Arslan, Walsh and Childs2011), and can be explained by the structural complexity of the studied carbonate outcrops, which expose both diffuse and localized fractures (cf. Section 5.c ).
(a, d, e) Bed thickness vs P20 and P21 values for (a) well-layered carbonates; (d) oolithic carbonates; (e) massive carbonates. (b) Bed thickness vs P20 for the mud-supported carbonate, in which the grain-supported and the mud-supported beds are highlighted; (c) bed thickness vs P21 for the mud-supported carbonate, in which the grain-supported and the mud-supported beds are highlighted; (f) bed thickness vs P20 for the massive carbonate, in which the grain-supported and the mud-supported beds are highlighted; (g) bed thickness vs P21 for the massive carbonate, in which the grain-supported and the mud-supported beds are highlighted.
Bed thickness vs P10 values calculated through significant beds in the three carbonate units. The grain-supported lithofacies and the mud-supported lithofacies are highlighted.

The P20 and P21 logs show similar trends in both well-layered and oolithic carbonates (cf. Fig. 10a). In layered carbonates, this is consistent with non-strata-bound fractures forming due to linkage of pre-existing structural elements, and with nucleation of new strata-bound fractures within the narrow process zones that localize at the primary interfaces (Agosta & Aydin, Reference Agosta and Aydin2006; Antonellini et al. Reference Antonellini, Tondi, Agosta, Aydin and Cello2008; Agosta et al. Reference Agosta, Alessandroni, Tondi and Aydin2009). However, the P20 and P21 values do not show great similarities in the massive carbonates (cf. Fig. 10b). Accordingly, we assess that these carbonates with weak primary interfaces were mainly affected by fracture linkage processes, which dominated over fracture nucleation forming well-developed, vertically persistent fractures. The modalities of fracture propagation across the depositional and diagenetic interfaces exposed at the Scarrone la macchia site are currently under investigation. The results of this work will likely shed light on the deformation mechanisms associated with primary interface disruptions.
Focusing on the possible correlations among P20, P21 and carbonate lithology, we document higher values of both fracture density and intensity in the grain-supported carbonate beds (Fig. 14b, c, f, g). Accordingly, we attribute such a pervasiveness of diffuse fractures to the high values of the elastic moduli that characterized the grain-supported carbonates at times of deformation (sensu Bai & Pollard, Reference Bai and Pollard2000 and references therein). Our interpretation supports previous data published by Wennberg et al. (Reference Wennberg, Svånå, Azizzadeh, Aqrawi, Brockbank, Lyslo and Ogilvie2006) for carbonates with relatively weak bed interfaces, and by Larsen et al. (Reference Larsen, Gudmundsson, Grunnaleite, Sælen, Talbot and Buckley2010) for rock multilayers in which carbonate mudstone beds arrested/deflected a great number of fractures. We further assess that the relatively high values of the elastic moduli characterized the grain-supported carbonate beds due to burial-related physical/chemical compaction (Rustichelli et al. 2012, Reference Rustichelli, Tondi, Korneva, Baud, Vinciguerra, Agosta, Reuschlé and Janiseck2015) and/or cementation processes (Eberli et al. Reference Eberli, Baechle, Anselmetti and Incze2003; Lamarche et al. 2012; Lavenu et al. Reference Lavenu, Lamarche, Salardon, Gallois, Marié and Gauthier2014; Lavenu & Lamarche, Reference Lavenu and Lamarche2018; La Bruna et al. Reference La Bruna, Lamarche, Agosta, Rustichelli, Giuffrida, Salardon and Marié2020), as suggested by the high P10 values documented in these rocks for the WNW–ESE and WSW–ESE fractures (cf. Table 3).
Previous studies have documented the control exerted by carbonate lithofacies on fracture intensity. Mercuri et al. (Reference Mercuri, Carminati, Tartarello, Brandano, Mazzanti, Brunetti, McCaffrey and Collettini2020) investigated a relay ramp zone in Mesozoic platform carbonates of central Italy, and documented lower P10 in carbonate packstones relative to carbonate grainstones and boundstones. At larger scales of observation, Corradetti et al. (Reference Corradetti, Tavani, Parente, Iannace, Vinci, Pirmez, Torrieri, Giorgioni, Pignalosa and Mazzoli2018) documented higher P21 in the dolomitic units encompassed by limestone beds pertaining to Mesozoic platform carbonates exposed in southern Italy. There, diagenetic dolomitization within discrete rock intervals (Vinci et al. Reference Vinci, Iannace, Parente, Pirmez, Torrieri and Giorgioni2017 and references therein) was invoked as the driving mechanism for fracture localization within specific carbonate beds and bed packages.
6. Conclusions
This work focused on the palaeodepositional settings, amount of overburden and fracture stratigraphy of Mesozoic platform carbonates exposed at the Viggiano Mountain area, southern Italy. In particular, three main depositional units, respectively labelled as well-layered, oolithic and massive carbonates, were investigated. The Sinemurian–Pleinsbachian well-layered carbonates formed in a lagoonal environment protected by sand shoals. They include both mm-thick bed interfaces with pressure solution seams and cm-thick bed package interfaces including small amounts of terrigenous material. The Toarcian oolithic carbonates were deposited in a ramp rimmed by sand shoals. The oolithic carbonates contain amalgamated carbonate beds, and bed package interfaces made up of mm-thick terrigenous laminae. A large-scale stratigraphic interface including 10–15 cm thick mixed carbonate–terrigenous rock was documented between the two aforementioned sedimentary units. However, the Cenomanian massive carbonates were deposited in a moderate- to high-energy setting, not far from the platform margin. These rocks are primarily made up of primary breccia and rudist fragments. The well-layered carbonates were subjected to a thermal temperature of 100–130 °C, as shown by the R1 and R3 ordering of liilte/smectite documented after XRPD analyses of carbonate powders. Such a temperature was associated with 4–5 km of burial depth associated with the structural stacking of the allochtonous units of the southern Apennines fold-and-thrust belt.
Results of quantitative field structural analysis were consistent with the presence of five main sets of high-angle fractures. According to the results of linear scanline measurements, both diffuse and localized fracture networks cross-cut the study carbonates. The former network includes two orthogonal, high-angle fracture sets striking c. ENE–WSW and SSW–NNE. However, the localized network is made up of ENE–WSW-, ESE–WNW- and N–S-striking high-angle fractures. According to the computed D values, the localized fracture sets were interpreted as characterized by a low degree of maturity. Results of circular scanline measurements showed similar trends of both P20 and P21 throughout the well-layered and oolithic carbonate successions. Such similarity was interpreted as due to fault-related fracturing, which mainly localized across primary heterogeneities such as bed and bed-package interfaces. The vertical growth of incipient slip surfaces by linkage of pre-existing structural elements was affected by the mechanical control exerted by the aforementioned interfaces. However, P20 and P21 do not show very similar trends throughout the massive carbonates due to pronounced bed amalgamation.
Results of fracture stratigraphy analysis hence showed that the computed P20 and P21 did not vary in proportion to bed thickness. These results contrasted with common spacing distributions documented for single fracture sets in layered rock masses, and were interpreted in light of the structural complexity of the studied carbonate outcrops exposing both diffuse and localized fractures. On the other hand, similar to P10 computed for the most common diffuse fracture sets, both P20 and P21 showed the highest values in correspondence to the coarse-grained carbonate beds. These data are explained by taking into account the burial-related physical–chemical compaction and/or cementation processes. They profoundly affect the mechanical properties of the carbonate multilayers, determining fracture pervasiveness within carbonate beds with the original larger pore space. Further analyses will be required to assess the specific diagenetic mechanisms associated with overburden, which likely played a major role in the fracture stratigraphy of the studied Mesozoic carbonates.
Acknowledgements
This work is part of the first author’s PhD research work. C.M. acknowledges the help and contribution provided by Grazia de Grazia, Innocenzo Manniello and Giulia Schirripa Spagnolo during fieldwork. Previous work by Nicola Costantino is acknowledged. The revisions of Andrea Billi and of two anonymous referees, as well as comments provided by the guest editor Stefano Tavani, greatly improved the quality of this work. This research is supported by the Reservoir Characterization Project (www.rechproject.com) and by Eni SpA.
Conflict of interest
The authors declare that there is no conflict of interest.