Introduction
Alloys with five or more principal elements are designated as high-entropy alloys (HEAs), complex concentrated alloys (CCAs), etc., which explore the central region of the phase diagram. HEAs with remarkable properties like high toughness, fracture strength [Reference Liu, Lu, He, Luan, Wang, Liu, Liu, Chen and Liu1, Reference Ganji, Sai Karthik, Bhanu Sankara Rao and Rajulapati2], high strength [Reference Huo, Zhou, Fang, Xie and Jiang3], good ductility, better cryogenic properties [Reference Jo, Jung, Choi, Sohn, Kim, Lee, Kim and Lee4], good corrosion resistance [Reference Nair, Arora, Mukherjee, Singh, Singh and Grewal5], etc., are explored in the literature and hence can be considered as potential candidates for critical applications [Reference Miracle and Senkov6]. HEAs can also be designed to obtain conventional as well as unique microstructure, which is suitable for different applications [Reference Zhang, Zhou, Jin, Du and Li7, Reference Li, Pradeep, Deng, Raabe and Tasan8]. It is reported in open literature that HEAs show better strength and ductility [Reference Li, Pradeep, Deng, Raabe and Tasan8]. The phase evolution and solidification pathways are also reported in HEAs, which show unique microstructures, like eutectic [Reference Huo, Zhou, Fang, Xie and Jiang3, Reference He, Wang, Cheng, Wang, Li, Dang, Wang and Liu9, Reference Tan, Li, Wang, Kolbe and Kou10], quasi-peritectic [Reference Wu, Liu, Yang, Zhu, Lu and Wang11], and phase separation [Reference Peng, Liu, Zhang, Wu and Wang12, Reference He, Wang, Wu, Li, Wang and Liu13, Reference Munitz, Kaufman and Abbaschian14]. There are different criteria established in the literature to predict the phases and microstructure formation. These criteria include the atomic size difference, valence electron concentration, electronegativity difference, enthalpy of mixing, and entropy of mixing [Reference Huo, Zhou, Fang, Xie and Jiang3, Reference Lu, Jiang, Guo, Wang, Cao and Li15, Reference Chen, Qin, Zheng, Wang, Su, Chiu, Ding, Guo and Fu16]. It is to be noted that the usage of these parameters are not applicable to all HEAs, which make the design of HEAs cumbersome. The usage of thermodynamic simulation using CAPHAD approach is also reported in literature for the phase prediction in HEAs [Reference Beyramali Kivy, Asle Zaeem and Lekakh17]. The study of phase evolution is important to understand the physical metallurgy involved in these alloys and to optimize the composition domain.
Recently, Huo and coworkers reported a eutectic HEA with excellent compressive strength and ductility [Reference Huo, Zhou, Fang, Xie and Jiang3]. The strength is attributed to the presence of Laves phase and a simple solid solution phase. FeCoNiCrNbx eutectic systems reported in the literature show the presence of face-centered cubic (FCC) and Laves phase [Reference He, Wang, Cheng, Wang, Li, Dang, Wang and Liu9]. In these HEA systems, the amount of eutectic region increases with the Nb addition and reaches fully eutectic structure at 0.6 at.% of Nb. While increasing Nb further, the alloy shows formation of the eutectic region and Laves phase. The FeCoNiCrX (X = Zr, Ta, Mo) alloys with the combination of Laves and solid solution phases are reported in the literature [Reference Huo, Zhou, Fang, Xie and Jiang3, Reference Guo, Liu, Zhang, Qi, Wang, Zhao, Shang and Xiang18]. These studies suggest that the optimum combination of refractory elements alloying with the FeCoNiCr alloy can be designed to form multicomponent HEAs with better composite properties. Two-phase alloys with phase separation in the as-cast condition are reported in the HEA systems [Reference Wu, Liu, Yang, Zhu, Lu and Wang11]. The FeCoNiCuCr alloys show phase separation during undercooled conditions [Reference Wang, Hu, Luo, Meng, Geng and Wei19]. The eutectic FeCoNiCrNb0.25 shows the formation of γ″ precipitates during annealing at 750 °C [Reference He, Wang, Niu, Wu, Li, Wang, Liu and Dang20]. It is also observed that eutectic system with the formation of precipitates will enhance the properties. Nanoindentation studies can be used for screening compositions for the development of HEAs [Reference Maier-Kiener, Schuh, George, Clemens and Hohenwarter21]. Nanoindentation studies are reported for AlCoCrCuFeNi alloy and used to establish the deformation kinetics in HEAs [Reference Ganji, Sai Karthik, Bhanu Sankara Rao and Rajulapati2].
The high-temperature flow behavior was reported in HEA systems. Recent reports show the development of HEAs with nanoprecipitates, which can replace the conventional Ni-based superalloys [Reference Zhang, Zhou, Jin, Du and Li7]. The room temperature and high-temperature mechanical properties reported for this system are comparable to Ni-based superalloys. The high-temperature tensile behavior in CrMnFeCoNi system suggests the strong dependence of the yield strength over the temperature [Reference Jang, Praveen, Sung, Bae, Moon and Kim22]. The development of refractory HEAs makes the applicability of HEAs in high-temperature domain. The refractory HEAs with better ductility are recently developed by modifying the compositional domain and processing condition [Reference Wu, Si, Lin, Wang, Wang, Wang, Liu and Hui23]. The effect of processing domains on the properties of HEAs shows the need to study the flow behavior at high temperatures [Reference Samal, Rahul, Kottada and Phanikumar24]. The studies on eutectic alloys show that the microstructure of materials can be modified by varying the processing conditions [Reference Wani, Bhattacharjee, Sheikh, Clark, Park, Okawa, Guo, Bhattacharjee and Tsuji25].
In the present study, the effect of Nb addition on phase formation and solidification behavior in FeCoNiCu alloy was established. Nanoindentation study was carried out to establish the contribution of each phase in the selected alloy. Finally, the mechanical properties at room temperature and different temperatures of the studied HEAs are evaluated and correlated with microstructure.
Results and discussion
Thermodynamic prediction
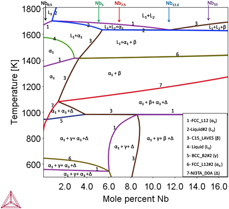
Figure 1 shows the phase diagram predicted by thermodynamic calculations using ThermoCalc® software (Thermo-Calc Software, Solna, Sweden) with TCHEA2® database. The variation in Nb in phase diagram shows eutectic point at 11.6 at.% of Nb. The alloys are chosen in such a way that eutectic region should be present in the microstructure. The eutectic high-entropy alloys (EHEAs) with simple solid solution phase and laves phase mixture exhibit a good combination of strength and ductility. According to the ThermoCalc® estimates, the primary phase is FCC phase below 11.6 at.% of Nb and Laves phase above 11.6 at.% of Nb. The thermodynamic estimates indicate that there is possibility of liquid phase separation. Using these calculations, the multicomponent FeCoNiCuNbx (x = 0.5, 5, 7.5, 11.6, 15) HEAs are selected for the present study to understand the detailed microstructure formation during solidification.
Phase diagram shows the equilibrium phase formation with Nb and the alloys selected for the study, where α1, FCC_L12; α3,FCC_L12#2, Δ-NI3TA_D0A; L1, Liquid; L2, Liquid#2; β, C15_LAVES; and γ, BCC_B2#2.

Structural characterization
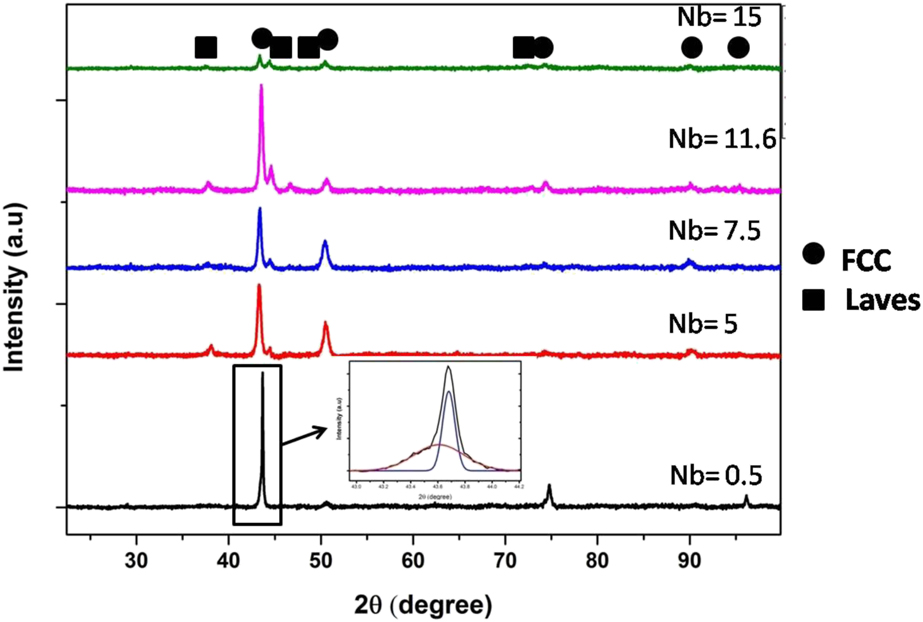
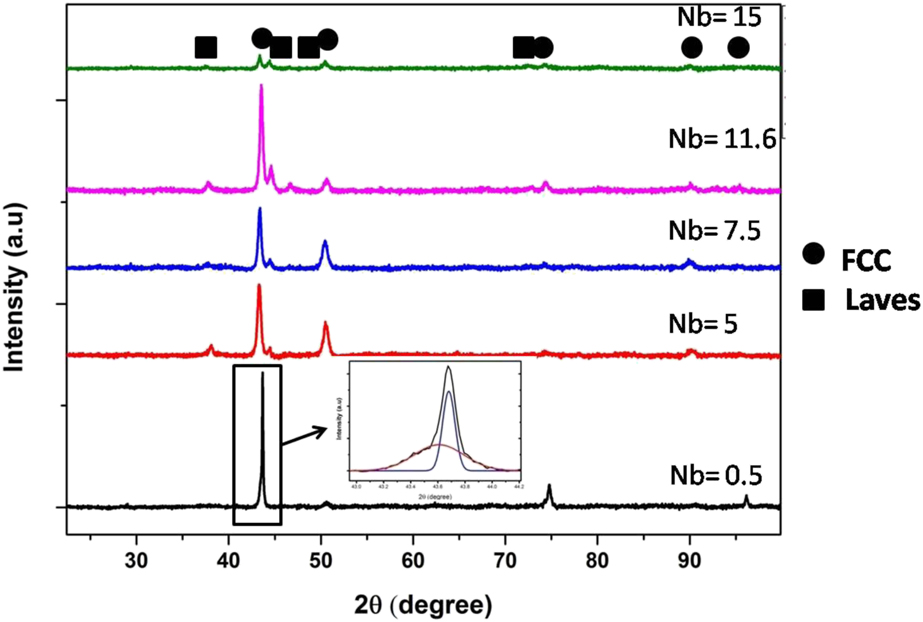
Figure 2 shows the X-Ray Diffraction (XRD) pattern of the studied HEAs with varying Nb content. The XRD pattern of 0.5 at.% of Nb in the HEAs shows only the presence of FCC phase. The deconvoluted first peak in the inset of Fig. 2 for 0.5 at.% of Nb condition shows the presence of two FCC phases with close lattice parameter. While increasing Nb content, it is found that the HEAs consist of FCC solid solution phase and Laves phase. The intensity of Laves phase was increased with increase in Nb, and it is approximately equal to FCC phase at 15 at.% of Nb, indicating the presence of equal volume fraction of each phases in the alloy.
XRD pattern of FeCoNiCuNbx alloys with varying concentration of Nb.
Microstructural characterization
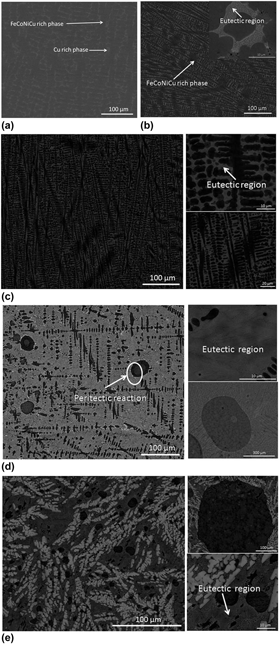
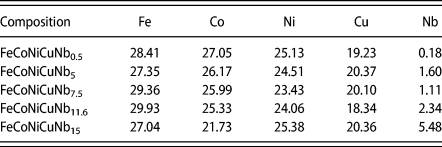
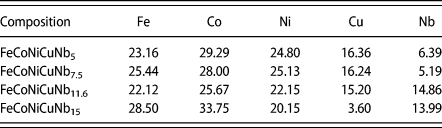
The microstructural characterization of the studied HEAs has been carried out using scanning electron microscopy (SEM) in backscattered electron (BSE) imaging mode to image distinctly the phases present in the microstructure using the elemental contrast. The phases in the microstructure are identified by compositional measurement using energy-dispersive spectroscopy (EDS). The representative micrographs are shown in Fig. 3, revealing the phase formation in these alloys with respect to the addition of Nb. It is clear that the solidification pathways are different with variation in Nb content. Figure 3(a) shows the SEM micrograph of FeCoNiCuNb0.5 alloy, showing the presence of only two phases, i.e., FeCoNi-rich phase (α1) and Cu-rich (α2) phase. The XRD graph (Fig. 2) confirms that both phases are FCC structure with close lattice parameter. The composition of phases is given in Tables I, II, and III. It is clear that the primary FeCoNiCu-rich phase (α1) is formed first from the liquid, followed by formation of Cu-rich phase (α2) in the interdendritic region. The highly positive enthalpy of mixing for Cu with Fe and Co could explain the segregation of Cu-rich phase in the interdendritic region.
BSE images of suction casted FeCoNiCuNbx alloys. (a) x = 0.5, (b) x = 5, (c) x = 7.5, (d) x = 11.6, and (e) x = 15.

Compositions of FeCoNiCu-rich phase.

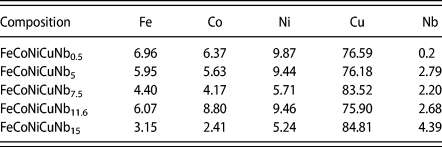
Compositions of Laves phase.

Composition of Cu-rich phase.

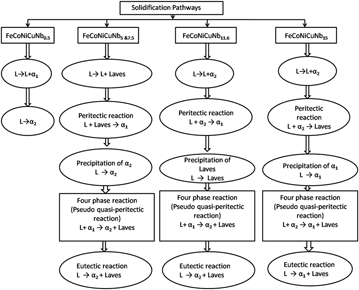
Figure 3(b) shows the SEM micrograph of 5 at.% of Nb content in the HEA. It is clear that the alloy consists of solid solution phases and eutectic region. The phases present are FeCoNiCu-rich phase (α1), (Fe, Co)2Nb-type Laves phase, and Cu-rich phase (α2). The eutectics are between Cu-rich phase (α2) and (Fe, Co)2Nb-type Laves phase. The solidification pathway can be explained as follows: (i) first primary (Fe, Co)2Nb-type Laves phase is formed from the liquid, followed by (ii) the formation of FeCoNiCu-rich phase (α1) as secondary phase due to peritectic reaction, and (iii) finally, the remaining liquid undergoes eutectic reaction to form Cu-rich phase (α2) and (Fe, Co)2Nb-type Laves phase. It is observed that Nb is mainly concentrated on the Laves phase. Figure 3(c) shows the SEM image of FeCoNiCuNb7.5 alloy. It is clear that the phase mixture remains same as that of FeCoNiCuNb5 alloy. However, the volume fraction of eutectics is more and the interlamellar spacing is decreased with increase in the Nb content from 5 to 7.5 at.%. The solidification pathway for FeCoNiCuNb7.5 is also similar to that for FeCoNiCuNb5 alloy. Therefore, based on microstructural characterization, the following pseudo quasi-peritectic reaction has been proposed for the alloys FeCoNiCuNb5 and FeCoNiCuNb7.5.
L + FeCoNiCu-rich phase (α1) → Cu-rich phase (α2) + (Fe, Co)2Nb-type Laves phase.
Figure 3(d) shows the microstructure of FeCoNiCuNb11.6 alloy, revealing fine-scale eutectics. One may expect some liquid phase immiscibility in alloys that contain Cu together with Fe and Co. The presence of Nb could also accelerate the liquid phase separation tendency. In this alloy, large spheres of Cu-rich phase are formed as the part of liquid phase separation. The spherical morphologies that appear inside the Cu-rich spheres indicate secondary liquid phase separation. This alloy also consists of Cu-rich phase (α2), FeCoNiCu-rich phase (α1), and Laves phase. The eutectic region was formed with the mixture of Cu-rich phase (α2) and (Fe, Co)2Nb-type Laves phase. The solidification pathway can be explained as follows: (i) first, the Cu-rich phase (α2) bubbles are formed from the liquid, followed by (ii) the formation of FeCoNiCu-rich phase (α1) by means of peritectic reaction [i.e., L + Cu-rich phase (α2) → FeCoNiCu-rich phase (α1)], (iii) (Fe, Co)2Nb-type Laves phase is precipitated from the remaining liquid, and (iv) finally, the liquid undergoes eutectic reaction between Cu-rich phase (α2) and (Fe, Co)2Nb-type Laves phase [i.e., L → Cu-rich phase (α2) + (Fe, Co)2Nb-type Laves phase]. Liquid phase separation is reported in HEAs with Fe and Cu. The alloys with two phase mixture can undergo liquid phase separation based on the processing condition; this can be evident from the undercooling studies of FeCoNiCuCr alloy [Reference Wang, Hu, Luo, Meng, Geng and Wei19]. Phase separation was reported even in AlCoCrCuFeNi [Reference Singh, Wanderka, Murty, Glatzel and Banhart26] alloys in nanoscale, which confirms that the high-entropy effect at high temperature is not able to avoid the phase separation. Therefore, based on microstructural characterization, the following pseudo quasi-peritectic reaction has been proposed for FeCoNiCuNb11.6 HEA.
L + FeCoNiCu-rich phase (α1) → Cu-rich phase (α2) + (Fe, Co)2Nb-type Laves phase.
Figure 3(e) reveals SEM micrograph of hypereutectic FeCoNiCuNb15 HEA, indicating the presence of FeCoNiCu-rich phase (α1), Cu-rich phase, and (Fe, Co)2Nb-type Laves phase. The large Cu-rich spherical morphologies confirm the role of Nb in liquid phase separation in this system. The Nb will aggregate the liquid phase separation tendency. Here, the amount of Laves phase is more and it forms separately. The solidification pathway can be explained as follows: (i) first, the Cu-rich phase (α2) spheres are formed from the liquid, followed by (ii) the formation of (Fe, Co)2Nb-type Laves phase by means of peritectic reaction [i.e., L + Cu-rich phase (α2) → (Fe, Co)2Nb-type Laves phase], (iii) FeCoNiCu-rich phase (α1) is precipitated from the remaining liquid, and (iv) finally, the liquid undergoes eutectic reaction between FeCoNiCu-rich phase (α1) and (Fe, Co)2Nb-type Laves phase [i.e., L → FeCoNiCu-rich phase (α1) + (Fe, Co)2Nb-type Laves phase]. Similarly, based on microstructural characterization, the pseudo quasi-peritectic reaction has been proposed for hypereutectic FeCoNiCuNb15 HEA.
L + Cu-rich phase (α2) → FeCoNiCu-rich phase (α1) + (Fe, Co)2Nb-type Laves phase.
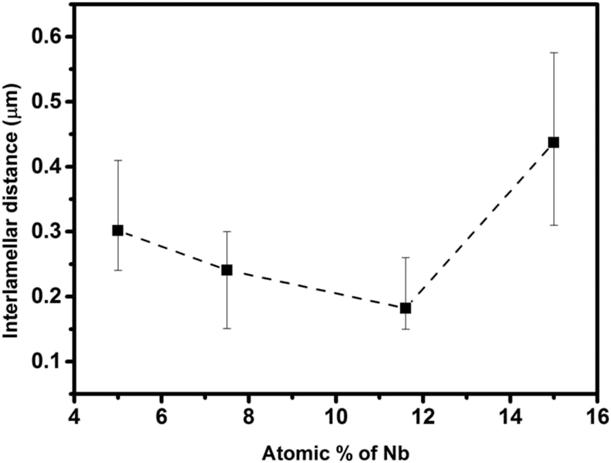
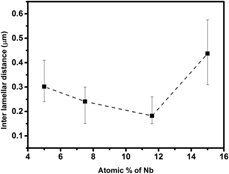
From the SEM micrographs, it is clear that the phases are same from 5 to 15 at.% Nb, but the phase fractions obtained are varying based on the composition. From Fig. 4, it is clear that the interlamellar spacing decreases with Nb addition up to a certain value of Nb, then it will increase to hypereutectic region. From Table I, it is clear that the amount of Nb slightly increases in the FeCoNiCu-rich region and other elements almost maintain same ratio. It is found from Table II that the Nb in the Laves phase is increasing, which affects the strength of eutectic. Figure 5 shows the solidification pathways for these alloys.
Interlamellar space variation of eutectic region in the FeCoNiCuNbx system.

Detailed solidification pathways for FeCoNiCuNbx system.

Mechanical properties
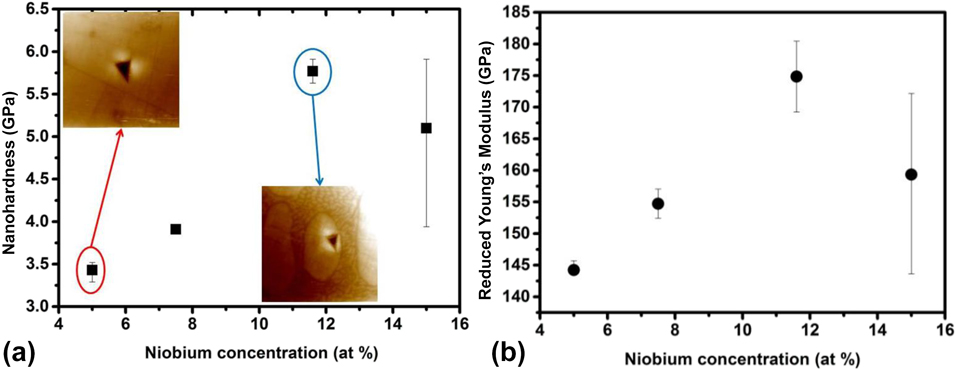
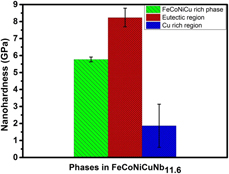
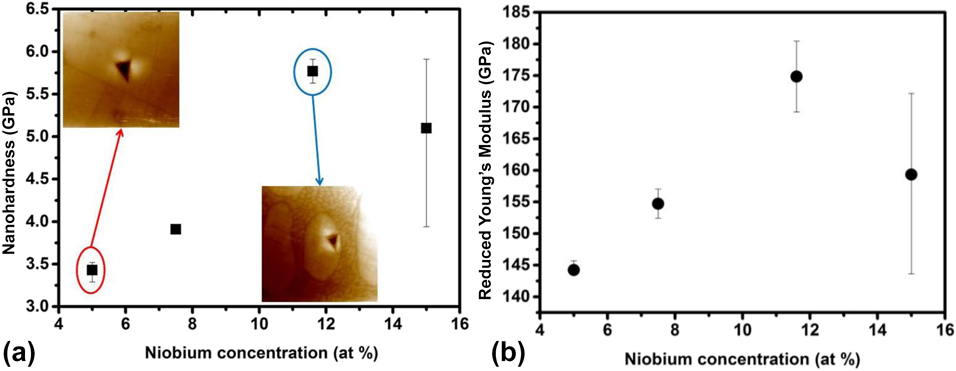
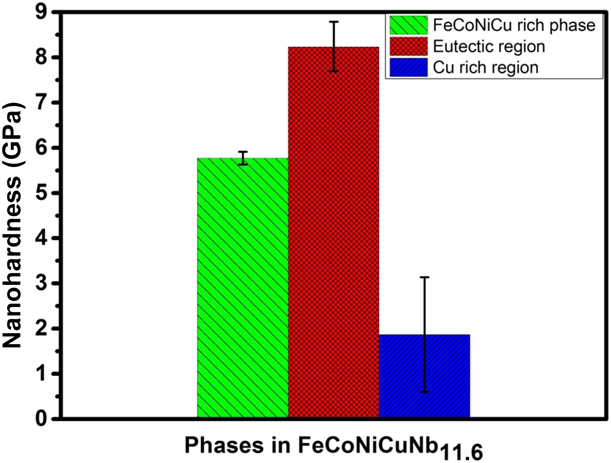
Figure 6 shows the variation in nanohardness and reduced Young’s modulus with respect to the Nb addition. The nanoindentation has been carried out in the FeCoNiCu-rich phase (α1), which shows an increase in nanohardness and Young’s modulus up to 11.6 at.% of Nb and then decreases at 15 at.% Nb. This may be attributed to the solid solution strengthening effect of Nb on FeCoNiCu-rich phase (α1), and at 15 at.%, most of the Nb is partitioning in the Laves phase. The nanoindentation on the individual phases has been taken for FeCoNiCuNb11.6 alloy (Fig. 7). This alloy shows fine-scale eutectic microstructure less than 200 nm interlamellar spacing. The indentation results show that the eutectic region will contribute to hardness more than the other phases. The FCC phase has hardness less than eutectic region, but it can provide adequate ductility. The Cu-rich region shows less hardness than other phases. The composite microstructure consisting of harder eutectic and softer dendritic phase will provide a good combination of strength and ductility in the material.
(a) Nanohardness variation of FeCoNiCu-rich phase and (b) reduced Young’s modulus variation of FeCoNiCu-rich phase.
Individual phase hardness of FeCoNiCuNb11.6 HEA.
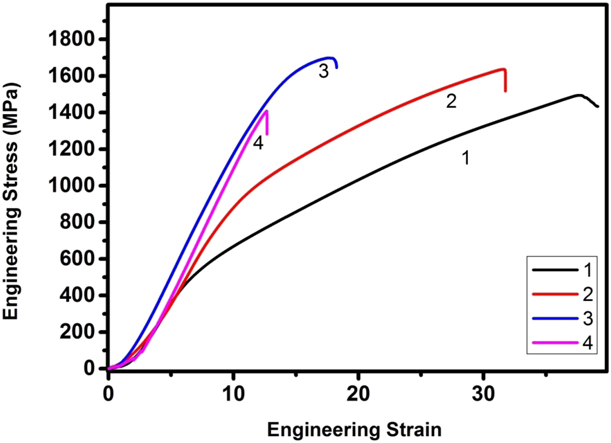
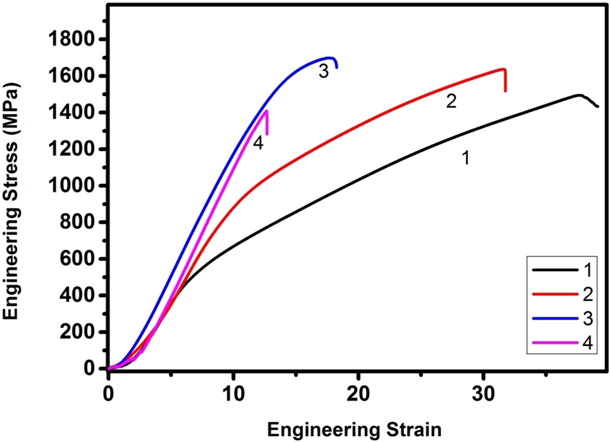
The room temperature compressive engineering stress–strain curve is shown in Fig. 8. The alloy with fine-scale eutectic (FeCoNiCuNb11.6) shows high compressive strength (>1700 MPa) and ductility more than 17%. The presence of Cu-rich phase decreases the strength of the alloy compared with the reported eutectic alloys with FCC and Laves phase. From the compressive data, it is found that increase in Nb content causes increase in strength with a reasonable ductility up to 11.6 at.%. Further increase in Nb causes reduction in ductility as well as strength, which can be explained by phase formation and unique microstructural features during solidification. The hypereutectic alloy predominantly consists of Laves phase, which causes a detrimental effect in the compressive strength. The strength increase can be attributed to the decrease in the interlamellar spacing, which can be correlated with the Hall–Petch-type relationship between the yield strength and interlamellar spacing. In case of FeCoNiCuNb5 alloy, the sample did not break during the compression test but was sheared in a way that led to gradual reduction in strength after the maximum compressive strength. The other alloys experienced breakage after the maximum strength and were used for fracture studies.
Room temperature engineering compressive stress–strain curve for (1) FeCoNiCuNb5, (2) FeCoNiCuNb7.5, (3) FeCoNiCuNb11.6, and (4) FeCoNiCuNb15.
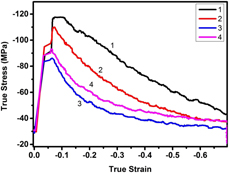
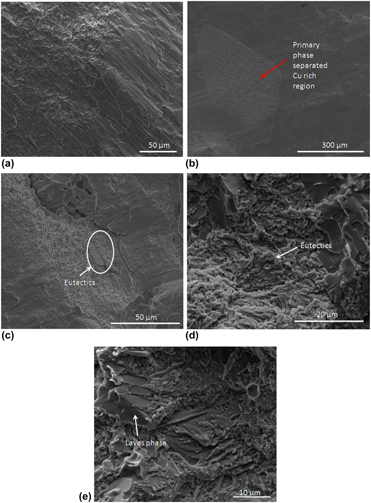
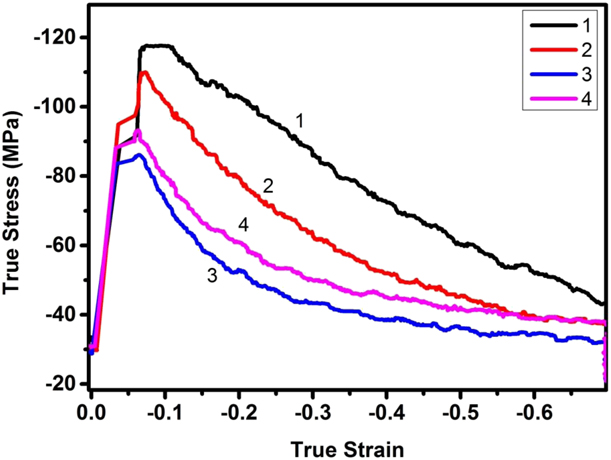
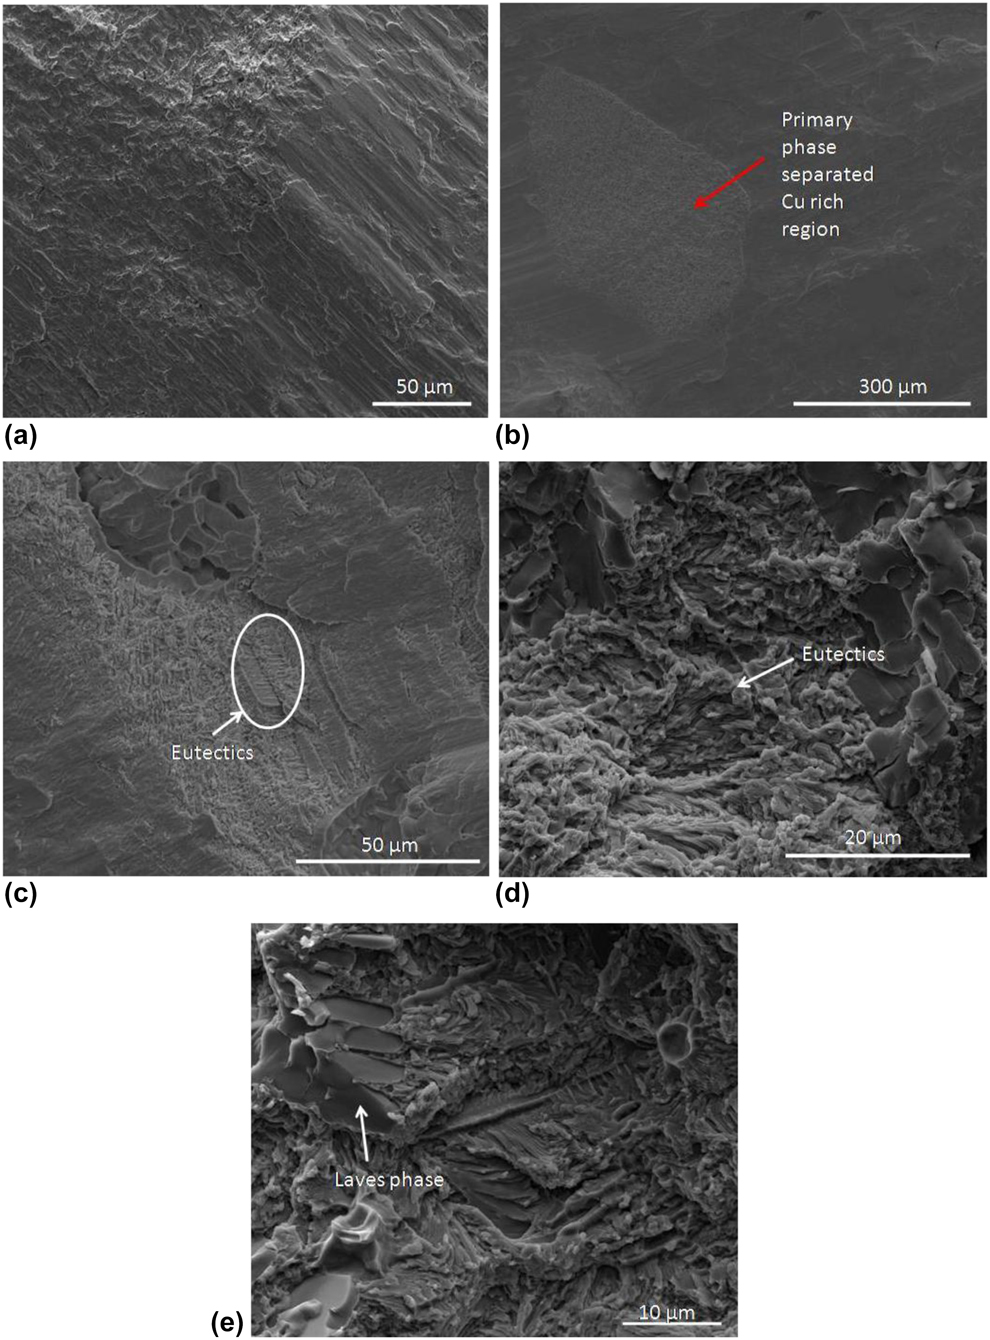
Recently, processing maps have been developed for HEAs to determine their high-temperature deformation behavior [Reference Samal, Rahul, Kottada and Phanikumar24, Reference Rahul, Samal, Venugopal and Phanikumar27]. The processing maps for eutectic HEAs will make their applicability and help optimize the processing conditions. Understanding the high-temperature deformation behavior of the EHEAs will help identify the flow behavior and applicability of the alloy. The flow behavior of the sample at 1000 °C at a true strain rate of 0.001 s−1 with a true strain of 0.7 is shown in the Fig. 9. The strength shown is comparable to that of the previously reported EHEAs. The flow characteristics are similar to those of eutectic alloys, where strength increases to a maximum value and then decreases to low flow stress condition. It is found that when Nb content increases, the flow stress decreases for a constant strain, which may be attributed to the softening of eutectic region. This can be confirmed from the flow characteristics of FeCoNiCuNb11.6, where eutectic fraction was more than other phases. Fracture surface characteristics of FeCoNiCuNbx (x = 7.5, 11.6, 15) are shown in Fig. 10. The fractography of FeCoNiCuNb7.5 alloy shows riverbed pattern, indicating brittle-type fracture. In case of FeCoNiCuNb11.6 and FeCoNiCuNb15 alloys, the fracture surface consisting of eutectic region and the Cu-rich region shows the mixture of facet-like morphology and dimples in the microstructure. The hard and brittle Laves phase will act as a crack initiation site and reduces the ductility of the alloy, revealing brittle mode of fracture. The ductile Cu-rich region could act as a barrier for crack propagation. Thus, HEAs with 11.6 and 15 at.% Nb revealed mixed (i.e., both ductile and brittle) mode of fracture.
True stress–strain curve of the sample deformed at 1000 °C at a strain rate of 0.001 s−1, where (1) FeCoNiCuNb5, (2) FeCoNiCuNb7.5, (3) FeCoNiCuNb11.6, and (4) FeCoNiCuNb15.
Fracture surface SEM images of compressed sample at room temperature: (a) FeCoNiCuNb7.5, (b & c) FeCoNiCuNb11.6, and (d & e) FeCoNiCuNb15.
Conclusion
The effect of Nb addition on phase formation and solidification behavior in FeCoNiCu alloy has been studied. The variation in solidification pathway has been obtained in hyper- and hypoeutectic HEAs. Strong influence of Nb concentration on liquid phase separation is observed. The new pseudo quasi-peritectic reactions, i.e., L + FeCoNiCu-rich phase (α1) → Cu-rich phase (α2) + (Fe, Co)2Nb-type Laves phase at 5, 7.5, 11.6 at.% Nb, and L + Cu-rich phase (α2) → FeCoNiCu-rich phase (α1)+ (Fe, Co)2Nb-type Laves phase at 15 at.% Nb, have been proposed for the studied HEAs. The nanoindentation results show improvement in the hardness of FeCoNiCu-rich phase (α1), which is attributed to the solid solution strengthening of Nb. Increase in room temperature compressive strength is due to the decrease in interlamellar spacing of eutectic region. High-temperature deformation behavior shows the flow stress was similar to that of the reported EHEAs.
Experimental methods
All the alloys were prepared with elements of high purity (>99.9%) by using vacuum arc melting process. High vacuum was built in the melting chamber and purged with Argon gas for melting. The melting was carried out using the arc struck by a non-consumable tungsten electrode. The homogeneous samples were obtained by flipping the alloy button and remelting 6 times. To evaluate the mechanical properties, the arc-melted button was suction cast into cylindrical rod (ϕ = 6 mm diameter). The suction-cast sample was cut into the desired dimensions with an aspect ratio of 1.5:1. The hot deformation was carried out in Gleeble 3800® thermomechanical simulator (Dynamic Systems Inc, New York City, NY) at a deformation temperature of 1000 °C (1273 K) with constant strain rate of 0.001 s−1 at a true strain of 0.7. To avoid the barreling and frictional effects, the high-temperature lubricant (Ni paste and graphite foil) was used between the sample and anvil surface. The temperature of the sample was controlled and monitored by spot welding a K-type thermocouple on the surface of the sample. The in situ image of the indented phase was captured using Scanning Probe Microscopy (SPM) imaging. The room temperature test was carried out using Zwick machine with a strain rate of 0.001 s−1. Nanoindentation test was carried out on the selected sample using Hysitron® machine (Bruker, Eden Prairie, Minnesota), and indentation was performed in different phases at the load of 5000 µN with a trapezoidal load function. The structural characterization was carried out using XRD (PANalytical X’pert pro® instrument; Malvern Panalytical Ltd., Royston, United Kingdom) with Cu Kα (λ = 0.154056 nm) radiation, operating at 45 kV and 30 mA, with step size of 2θ = 0.017°. For microstructural characterization, the samples were polished using coarse and fine emery paper and the final polishing was carried out using alumina slurry. The polished samples were characterized using the BSE image mode in Quanta 400® SEM (ThermoFisher Scientific, Hillsboro, Oregon) equipped with EDS detector (Bruker, Billerica, Massachusetts). Fractography was carried out on the room temperature compressed sample using SEM with scanning electron mode.