Introduction
Several studies have indicated that a dynamic alteration in transcriptional activity and gene expression regulation occurs during oogenesis and early development. A growing mouse oocyte transcribes many specific genes, e.g. zp3 and dnmt10 (Doherty et al., Reference Doherty, Bartolomei and Schultz2002; Howell et al., Reference Howell, Bestor, Ding, Latham, Mertineit, Trasler and Chaillet2001; Soyal et al., Reference Soyal, Amleh and Dean2000). However, when the oocyte is almost full sized, transcription stops via an unknown mechanism and a transcriptionally inert state is maintained during meiosis. Fertilization triggers the completion of meiosis and the initiation of transcription by the zygotic genome in 1-cell embryos. In the male pronucleus (PN), the chromatin structure is not repressed, which allows enhancer-independent transcription from a microinjected reporter gene (Majumder et al., Reference Majumder, Miranda and DePamphilis1993). Transcriptional regulation is altered markedly during the 2-cell stage. In embryos at the late 2-cell stage, promoter activity is repressed and an enhancer is necessary for transcription. A TATA-less promoter is utilized at this stage, but not in growing oocytes (Nothias et al., Reference Nothias, Majumder, Kaneko and DePamphilis1995). At the blastocyst stage, the TATA-less promoter becomes more active. These dramatic changes in transcriptional regulation imply a global shift in the gene expression profile (Hamatani et al., Reference Hamatani, Carter, Sharov and Ko2004; Wang et al., Reference Wang, Piotrowska, Ciemerych, Milenkovic, Scott, Davis and Zernicka-Goetz2004), which is probably regulated by alterations in epigenetic factors, such as transcription factors (TFs).
Although general transcription factors such as Sp1 and TBP are expressed ubiquitously and play basic roles in transcription, most other TFs are expressed and active in specific types of cells at a specific stage during proliferation and differentiation. For example, the cAMP response-element modulator is expressed in the testis and is essential for inducing the expression of testis-specific genes (Kotaja et al., Reference Kotaja, De Cesare, Macho, Monaco, Brancorsini, Goossens, Tournaye, Gansmuller and Sassone-Corsi2004; Krausz & Sassone-Corsi, Reference Krausz and Sassone-Corsi2005). Furthermore, recent studies have revealed that some transcription factors are sufficient to create specific cell characteristics, e.g. HES in neurocytes, Oct3/4 in germ cells and MyoD in muscular cells (Brand-Saberi, Reference Brand-Saberi2005; Johnson et al., Reference Johnson, Canning, Kaneko, Pru and Tilly2004; Kageyama et al., Reference Kageyama, Ohtsuka, Hatakeyama and Ohsawa2005; Nichols et al., Reference Nichols, Zevnik, Anastassiadis, Niwa, Klewe-Nebenius, Chambers, Scholer and Smith1998; Tanaka et al., Reference Tanaka, Kunath, Kimber, Jaradat, Stagg, Usuda, Yokota, Niwa, Rossant and Ko2002). Our objective was to determine which transcription factors are expressed and responsible for specific cell characteristics at each stage of oogenesis and preimplantation development. Such knowledge about the expression of specific TFs would be useful in understanding gene expression regulation during oogenesis and preimplantation development. However, the global alteration of TF expression patterns during these stages has not been investigated, although the alteration of limited numbers of TFs, e.g. TBP and Sp1, has been reported during oogenesis and preimplantation development (Kaneko et al., Reference Kaneko, Cullinan, Latham and DePamphilis1997; Reeves, Reference Reeves2000; Wang and Latham, Reference Wang and Latham2000; Worrad et al., Reference Worrad, Ram and Schultz1994). Furthermore, although genomewide microarray analyses have been conducted on oocytes (Pan et al., Reference Pan, O'Brien, Wigglesworth, Eppig and Schultz2005) and preimplantation embryos (Hamatani et al., Reference Hamatani, Carter, Sharov and Ko2004; Wang et al., Reference Wang, Piotrowska, Ciemerych, Milenkovic, Scott, Davis and Zernicka-Goetz2004; Zeng et al., Reference Zeng, Baldwin and Schultz2004), these analyses were performed separately for oocytes and embryos and did not compare the genes expression levels between them.
In the present study, to better understand the mechanisms that regulate the alteration of transcriptional regulation from the differentiated oocyte to the totipotent embryo stages, we conducted a genomewide analysis of TFs using a TF-specific microarray.
Materials and Methods
Collection and culture of oocytes and embryos
Growing oocytes were collected from the ovaries of 13-day-old female BDF1 mice (SLC, Shizuoka, Japan). One ovary was placed in a 200 μl drop of PBS and transferred to 0.5% trypsin–EDTA (Gibco–BRL). It was incubated at 38 °C with agitation. After 10 min, the ovary was washed with Whitten's medium (Whitten, Reference Whitten1971) and oocytes 45–50 μm in diameter were collected.
Fully grown oocytes were collected from 3-week-old BDF1 mice in Whitten's medium, as described previously (Choi et al., Reference Choi, Aoki, Mori, Yamashita, Nagahama and Kohmoto1991).
Unfertilized oocytes were collected in Whitten's medium from 3-week-old BDF1 mice that had been superovulated by injection with 5 IU of human chorionic gonadotropin (hCG; Sankyo, Tokyo, Japan), following 5 IU injection of serum gonadotropin from pregnant mares (PMSG; Sankyo), as described previously (Choi et al., Reference Choi, Aoki, Mori, Yamashita, Nagahama and Kohmoto1991). Sperm were collected into Whitten's medium from the cauda epididymis of mature male ICR mice (SLC). The oocytes were inseminated with sperm that had been incubated 2 h at 38 °C. The embryos were washed with KSOM 3 h after insemination and then cultured in a humidified 5% CO2/95% air atmosphere at 38 °C.
Real-time fluorescence-monitored RT-PCR
The total RNA was isolated from the unfertilized oocytes and embryos using ISOGEN (Nippon Gene) and reverse transcribed in a 20 μl reaction mixture containing 5 U ReverScript II™ (Wako) and 0.5 μg of oligo(dT)12–18 primer (Invitrogen) at 42 °C for 1 h and 51 °C for 30 min. The template mRNA was digested with 60 U of RNase H (TaKaRa) at 37 °C for 20 min.
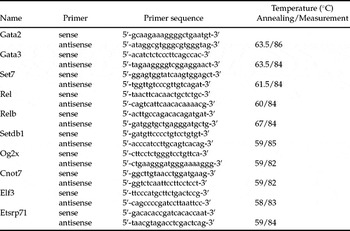
Real-time PCR was performed using the Smart Cycler System (TaKaRa), as described previously (Kageyama, Reference Kageyama, Nagata and Aoki2004). Table 1 lists the sequence of primers and conditions.
Details of condition for PCR

Preparation of cDNA samples for microarray analysis
The total RNA was isolated from 200 each of 1-cell, 2-cell and blastocyst-stage embryos, which were collected 10, 30 and 92 h after insemination, respectively, and 13-day-old growing oocytes. The RNA samples were purified using a Nucleospin RNA II Kit (Becton Dickinson) following the manufacturer's protocols and were reverse transcribed using a Super SMART PCR cDNA Synthesis Kit (Becton Dickinson).
The synthesized cDNA samples were amplified by PCR following the protocols of the Super SMART PCR cDNA Synthesis Kit (Becton Dickinson). The amplified cDNA samples were purified using a NucleoSpin Extraction Kit (Becton Dickinson) and then used as the cDNA template for oligo microarray hybridization.
Oligo microarray hybridization
The oligo DNA for 898 TF genes was spotted on a microarray (Gunji et al., Reference Gunji, Kai, Sameshima, Iizuka, Katagi, Utsugi, Fujimori and Murakami2004). The cDNA sample was divided into two portions and labelled with cyanine 3 (Cy3) or cyanine 5 (Cy5). To control the difference in the fluorescence detection sensitivity of the two dyes, double microarray assays, in which the dyes were swapped in a single comparison, were performed. The averaged values of these double microarray assays were used for analysis. These experiments were performed twice, using independent cDNA samples in each comparison.
All treatments were performed at room temperature, unless otherwise specified. During prehybridization, the oligo microarray was incubated in a prehybridization buffer containing 5× SSC, 0.1% SDS and 0.1% BSA at 42 °C for 1 h. The hybridization was performed at 42 °C for 17 h in a hybridization solution, consisting of Cy3- and Cy5-labelled cDNA, 15% formamide, 5× SSC, 0.75 M NaCl, 75 mM sodium citrate, 0.5% SDS and 20 μg/μl acetylated BSA (Invitrogen). Following hybridization, the oligo microarray was washed once in 2× SSC/0.1% SDS solution at 42 °C for 5 min and once in 0.1× SSC/0.1% SDS solution for 10 min. The oligo microarray was then washed twice in 0.1× SSC solution for 2 min using a Wash Station (TeleChem). After washing, the oligo microarray was dried by centrifugation. Hybridization images were obtained by using a ScanArray Express (Perkin–Elmer) fluorescence laser scanner.
Microarray analysis
The fluorescence intensities in the oligo microarray were quantified using QuantArray 3.0 software (Perkin–Elmer). In each array, genes with expression levels less than those of the negative control spots for either of the two dyes were removed. The signal intensity data were imported into GeneSpring 6.0 (Silicon Genetics). The ratios of the signal intensities between the two cell types were calculated using Lowess normalization.
Results and Discussion
Validation of expression patterns in microarray data
A microarray analysis was performed to investigate the changes in TF expression profiles during oogenesis and preimplantation development. Growing oocytes 13 days after parturition (GO) and embryos at the 1-cell (1C), 2-cell (2C) and blastocyst (Bl) stages were analysed using a microarray of long oligonucleotides with the TF sequences.
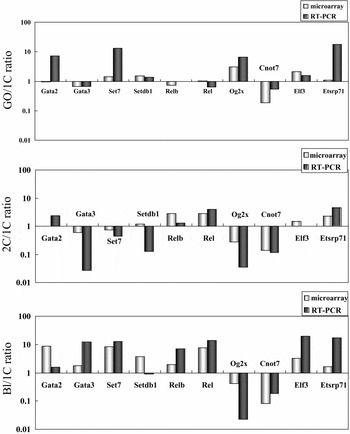
Before analyzing the changes in the expression profiles, we confirmed the differences in expression levels that were detected using the oligoarray. Ten genes whose signal intensities in the array showed marked differences between the stages of development were selected. A real-time polymerase chain reaction (RT-PCR) was performed on these genes and the results were compared to those from the microarray analysis (Fig. 1). The increase and decrease in expression levels were consistent in 24 of 30 (80%) comparisons. Furthermore, of signal intensities in the microarray that showed more than a two-fold difference, 14 of 15 (93.3%) comparisons were consistent. This comparison validated the integrity of our microarray data for analyzing changes in gene expression profiles.
Comparison of microarray and RT-PCR results. RT-PCR was conducted to examine the expression levels of 10 genes (Gata2, Gata3, Set7, Setdb1, Relb, Rel, Og2x, Cnot7, Elf3 and Etsrp71) in growing oocytes (GO) and embryos at the 1-cell (1C), 2-cell (2C) and blastocyst (Bl) stages. The expression level ratios among these stages (GO/1C, 2C/1C and Bl/1C) validated the results of the microarray.

In our analysis, we used a TF-specific DNA chip. Using a DNA chip composed of the same functional TF genes appeared to contribute to the integrity of the analysis. Previous studies on the alteration of gene expression during preimplantation development used DNA chips that included a large number of mouse genes (Hamatani et al., Reference Hamatani, Carter, Sharov and Ko2004; Wang et al., Reference Wang, Piotrowska, Ciemerych, Milenkovic, Scott, Davis and Zernicka-Goetz2004; Zeng et al., Reference Zeng, Baldwin and Schultz2004). Because of the limited detection range, an accurate measurement of the expression levels of genes that vary markedly would be difficult to achieve with a DNA chip prepared for a wide variety of genes. A DNA chip prepared for the same functional genes allows a more accurate quantification, as the gene expression levels do not differ much.
Global outlook based on a pairwise comparison
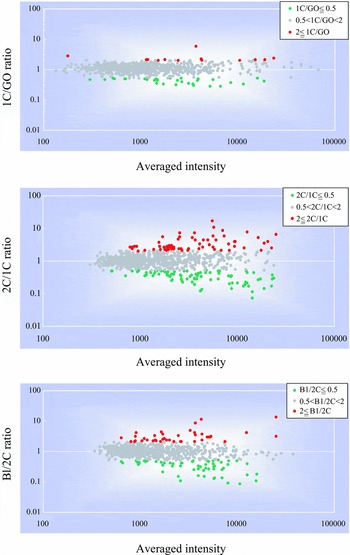
To gain an overview the global changes in TF expression levels during oogenesis and preimplantation development, we performed pairwise comparisons of GO vs. 1C, 1C vs. 2C and 2C vs. Bl (Fig. 2). Of the three comparisons, TFs in the GO vs. 1C comparison showed the fewest significant differences in expression levels. From GO to 1C, only 13 genes (1.4%) increased more than two-fold, while 35 genes (3.9%) decreased by more than half. The largest difference was observed in the 1C vs. 2C comparison: 67 genes (7.5%) increased more than two-fold and 86 genes (9.6%) decreased by more than half. From 2C to Bl, 43 genes (4.8%) increased and 59 (6.6%) decreased.
Changes in the expression profile of transcription factors during oogenesis and preimplantation development. A microarray was used to examine the expression levels of transcription factors in growing oocytes (GO) and embryos at the 1-cell (1C), 2-cell (2C) and blastocyst (Bl) stages. The ratios (vertical axis) and averages (horizontal axis) of the signal intensities for each transcription factor between GO and 1C (1C/GO), 1C and 2C (2C/1C) and 2C and Bl (Bl/2C) were plotted. Red, green, and grey spots represent transcription factors that showed ratios of ≥2, ≤0.5 and 0.5–2, respectively.

We did not expect the GO to 1C change to be the smallest. As GO is a differentiated gamete and 1C is a totipotent zygote, gene expression regulation in each was expected to be very different. Thus, we hypothesized a large difference in the profiles of TFs expressed in GO and 1C. A possible explanation for the small change is that transcriptional activity begins to decrease in oocytes about 15 days after parturition and it is still low after ZGA occurs during the postfertilization 1-cell stage (Aoki et al., Reference Aoki, Worrad and Schultz1997; Worrad et al., Reference Worrad, Ram and Schultz1994). Therefore, the transcripts encoding the TFs required for ZGA have already accumulated in GO (Schultz, Reference Schultz1993). Some transcripts required for preimplantation development, but not for oogenesis, would not be translated before fertilization. Translation would begin after fertilization via a mechanism involving posttranscriptional modification (Zohreh et al., 2005). Several transcripts have been shown to undergo translation after fertilization (Fuchimoto et al., Reference Fuchimoto, Mizukoshi, Schultz, Sakai and Aoki2001; Oh et al., Reference Oh, Hwang, McLaughlin, Solter and Knowles2000; Sakurai et al., Reference Sakurai, Sato and Kimura2005). Since the level of transcription is still low in 1C, an extensive alteration of TFs may not be required. Alternatively, a dramatic alteration of epigenetic factors other than TFs, e.g. histone and DNA methylation, may alter the gene expression pattern during oocyte growth, meiotic maturation, or fertilization.
From 1C to 2C, a large number of TFs changed their expression levels, although the time span between 1C and 2C was shorter (1 day) than between GO and 1C (more than 9 days) and 2C and Bl (3 days). Combined with the small change between GO and 1C, an abrupt change in TF profiles seems to occur during the period between 1C and 2C, which alters transcriptional regulation from differentiated germ cells to totipotent embryos. Gene expression regulation changes markedly between 1C and 2C. The regulation of gene expression changes from an enhancer-independent manner in 1C to an enhancer-dependent manner after cleavage to 2C (Majumder et al., Reference Majumder, Miranda and DePamphilis1993). In addition, many genes that are not expressed in the oocyte are transcribed in 2C (Hamatani et al., Reference Hamatani, Carter, Sharov and Ko2004; Wang et al., Reference Wang, Piotrowska, Ciemerych, Milenkovic, Scott, Davis and Zernicka-Goetz2004). The extensive alteration in TF expression patterns would contribute to these changes.
The dynamics of basic transcription factors
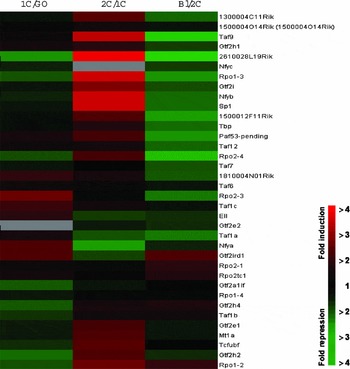
In our analysis of expression profiles, we first divided TFs into two categories: basic TFs and specific TFs. Basic TFs include those that play a basic role in transcription. As reviewed in Woychik & Hampsey (Reference Woychik and Hampsey2002), RNA polymerases, general TFs and general TF complex elements are essential for initiating transcription. NFY, Sp1 and TBP, which are the constitutive TFs, recognize, respectively, the CAAT box, SP1 and TATA box, which act as general promoters in mammalian cells (FitzGerald et al., Reference FitzGerald, Shlyakhtenko, Mir and Vinson2004). Of these TF types, 37 TFs were classified as basic (Fig. 3). The others were categorized as specific TFs, which are co-activators and co-repressors that bind to specific DNA sequences in gene promoters and enhancers and to other TFs to recruit the basal transcription machinery to the promoter.
Dynamics of basic transcription factors during oogenesis and preimplantation development. A microarray was used to examine the expression levels of the transcription factors in growing oocytes (GO) and embryos at the 1-cell (1C), 2-cell (2C) and blastocyst (Bl) stages. The ratios of the signal intensities for the basic transcription factors between GO and 1C (1C/GO), 1C and 2C (2C/1C) and 2C and Bl (Bl/2C) were determined. For the relative expression levels, red and green represent high and low expression ratios, respectively.

Our analysis revealed that most basic TFs increased from the 1C to 2C stage and decreased from 2C to Bl (Fig. 3). Of 37 basic TFs, 10 showed more than a two-fold increase from 1C to 2C, but none did from 2C to Bl. One decreased from 1C to 2C and 15 from 2C to Bl. From 1C to 2C, we found that the RNA polymerase I and II subunits and NFY-b increased markedly, as did Sp1, which had been reported to increase at this stage (Worrad et al., Reference Worrad, Ram and Schultz1994). From 2C to Bl, a decrease in various RNA polymerases, general TFs and some constitutive TFs, such as Sp1 and NFY-b, was observed.
The utilization of RNA polymerases changes during oogenesis and preimplantation development [19]. Although RNA polymerases I, II and III all mediate transcription in GO, only RNA polymerase II mediates transcription in 1C and early 2C after fertilization. The transcription mediated by RNA polymerases I and III starts at the late 2C stage. We found that the expression of most RNA polymerase I subunits decreased from GO to 1C and then increased after 2C, which suggests that the dynamic alteration of RNA polymerase utilization is regulated by changes in the expression of the RNA polymerases themselves (Fig. 3).
Dynamics of specific transcription factors classified by structure
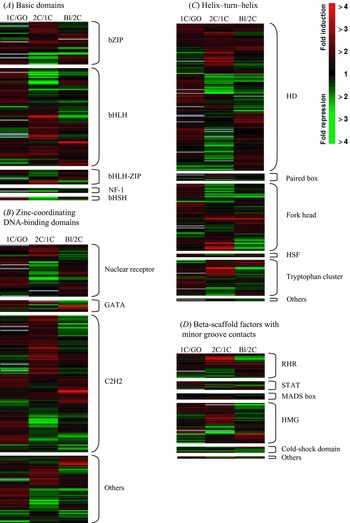
As described in the TF database TRANSFAC® 6.0 (http://www.gene-regulation.com/), specific TFs are further classified by structure into four superclasses: those with basic domains, zinc-coordinating DNA-binding domains, helix–turn–helix and beta-scaffold factors with minor groove contacts, plus other TF types. Each superclass has several families and subfamilies, in which each member has a common motif targeting similar DNA sequences on promoters or enhancers. During oogenesis and preimplantation development, promoter and enhancer utilization is altered dynamically. Therefore, we expected the expression level of a set of TFs in a given family to change simultaneously during these periods. However, no such change was observed (Fig. 4), except in the few families described below.
Dynamics of transcription factors with specific structures during oogenesis and preimplantation development. A microarray was used to examine the expression levels of the transcription factors in growing oocytes (GO) and embryos at the 1-cell (1C), 2-cell (2C) and blastocyst (Bl) stages. Specific transcription factors were classified according to their structure, as described in Results and Discussion, into basic domains (A), zinc-coordinating DNA-binding domains (B), helix–turn–helix (C) and beta-scaffold factors with minor groove contacts (D). The ratios of the signal intensities for these specific transcription factors between GO and 1C (1C/GO), 1C and 2C (2C/1C) and 2C and Bl (Bl/2C) were determined. For the relative expression levels, red and green represent the high and low ratios of expression, respectively.

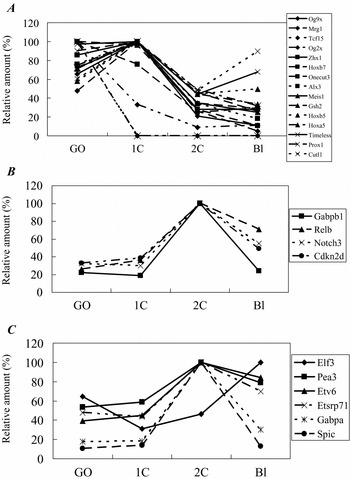
Several genes containing only homeo motif domains were expressed at a high level in GO or 1C, then decreased at 2C and remained at a low level in Bl (Fig. 5A). The homeodomain, first identified in a number of Drosophila homeotic and segmentation proteins, is now known to be conserved in many other animals, including vertebrates (Alonso, Reference Alonso2002; Gehring, Reference Gehring1992; Scott et al., Reference Scott, Tamkun and Hartzell1989). Several studies have revealed variations in its cell differentiation and carcinogenesis functions. Interestingly, a recent study has shown that Nobox (newborn ovary homeobox encoding gene) is essential for transcribing oocyte-specific genes, such as c-mos and Gdf9 in GO (Rajkovic et al., Reference Rajkovic, Pangas, Ballow, Suzumori and Matzuk2004). Thus, other homeodomain-containing genes, which are preferentially expressed in GO or 1C, also play important roles in regulating stage-specific gene expression at these stages.
Expression patterns of the specific transcription factors with specific motifs in the oocytes and preimplantation embryos. A microarray was used to examine the expression levels of these transcription factors in growing oocytes (GO) and embryos at the 1-cell (1C), 2-cell (2C) and blastocyst (Bl) stages. The expression patterns of the specific transcription factors containing the homeodomain-only motif (HD-only motif: (A) Rel homology region (RHR; B) and Ets domain (C) are shown. The peak expression level is set at 100% and expression levels at other stages are expressed relative to this value.

Several genes containing the Rel homology region (RHR) and Ets domains, which are involved in regulating cell proliferation, were expressed at a high level in 2C and Bl (Fig. 5B and 5C). Their expression levels were relatively low until 1C and then increased abruptly in 2C. The TFs containing RHR act downstream from various cytokines and play important roles in cell growth (Algul et al., Reference Algul, Tando, Schneider, Weidenbach, Adler and Schmid2002; Kabrun and Enrietto, Reference Kabrun and Enrietto1994; La Salle et al., Reference La Salle, Mertineit, Taketo, Moens, Bestor and Trasler2004; Yu et al., Reference Yu, Chiang, Shih and Wu2004), while Ets family TFs, which are associated with growth control, cell differentiation, apoptosis and other biological processes, are primarily downstream nuclear targets of the Ras–MAP kinase signalling pathway, which mediates cytokines (Oikawa, Reference Oikawa2004; Oikawa and Yamada, Reference Oikawa and Yamada2003; Wasylyk et al., Reference Wasylyk, Hahn and Giovane1993). Therefore, the increase in 2C in members of these two families suggests that the signalling pathways mediating cytokines are activated and cytokine-dependent growth control starts after the 2-cell stage.
Ets family members also activate TATA-less promoters (Block et al., Reference Block, Shou and Poncz1996a, Reference Block, Shou, Thorton and Ponczb). Several reports have shown that TATA-less promoter activity increases from 2C to Bl (Davis et al., Reference Davis, De Sousa and Schultz1996; Nothias et al., Reference Nothias, Majumder, Kaneko and DePamphilis1995). Therefore, the increase in Ets family member expression may contribute to this increase in TATA-less promoter activity. Although the biological relevance of high TATA-less promoter activity at these stages is not clear, this type of promoter is known to localize frequently on housekeeping genes. An increased expression of housekeeping genes may be required to sustain rapid cleavage during preimplantation development.
Expression of oncogene-related TFs
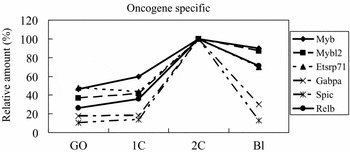
After analysing TF dynamics, we found that the expression of several specific TFs, which have been reported to be related to cancer, markedly increased at the 2-cell stage (Fig. 6). These TFs were Etsrp71, Gabpa and Spic, which belong to the Ets family; Rel, which belongs to NF-κB/c-Rel; and Myb and Myb12, which belong to the Myb family. Ets family TFs are downstream nuclear targets of Ras–MAP kinase signalling and their deregulation results in the malignant transformation of cells (Oikawa, Reference Oikawa2004; Oikawa and Yamada, Reference Oikawa and Yamada2003; Zhou and Ouyang, Reference Zhou and Ouyang2003). Furthermore, among cancer-specific characteristics of other epigenetic modifications that have been found in early embryos is a decrease in the DNA methylation level during preimplantation development (Howlett and Reik, Reference Howlett and Reik1991; Kafri et al., Reference Kafri, Ariel, Brandeis, Shemer, Urven, McCarrey, Cedar and Razin1992; Monk et al., Reference Monk, Boubelik and Lehnert1987; Santos et al., Reference Santos, Hendrich, Reik and Dean2002). This low methylation state is also characteristic of cancer cells (Das and Singal, Reference Das and Singal2004; Ehrlich, Reference Ehrlich2002; Szyf et al., Reference Szyf, Pakneshan and Rabbani2004). The characteristics of preimplantation embryos are comparable to cancer cells in their growth modality. The embryos can grow without serum, preserve an undifferentiated state and lack some cell cycle checkpoints (Iwamori et al., Reference Iwamori, Naito, Sugiura and Tojo2002; Telford et al., Reference Telford, Hogan, Franz and Schultz1990). Interestingly, several epigenetic factors involved in cancerous cell growth changed greatly after fertilization. After fertilization and until 2C, embryos begin zygotic transcription and establish the chromatin structure required for regulated gene expression to maintain totipotency (Nothias et al., Reference Nothias, Majumder, Kaneko and DePamphilis1995; Schultz, Reference Schultz1993). Therefore, the high expression levels of cancer-related TFs suggest that they play important roles in cell growth and are involved in maintaining the zygote in a totipotent state during preimplantation development.
Dynamics of oncogene-specific transcription factors during oogenesis and preimplantation development. A microarray was used to examine the expression levels of the transcription factors in growing oocytes (GO) and embryos at the 1-cell (1C), 2-cell (2C) and blastocyst (Bl) stages. The expression patterns of the oncogene-specific transcription factors myb, myb12, Etsrp71, Gabpa, Spic and Relb are shown. The peak expression level is set at 100% and expression levels at other stages are expressed relative to this value.

In summary, we determined the expression patterns of TFs during oogenesis and preimplantation development. Our global analysis of TFs revealed that TF expression patterns altered greatly between the 1-cell and 2-cell stages and that the least change occurred between the GO and 1C stages. Furthermore, several TF groups or families, such as GTFs, Ets, HD, Rel and oncogene-specific TFs, were highly expressed at specific stages. These results suggest that these TF dynamics directly regulate the change in transcriptional regulation during oogenesis and preimplantation development and are necessary to create a new organism from the single cell oocyte.