I. INTRODUCTION
Recent studies indicated that the I–III–VI quaternary alloy system comprising CuIn(SxSe1-x)2 presents important opportunities to design thin film solar cells with high efficiency.Reference Nagoya, Kushiya, Tachiyuki and Yamase1, Reference Alberts2 This is made possible by a systematic increase in the bandgap of the compound semiconductor from ∼1.0 to 1.45 eV with variations in the sulfur concentration.Reference Wang, Cheng, Hu, Wang, Wan, Wu and Du3 The homogeneous incorporation of sulfur into the chalcopyrite lattice is complex and largely depends on the growth conditions used. To date, the most successful method to prepare such films is based on a single-step technique in which all the elements (Cu, In, Se, and S) are coevaporated from individual sources.Reference Nishiwaki, Hanket and Shafarman4 However, two-step processing of chalcopyrite thin films is a relatively easy method to produce uniform coatings of thin films on large-area substrates.Reference Zaretskaya, Gremenok, Zalesski, Bente, Schorr and Zukotynski5 The advantage of two-step methods arises from the fact that they utilize various deposition techniques (sputtering,Reference Sheppard, Alberts and Botha6 electro deposition,Reference Izquierdo-Roca, Fontane, Calvo-Barrio, Perez-Rodriguez, Morante, Alvarez-Garcia, Duault, Parissi and Bermudez7 chemical spray pyrolysis,Reference Shirakata, Terasako and Kariya8 solution growth techniqueReference Chavhan and Sharma9 and so on) in the precursor step. During the second step, the precursors are exposed either to elemental Se vapor in vacuum or to H2Se/Ar gas at atmospheric pressure and then sulfurized in H2S/Ar ambient. A significant problem related to the traditional two-step process is the separation of CuInSe2 and CuInS2 phases due to the inherent reaction kinetics. A direct consequence of the inhomogeneous distribution of the elements is the formation of a nonuniform bandgap through the absorber thickness. In these so-called graded bandgap structures, spatial variations in the S/(Se + S) ratios ultimately alter the lattice parameters a and c of the chalcopyrite unit cells. In the case of extreme grading, substantial changes in the lattice parameters with film depth would result in lattice mismatches of up to 8% in the absorber layers. This in turn introduces structural defects into the absorber films and hence space charge region of the solar cells, which limits the performance of the photovoltaic devices.Reference Alberts10 To solve this problem, we use a new two-step growth method to prepare single-phase CuIn(SxSe1-x)2 thin films. In this article, partly selenized CuInSe2 thin films were prepared by the reaction of sputtered Cu–In metallic precursor in selenium atmosphere instead of toxic H2Se, and then the CuInSe2 thin films were sulfurized in H2S/Ar to prepare single-phase CuIn(SxSe1-x)2 absorber layer.
II. EXPERIMENTAL METHODS
In the first step of the two-step process, the Cu–In metallic precursors were cosputtered at working pressure around 2.5 × 10⁻³ mbar from separated Cu and In targets by direct current and radio frequency magnetron sputtering onto soda-lime glass substrates without intentional heating. The thickness of the Cu–In alloy was around 700 nm with Cu/In ratio between 0.85 and 0.95. In the second step, the metallic precursors were chalcogenized in two distinct stages. During the first stage, the metallic precursors were partly selenized in Se ambient at a temperature of 320 °C for 10 min. In the second stage, the partly selenized precursors were sulfurized in diluted H2S in Ar for 20 min at different temperatures of 425, 475, and 525 °C. The crystalline quality and the phases of the films were evaluated by x-ray diffraction (XRD) (TTR-III diffratometer, Rigaku, Tokyo, Japan, with Cu Kα radiation, λ = 1.5406 Å) patterns. The morphology of the films was evaluated by scanning electron microscopy (SEM) (JEOL-JSM-6390LA, Tokyo, Japan), and the bulk compositions of the films were determined by energy dispersive spectroscopy (EDS). The Raman scattering (LABRAM-HR micro-Raman system, JY, Paris, France) analysis has also allowed identifying the phases in the films. The optical bandgap of the thin films was determined using a UV–Vis–NIR absorption spectrometer in the wave length range of 300–1500 nm at room temperature. The resistivity of the CuIn(SxSe1-x)2 thin films was measured using four-probe method.
III. RESULTS AND DISCUSSION
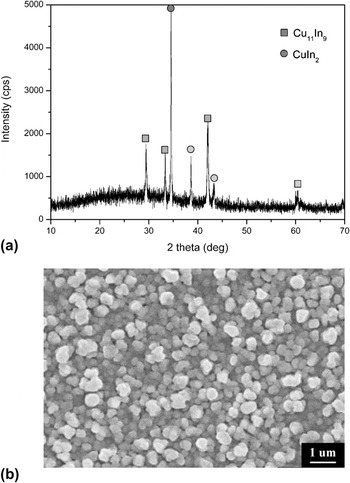
Figures 1(a) and 1(b) depict the XRD pattern and SEM image for Cu–In metallic precursors with Cu/In ratio of 0.90 ± 0.05. The result of the XRD analysis indicates that the metallic precursors consist of Cu11In9 and CuIn2 phases.Reference Volobujeva, Altosaar, Raudoja, Mellikov, Grossberg, Kaupmees and Barvinschi11 The SEM image shows that the surface of the metallic precursors is smooth and that the grain distributes uniformly with the size of 200 nm.
(a) X-ray diffraction (XRD) pattern of Cu–In metallic precursors and (b) scanning electron microscopy (SEM) image of Cu–In metallic precursors.

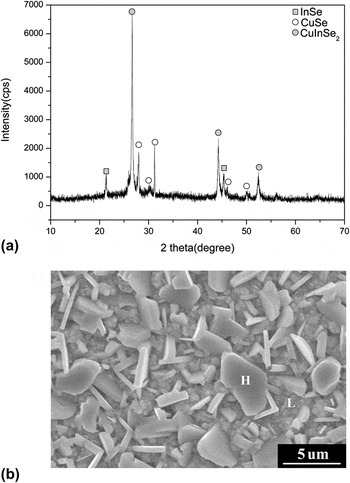
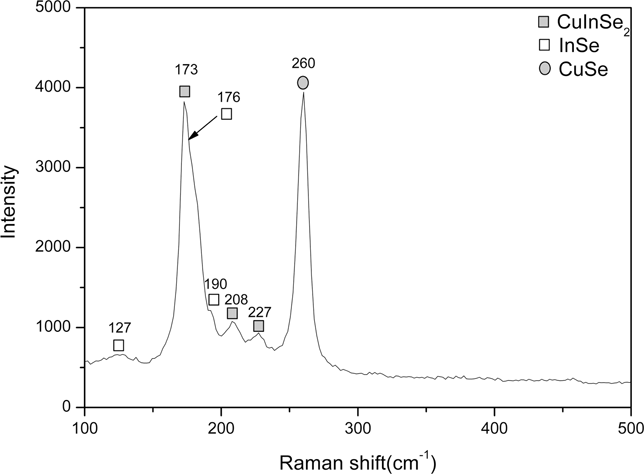
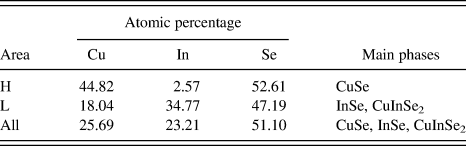
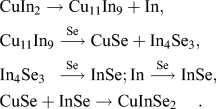
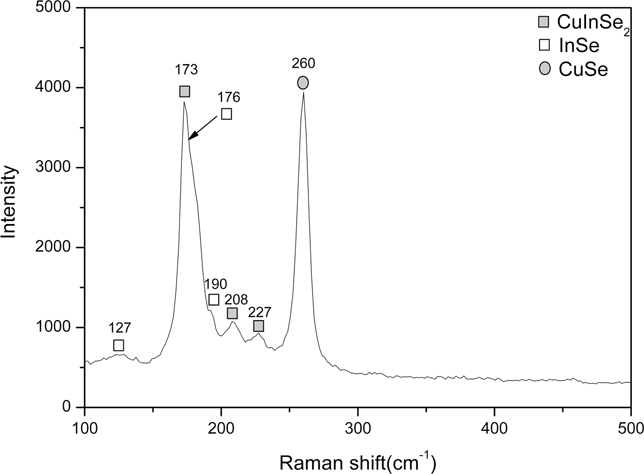
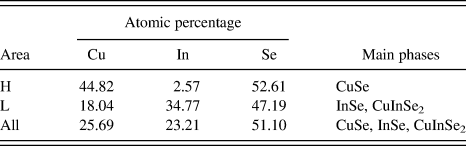
The Cu–In metallic precursors were all selenized at 320 °C for 10 min in Se ambient. Figure 2(a) depicts XRD pattern of thin films selenized under the specified experimental condition discussed above. It is clear that there are CuSe (PDF no. 06-0427) and InSe (PDF no. 12-0118) binary phases besides CuInSe2 (PDF no. 65-4105) phase, which were found to be necessary for the incorporation of S into the partly selenized precursor to form single-phase CuIn(SxSe1-x)2 (CISS).Reference Bekker12 The SEM image in Fig. 2(b) showed that the surface of the partly selenized precursor is dominated by big hexagonal crystal with sizes up to 1 μm. The lower part (marked as L) of the partly selenized film consists of small-crystalline matrix. Results of EDS analysis at points (marked as H, L) indicate that the surface of the layers consists of CuSe phase and that the lower part consists of mix phases of InSe and CuInSe2 (Table I). Raman spectra (Fig. 3) gives additional confirmation of the multiphase structure of the partly selenized precursors. The main peak in the spectra at about 173 cm−1 is generally linked to the A 1 mode from chalcopyrite-ordered CuInSe2, while the obvious peak at 260 cm−1 is characteristic of Cu–Se compound.Reference Izquierdo-Roca, Perez-Rodriguez, Romano-Rodriguez, Morante, Alvarez-Garcia, Calvo-Barrio, Bermudez, Grand, Ramdani, Parissi and Kerrec13, Reference Izquierdo-Roca, Fontane, Alvarez-Garcia, Calvo-Barrio, Perez-Rodriguez, Morante, Jaime-Ferrer, Saucedo, Grand and Bermudez14 In addition, the appearance of bands at 127, 176, and 190 cm−1 is attributed to InSe.Reference Choi and Yu15 The presence of the binary phases of CuSe and InSe is due to the low selenization temperature and the incomplete reaction. The reaction equations are described in Ref. Reference Tang, Kunecke, Oehlschlager, Holzing, Schurr, Hock and Wellmann16:
(a) XRD pattern of the partly selenized precursor at 320 °C for 10 min and (b) SEM image of the partly selenized precursor at 320 °C for 10 min.

Raman shift of the partly selenized precursor at 320 °C for 10 min.
Atomic percentage and main phases in different areas of the precursor that was partly selenized at 320 °C for 10 min at identical Se ambient.
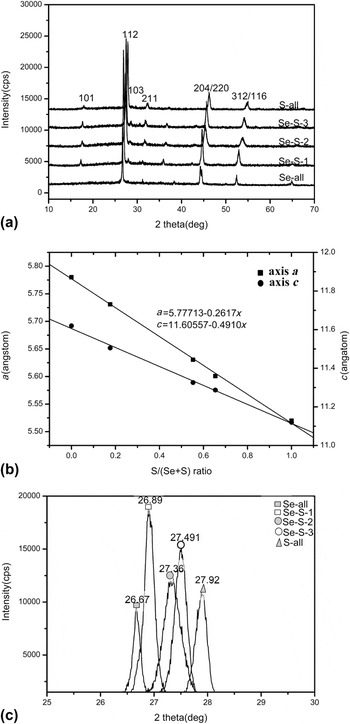
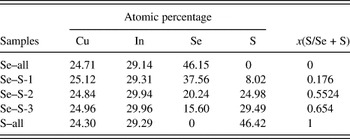
Immediately after the selenization step, the partly selenized samples were exposed to H2S/Ar at 425, 475, and 525 °C for 20 min to prepare CuIn(SxSe1-x)2 thin films with different x. In addition, pure CuInSe2 (x = 0, namely Se–all) and CuInS2 (x = 1, namely S–all) were also prepared. The EDS analysis shows the composition of the CuIn(SxSe1-x)2 thin films (Table II). Figure 4(a) shows the XRD patterns of pure CuInSe2 and CuInS2 and samples sulfurized at different temperatures. The significant shift of the peaks of the (112) and (204) planes means a smaller d-value and the incorporation of more S atoms into the crystal lattice when the sulfurization temperature increases from 425 to 525 °C. According to the Bragg’s equation 2d sin θ = nλ and the approximate formula 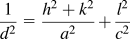 , the lattice constants a and c of the alloys as a function of S/(Se + S) atomic ratio were calculated from the XRD data and are depicted in Fig. 4(b). It is important to note from Fig. 4(b) that the lattice constants vary linearly with the S/(Se + S) ratio in accordance with Vegard’s law.Reference Sheppard, Alberts and Botha6 This result provides an experimental proof that the quaternary alloys are homogeneous over a broad compositional range. To clearly analyze the peak positions of the (112) planes of the CISS thin films, only the 2θ-range between 25° and 30° is highlighted in Fig. 4(c). The sharp and single peaks in between the two extreme reflections of pure CuInSe2 and CuInS2 at 26.89°, 27.36°,and 27.49°represent the (112) reflection of single-phase CuIn(S0.18Se0.82)2, CuIn(S0.55Se0.45)2, and CuIn(S0.65Se0.35)2 thin films. The shift of the (112) reflections to higher angles with respect to the (112) reflection of pure CuInSe2 is the result of the incorporation of S into the chalcopyrite lattice, which results in the shrinkage of the unit cell. Raman scattering contributes a technique well suited for the microstructure characterization of chalcopyrite-based processes. The zone-center phonon representation of the chalcopyrite structure is constituted by 21 optical modes of which only the two A 2 modes are silent.Reference Izquierdo-Roca, Perez-Rodriguez, Romano-Rodriguez, Morante, Alvarez-Garcia, Calvo-Barrio, Bermudez, Grand, Ramdani, Parissi and Kerrec13

(a) XRD pattern of the CuIn(SxSe1-x)2 with different x, (b) plot of lattice constants as a function of S/(Se + S) atomic ratio, and (c) XRD (112) reflections of CuIn(SxSe1-x)2 thin films with different x.

Atomic percentage and the S/Se + S ratio in the CuIn(SxSe1-x)2 thin films with different sulfurization temperatures at 425, 475, and 525 °C.

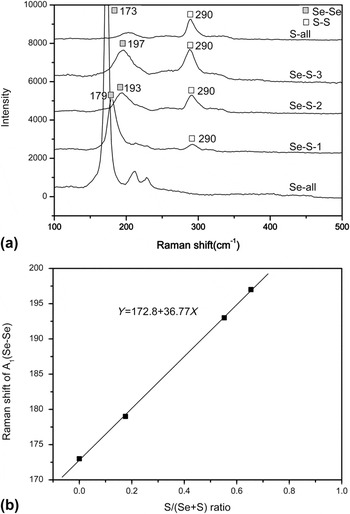
The A 1 symmetry mode, corresponding to the antiphase vibration of the anions in the lattice, constitutes the most remarkable exception, and it is usually the most intense band in the spectra of chalcopyrite compound. The Raman spectra obtained from the surface of the CuIn(SxSe1-x)2 thin films are shown in Fig. 5(a). In this figure, it can be seen that both A 1[Se–Se] mode and A 1[S–S] mode are observed, which indicated that the A 1 mode phonon behaves as two-mode type. The Fig. 5(b) depicted that as the sulfurization temperature increases from 425 to 525 °C, the A 1[Se–Se] mode shifts linearly from 173 cm−1 (x = 0) to 197 cm−1 (x = 0.65) and that the A 1[S–S] mode has no significant shift (290 cm−1).Reference Shirakata, Terasako and Kariya8 The full width at half maximum (FWHM) of the A 1[Se–Se] and the relative intensity of A 1[S–S] mode all increase as x increases from 0 to 1.
(a) Raman shift of CuIn(SxSe1-x)2 with different x and (b) plot of Raman shift of A 1[Se−Se] mode as function of S/(Se + S) ratio.

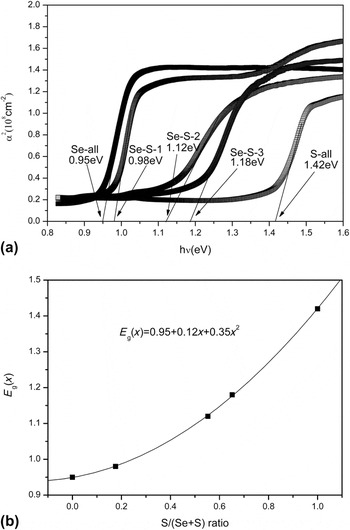
The optical bandgap was determined from the absorption spectra of the CuIn(SxSe1-x)2 thin films. In Fig. 6(a), the bandgap is depicted as a function of S/(Se + S) ratio for single-phase CuIn(SxSe1-x)2 thin films. It is clear that the bandgap increases from 0.95 eV for pure CuInSe2 to 1.42 eV for pure CuInS2. It is also interesting to note in Fig. 6(b) that the optical bandgap does not vary linearly with x but rather follow a parabolic behavior. The variation in bandgap value with the S/(Se + S) ratio can be described by

(a) Optical absorption spectra of CuIn(SxSe1-x)2 thin films and (b) plot of bandgap as a function of S/(Se + S) ratio.

where  = 1.42 eV,
 = 0.95 eV, and b is the bowing parameter. This parameter derived from the optical absorption data is 0.35 eV, which is in good agreement with Refs. Reference Sheppard, Alberts and Botha6, Reference Chavhan and Sharma9, and Reference Mudryi, Victorov, Gremenok, Patuk, Shakin and Yakushev17. The resistivity of the CuIn(SxSe1-x)2 thin films was measured by four-probe method. The resistivity increases monotonically from 101 to 103 Ω·cm as the x increases.Reference Shirakata, Terasako and Kariya8
IV. CONCLUSIONS
In conclusion, single-phase CuIn(SxSe1-x)2 chalcopyrite alloys can be successfully prepared by a novel two-step process. The Cu/In atomic ratio of the films was accurately controlled by magnetron sputtering, while the S/Se ratio was controlled by sulfurization temperature. When the reaction temperature T increases from 425 to 525 °C, x increases from 0 to 1. The 2θ of (112) planes, the lattice parameters, and the Raman shift of A 1[Se–Se] of the alloys varied linearly with the S/(Se + S) ratio. The bandgap of the thin films shifted to higher values by the homogeneous incorporation of sulfur into the chalcopyrite structure. The bandgap as a function of the S/(Se + S) ratio revealed a parabolic behavior. The resistivity of the CuIn(SxSe1-x)2 thin films increases monotonically from 101 to 103 Ω·cm as the x increases from 0 to 1.
ACKNOWLEDGMENTS
This work was supported by National Basic Research Program of China (973 Program)-2012CB922001 and the Fundamental Research Funds for the Central Universities (WK2060140005).