


There has been a substantial increase in the use of multivariate statistical methods, such as principal components analysis (PCA), to assess patterns of diet. These patterns are being used in addition to individual nutrients or food intakes in disease-risk studies. PCA is useful in identifying the underlying dimensions in a large number of variables and is based on the inter-correlations between these variables.
Despite the popularity of this empirical method, only a handful of studies have examined dietary patterns longitudinally and the methods that have been employed have been inconsistent. There are a number of reasons why it would be of interest to investigate the longitudinal nature of dietary patterns. From a methodological point of view, several subjective decisions need to be taken by the researcher in order to derive dietary patterns by PCA and concern has been raised regarding the lack of generalisability of dietary patterns obtained using PCA across studiesReference Hu1, Reference Martinez, Marshall and Sechrest2. As a result, it would be beneficial to assess the stability, reproducibility, and therefore validity, of dietary patterns within the same populationReference Newby, Weismayer, Akesson, Tucker and Wolk3. Furthermore, changes in dietary patterns over time are increasingly being used to assess disease-riskReference Fung, Schulze, Manson, Willett and Hu4–Reference Schulze, Fung, Manson, Willett and Hu6. Such changes in patterns may reflect the modification of diet by individuals over time as a result of nutritional advice which is constantly being updated, or changes in the food supply; for example, newly available foods such as soya products and probiotics. Changes may also be due to a major life event, such as becoming pregnant and having children. It will be important to examine the implications of these changes to health.
Differing methodologies have been employed to investigate the stability of dietary patterns and changes over time. The most popular to date involves performing separate PCA at each time point and calculating component scores independently of each otherReference Newby, Weismayer, Akesson, Tucker and Wolk5–Reference Mishra, McNaughton, Bramwell and Wadsworth15. Alternatively two studies which found that the dietary patterns obtained were similar across time points (in terms of the foods describing them and size of loadings), applied the loadings from one time point to the data at another thereby obtaining scores using the same formulaeReference Prevost, Wichelow and Cox14, Reference Mishra, McNaughton, Bramwell and Wadsworth15. To our knowledge only three studies have assessed any change in dietary pattern scores over time. Again different methodologies have been used: regression analyses to obtain parameter estimates representing change in overall scoreReference Borland, Robinson, Crozier and Inskip8, Reference Prevost, Wichelow and Cox14 or movement across categorical groupsReference Mikkila, Rasanen, Raitakari, Pietinen and Viikari12. Only one study has examined both continuous and categorical scoresReference Mishra, McNaughton, Bramwell and Wadsworth15.
The aim of this study was to investigate the methods used to assess stability and/or changes in dietary patterns, which have been obtained using PCA, in a cohort study of pregnant women who provided further dietary information at 47 months after birth.
Methods
The Avon Longitudinal Study of Parents and Children (ALSPAC) is an ongoing longitudinal cohort study designed to investigate the determinants of development, health, and disease during childhood and beyondReference Golding, Pembrey and Jones16. Pregnant women were eligible for the study if they had an expected date of delivery between 1 April 1991 and 31 December 1992, and were resident in the former Avon health authority in south-west England. More detailed information on the study can be found on the website (www.alspac.bris.ac.uk). A total of 14 541 women enrolled. Ethical approval for the study was obtained from the ALSPAC Law and Ethics committee and the three local research ethics committees. The primary source of data collection was via self-completed postal questionnaires.
The present study used data from questionnaires completed at 32 weeks gestation and 47 months (approximately 4 years) after the birth of the child. Both questionnaires contained a set of questions enquiring about the frequency of consumption of a wide variety of foods and drinks. Previous analysis of the pregnancy food frequency dataReference Rogers and Emmett17 showed this questionnaire to produce mean nutrient intakes similar to those obtained for women in the British National Diet and Nutritional survey for adultsReference Gregory, Foster, Tyler and Wiseman18. The specific question on the frequency of oily fish consumption in pregnancy has been validated by comparison with the erythrocyte fatty acid composition of pregnancy blood samples. The leucocyte DHA content increased significantly with increasing frequency of consumption of oily fish, the predominant source of DHA (P < 0·001)Reference Williams, Birch, Emmett and Northstone19.
In both questionnaires the woman was given the following options to indicate how often she was currently consuming a variety food type: (i) never or rarely; (ii) once in 2 weeks; (iii) 1–3 times per week; (iv) 4–7 times per week; (v) more than once daily. The woman was also asked to record how many cups of tea or coffee, the number of glasses of cola and the number of slices of bread she usually consumed daily. The usual type of bread (white or other) she used was also recorded. The second questionnaire had been modified slightly in the light of analysis of the first questionnaire and some changes in the foods available. For example, separate categories were created for coated poultry and fish products, vegetarian pies and tuna, which had previously been encompassed in other categories. Therefore, at 4 years a number of additional foods and drinks (see Table 1) were included in the questionnaire. We chose to keep this extra information separate rather than combine into existing food groups created from the pregnancy questionnaire.
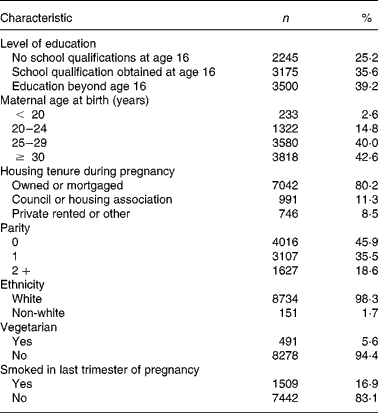
Baseline characteristics of the study sample (n 8935)
The frequency of consumption data were numerically transformed into times consumed per week, in order to apply quantitative meaning to the frequency categories, as follows: (i) 0; (ii) 0·5; (iii) 2; (iv) 5·5 and (v) 10 times per week. All data were standardized by subtracting the mean and dividing by the standard deviation for each variable; this was necessary because tea, coffee, cola and bread were measured on a different scale from the other variables.
Statistical methods
PCA with varimax rotationReference Gorsuch20, Reference Kline21 was performed on the forty-four standardized food items from the pregnancy questionnaire and has been described in detail elsewhereReference Northstone, Emmett and Rogers22. An identical procedure was used for the fifty-two standardized food items from the 4-year questionnaire. The number of components that best represented the data was primarily chosen on the basis of the scree plotReference Cattell23 and the interpretability of the components. Women were excluded from each PCA if they had more than ten dietary items missing from the respective questionnaire. We made the assumption that if ten or fewer items were missing, the woman did not consume those items and they were given a value of 0. Most (92 %) of the women gave complete responses to the FFQ at both time points. Of those with incomplete data, 85 % omitted only one item and 8 % omitted two items. Foods with loadings above 0·3 on a component were considered to have a strong association with that component and were deemed to be the most informative in describing the dietary patterns. We have chosen to give each component a label; these do not perfectly describe each underlying pattern but aid in the report and discussion of the results.
A component score was created for each woman for each of the components identified at both time points by multiplying the factor loadings by the corresponding standardized value for each food and summing across the food items. In line with previous studiesReference Prevost, Wichelow and Cox14, Reference Mishra, McNaughton, Bramwell and Wadsworth15, an additional set of scores were created for the 47-month data using the loadings obtained from the PCA on the pregnancy data; to aid reporting we have chosen to call these scores ‘applied’.
All component scores were approximately normally distributed. Pearson's correlation coefficients were calculated to measure the associations between the dietary pattern scores obtained at the two time points and using the two different methods. Paired t tests were applied to assess the change in mean scores over the 4-year period between questioning. Limits of agreement (95 %)Reference Bland and Altman24 were calculated as the mean difference between the pregnancy and 4-year scores plus or minus twice the standard deviation of the differences; these enabled us to assess the extent of agreement between the time points and provide an idea of the spread of the variation of scores between the time points. In order to make comparisons with other studiesReference Borland, Robinson, Crozier and Inskip8, Reference Weismayer, Anderson and Wolk13 all component scores were then split into quintiles and were compared across time using weighted κReference Cohen25. Weighted κ was employed due to the ordered nature of the categorical data; weighted κ takes into account partial agreement between groups. Finally in an attempt to assess the stability of the patterns over time, the dietary pattern scores were split into quintiles. Cross-tabulations between the pregnancy score quintiles and the two sets of 4-year score quintiles are presented.
All analyses were performed using SPSS for Windows version 12.0.1, with the exception of weighted κ, which was obtained using STATA for Windows version 9.2.
Results
A total of 12 436 women returned the questionnaire completed at 32 weeks gestation (85·5 % of the original sample; many of these had already been lost due to miscarriage). Of these, 12 053 (96·9 %) had sufficient dietary data available for the PCA. 9504 (65·4 % of the original sample) women returned the questionnaire 4 years after birth and a total of 8953 women (61·6 %) had PCA performed at both time points. Table 1 details the basic characteristics of the sample and it can be seen that those under study are more likely to be older, better educated, live in owner-occupied accommodation and be pregnant for the first time. Only 1·7 % of the sample was of non-white ethnicity. 5·6 % of the women reported themselves to be vegetarian and 16·9 % were smoking at 32 weeks gestation. We present elsewhere a detailed analysis of the differences in dietary pattern scores and socio-demographic factorsReference Northstone, Emmett and Rogers22.
Five dietary components were chosen to best describe the dietary patterns of the women in pregnancy, explaining 31·3 % of the variance. Table 2 shows the factor loadings obtained. At 4 years after birth, four components were preferred, explaining 25·1 % of the variance. It should be noted that these proportions are not directly comparable due to the differences in the number of food items entered into the two PCA. At both time points the first component loaded highly on salad, fresh fruit, rice, pasta, fish, pulses, and non-white bread and was labelled ‘health conscious’. The second component from the pregnancy data had high loadings for all types of vegetables and to some extent red meat and poultry and was labelled ‘traditional’ in line with the familiar British ‘meat and two veg’ diet. This component was not extracted from the 4-year data. The foods that described this component at the first time point loaded highly on the ‘health conscious’ component at the second time point. As foods such as vegetables, poultry and fish are recommended in healthy eating regimes, we kept the label ‘health conscious’ for the first component at the second time point.
Factor loadings of various food items in the principal dietary components identified (loadings above ±0·3 are shown in bold) in women at 32 weeks of pregnancy and when their children were 4 years of age based on food frequency questionnaires

NA, question not asked.
* Traditional pattern not obtained post-partum.
† In pregnancy all fish combined. At 47 months, fish other than coated.
‡ At 47 months includes tinned pasta.
§ At 47 months includes all chocolate (chocolate bars combined).
The three remaining components at each time point were virtually identical in the foods that loaded highly on them resulting in ‘processed’, ‘confectionery’ and ‘vegetarian’ components. As described earlier, the additional foods loading highly on each of these components at 4 years did not require a change in the name from pregnancy. The ‘processed’ component loaded highly on meat pies, sausages and burgers, fried foods, pizza and chips. The ‘confectionery’ component was characterized by high intakes of chocolate, sweets, biscuits, cakes and other puddings. The ‘vegetarian’ component loaded highly on meat substitutes, pulses, nuts and herbal tea and high negative loadings were seen with all meats at both time points.
Since the ‘traditional’ pattern was not repeated in the 4-year data, this component was not included in any further comparative analyses. Table 3 presents the correlations between the dietary patterns. The first row compares the distinct scores obtained over the 4-year period while the second row correlates the applied scores. It can be seen that the correlations are similar though slightly larger across the scores using the applied method. Table 3 also presents the mean scores with paired t tests to assess the change in scores, for each of the dietary components. The 4-year applied scores are considerably lower on average than those obtained from the separate 4-year PCA, however the standard deviations are much larger for the former, reflecting the inflated maximum values using this method. Using the scores obtained from the two separate PCA it can be seen that, overall, women decreased their scores on the ‘health conscious’ component (mean difference − 0·284; P < 0·0001). The ‘processed’ and ‘vegetarian’ scores both increased over the 4-year period (mean differences 0·042 (P < 0·0001) and 0·024 (P = 0·021) respectively). In contrast, applying the factor loadings from the pregnancy data resulted in systematic decreases in all scores at the later time point, with the biggest differences seen in the ‘health conscious’ and ‘confectionery’ pattern scores (mean differences − 0·284 and − 0·108; both P < 0·0001). Comparing scores from the pregnancy data with the applied 4-year data produced considerably wider limits of agreement than comparison with the separate 4-year scores suggesting greater variation in the applied scores compared to the separate scores from the 4-year data.
Pearson's correlation coefficients, mean values and standard deviations, mean change and limits of agreement for dietary pattern scores obtained at 32 weeks gestation and when children were 4 years of age

* Scores obtained from separate principal components analysis.
† Score obtained by applying factor loadings obtained from pregnancy data.
A reasonable level of agreement was seen between the categorized component scores from the pregnancy data and the 4-year data, ranging from 0·267 to 0·306 (Table 4). The values of κ were slightly higher for the applied 4-year data, with the exception of the ‘vegetarian’ component. The highest levels of agreement were seen been the sets of scores obtained from the 4-year data (ranging from 0·586 for the ‘vegetarian’ component to 0·707 for the ‘health conscious’ component).
Weighted κ with 95 % CI for quintiles of dietary pattern scores obtained at 32 weeks gestation and when children were 4 years of age
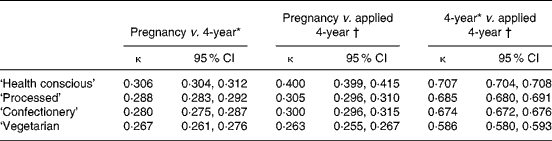
* Scores obtained from separate principal components analysis.
† Score obtained by applying factor loadings obtained from pregnancy data.
Table 5 assesses the stability of the scores for two of the components ‘health conscious’ and ‘processed’ over time. The dietary pattern scores were split into quintiles and the Table presents the cross-tabulations of the quintiles from the 32-week data against the two sets of 4-year data. It can be seen that agreement was slightly better for the ‘applied’ score of the ‘health conscious’ component compared to that directly obtained from the 4-year data. For example 50·1 % who were in the lowest quintile for the ‘health conscious’ component during pregnancy remained in this quintile at 4 years using the applied scores, compared to 45·5 % using the separate score; while 48·3 % of mothers remained in the top quintile using the applied scores compared to 37·5 % using the separate score. This was not the case for the ‘processed’ component where the applied score appeared to be much less stable compared to the separate score. For every quintile of the ‘processed’ component in pregnancy, approximately 80 % migrated to another quintile by 4 years, with, on average, even spread into the remaining four quintiles.
Proportion (%) of women in each quintile of ‘health conscious’ and ‘processed’ dietary pattern score obtained at 32 weeks gestation who remained in that quintile when their children were 4 years of age

Discussion
We have reported two sets of dietary components obtained using PCA at two time points in the same cohort of women: one in late pregnancy and the other 4 years after the birth. We observed differences in the factorial structures of the components obtained at two time points such that the ‘traditional’ component was absent at the second time point. Despite this the loadings that were obtained for each set of components were highly comparable. However, additional high loadings were observed on the ‘health conscious’ component at four years; these were the foods which originally loaded highly on the ‘traditional’ component in pregnancy. The loss of a component extracted at the second time point can be partly explained by the fact that additional questions were used in the second questionnaire. However, given that the components that were obtained at 4 years were very similar to the other four remaining components from the pregnancy data, the labels applied were appropriate as were the resulting comparisons that we made.
It could be argued that using a pregnant cohort to obtain the first set of dietary components may explain the differences we reported. There is potential for dietary modification during this life event along with other major lifestyle changes. Ideally, pre-conception diet would be compared in parallel with the diet after the birth to determine how much of an effect pregnancy might have on a woman's diet but this data was not available to the study. Cuco et al. performed PCA on dietary data collected before conception, at four time points during pregnancy and 6 months postnatallyReference Cuco, Fernandez-Ballart, Sala, Viladrich, Iranzo, Vila and Arija9. This study obtained slightly different patterns at each time point but the authors concluded that the patterns did vary significantly over time. Although this study had the advantage of data collection at multiple time-points, it sampled only eighty women and used 7 d dietary records. Potentially PCA performed on data collected from dietary records could be more stable than using data collected from FFQ as we have done. The time lag after birth was very short compared to that reported here and had Cuco et al. extended their follow-up time more substantial changes may have become evident. A further limitation of this study is the loss to follow-up. A quarter of women who completed the pregnancy questionnaire failed to complete the follow-up questionnaire. There is potential for bias to have been introduced in the complete-case sample. However, the women who remained in the study were unlikely to have changed the way they would have completed their FFQ; we doubt that these drop-outs would have a major effect on the dietary patterns obtained.
We found very little difference in the size of the correlations depending on whether the separate or applied scores were used at 4 years. However, the correlations between the two sets of scores in this study are generally lower than those reported by others who have identified quantitatively similar patterns. Borland et al. Reference Borland, Robinson, Crozier and Inskip8 reported correlations of 0·81 and 0·64 for their prudent and high energy patterns respectively in their study of ninety-four young women over a 2-year period. The prudent and western patterns identified by Hu et al. Reference Hu, Rimm, Smith-Warner, Feskanich, Stampfer, Ascherio, Sampson and Willett10 had correlations of 0·70 and 0·67 1-year apart in their study of 127 men. However, other studies that had a greater time period (10 years or more) between their dietary assessments reported correlations smaller than oursReference Newby, Weismayer, Akesson, Tucker and Wolk5, Reference Mikkila, Rasanen, Raitakari, Pietinen and Viikari12. It would appear from the literature that as the time lag increases the sizes of the correlations decrease. We agree with Weismeyer et al. Reference Weismayer, Anderson and Wolk13 who suggested that: ‘studies that are updated only after ≥ 7 years risk the validity of their dietary exposures because complex changes in the diet increase over time’.
In this study we found differences in the means and measures of agreement reported according to whether the applied or separate scores were calculated at the 4-year follow-up. The applied scores were considerably lower on average than those obtained from the separate 4-year PCA, with wider limits of agreement, suggesting greater variability in the applied scores. This is most likely explained by the fact that a greater number of foods were asked about in the 4-year FFQ. Differences were also evident in score changes over time. Based on the scores obtained from the two separate PCA, scores decreased on the ‘health conscious’ component. The ‘processed’ and ‘vegetarian’ scores both increased over the 4-year period. However, using the applied scores from the pregnancy data resulted in systematic decreases in all scores at the later time point. The explanation for this overall decrease is probably due to the fact that women already had lower ‘applied’ scores. Therefore, using ‘applied’ scores could be misleading when investigating the associations between real changes in dietary patterns over time and health outcomes. We would recommend that any future studies planning to use ‘applied’ scores consider performing PCA at each time point to compare separate scores and determine whether there are any apparent differences. Two studies have applied this method previouslyReference Mikkila, Rasanen, Raitakari, Pietinen and Viikari12, Reference Mishra, McNaughton, Bramwell and Wadsworth15. The earliest of these reported that the factor loadings at follow-up were almost identical to those derived at baseline but did not discuss the implications of adopting these baseline scoresReference Mikkila, Rasanen, Raitakari, Pietinen and Viikari12. The later study used a slightly different approach by creating scores based on the number of food items consumed (as opposed to the quantity or frequency of consumption) as reported in 5 d food diaries, entered into a factor analysis at second follow-upReference Mishra, McNaughton, Bramwell and Wadsworth15. The factor loadings from this cross-sectional analysis were then employed to derive scores at baseline and first follow-up. This approach is appropriate when dietary records are used as it enables a large number of foods to be included from the start. Applying this method to data collected via FFQ would not be as beneficial since the breadth of detail collected by FFQ is limited.
There are theoretical differences between the two methods that we have employed. Use of the ‘applied’ scores enables the researcher to assess the stability of the dietary patterns that were identified at baseline; however, any new patterns that may have emerged at follow-up would not be identified. Using the two sets of loadings that emerged from separate PCA at each time point enables the researcher to identify the important patterns at each time point. However, if these patterns differed significantly it would not be possible to assess the stability of the patterns obtained at baseline.
In conclusion, the four components obtained from the two time points in this study were mostly consistent in terms of the foods that loaded highly and the sizes of those loadings. However, the loss of one component across the time period meant that exact comparisons could not be made. In this cohort using the ‘applied’ method to obtain scores at the second time point was not appropriate. We found that there were changes in the overall scores over the 4-year period of follow-up when the scores were computed using separate PCA at the second time point. Work is currently underway in this cohort to determine the factors driving these changes in dietary pattern scores.
Acknowledgements
We are extremely grateful to all the families who took part in this study, the midwives for their help in recruiting them, and the whole ALSPAC team, which includes interviewers, computer and laboratory technicians, clerical workers, research scientists, volunteers, managers, receptionists and nurses. The UK Medical Research Council, the Wellcome Trust and the University of Bristol provide core support for ALSPAC. This work was also partially funded by a Wellcome Trust VIP award to K. N. and by the Arthritic Association supporting K. N. and P. M. E.
This publication is the work of the authors who also serve as guarantors for the contents of this paper; we declare there is no conflict of interest.



