Implications
Genetic and environmental improvements offer an opportunity to increase production from existing animal resources. The genetic characterization of local breeds is of paramount importance, not only for conservation purposes, but also for the definition of breeding objectives and breeding programmes. Genetic improvement could also contribute to increased productivity.
Introduction
The Segureña breed is one of the most important meat sheep breeds in Spain, Europe and the world. Spain is ranked second in Europe for sheep census and production (MAGRAMA, 2013). Furthermore, the Segureña breed helps boost the local economy of the regions in which it is bred, namely the highlands of Granada, Sierra de Segura and Las Villas, which are among the poorest areas of Europe. This breed is therefore the main reason why people settled in the above-mentioned regions. However, live animals with high genetic values are also an important Spanish export. Segureña sheep are mainly exploited in extensive and semi-extensive conditions due to their excellent capacity for adaptation; they are also a component of the balanced ecosystems in the regions they inhabit, thereby making them a mainstay of environmental and social sustainability (Lupi et al., Reference Lupi, Nogales, León, Barba and Delgado2015).
There is an urgent need to increase productivity to improve smallholder farm income and to meet the demands of the growing human population for livestock products. Efforts to improve the productivity of local sheep have been part of national research for the last 30 years.
Most studies on local sheep breeding have, so far, concentrated on evaluating breeds based only on growth performance. Very little has been done to assess the genetic attributes of the breeds for economically important traits based on growth curves. For accurate genetic evaluation and selection, estimates of variance/covariance components and other genetic parameters for important traits should be known. In this regard, growth traits linked to curve parameters are important, as they significantly influence the profitability of any sheep production enterprises. The main objectives of this study were to estimate the best-fit growth curve parameters of Segureña sheep, the variance and (co)variance components, heritability and genetic correlations. These parameters, and especially their biological meaning, are informative for breeders as they permit the inference of relevant economic information with regard to the inflexion point and maturity that are not accessible from the analysis of simple growth traits such as weights at different key ages (birth, weaning and slaughtering) or daily gains.
Growth functions have been used extensively to represent changes in size with age, so that the genetic potential of animals for growth can be evaluated and nutrition matched to potential growth. In models of animal production systems, growth curves are used to provide estimates of daily feed requirements for growth. An appropriate growth function conveniently summarizes the information provided by observations on an animal into a small set of parameters that can be interpreted biologically and used to derive other relevant growth traits (López et al., Reference López, France, Gerrits, Dhanoa, Humphries and Dijkstra2000).
The desired properties of such growth functions are that weight tends towards a final or asymptotic value with time, that growth rate has a maximum at some intermediate weight, and that the relative growth rate decreases monotonically, preferably in some simple way, as weight increases towards maturity. The Verhulst and the logistic forms are examples of functions with such properties that describe growth as a comparatively simple, single equation. They have three parameters, with the important ones being mature size and rate. Importantly, the values of such parameters have clear biological interpretations (Lewis and Brotherstone, Reference Lewis and Brotherstone2002).
Slow growth rate, resulting in low market weight, has been identified as a limitation to profitability. Growth rate is related to maturation rate and mature weight, and it has been suggested that these latter traits are related to other female lifetime productivity parameters in goats; the existence of an optimum size to improve productivity has also been suggested for sheep. Therefore, the rate of gain and mature weight need to be considered in selection programmes. Fast early growth on the part of the slaughter generation and smaller mature size on the part of the reproducing females (though it results in a lower culled ewe value) are desirable traits. Growth curve parameters provide potentially useful criteria for altering the relationship between BW and age through selection, and an optimum growth curve can be obtained by selection for desired growth curve parameters (Bathaei and Leroy, Reference Bathaei and Leroy1998; Abegaz et al., Reference Abegaz, Vanwyk and Jacobus2010).
Based on the parameters of the growth models, other indicators can be derived such as the degree of maturity at a specific time as well as the age and weight at the point of inflection (Blasco, Reference Blasco1999; Goyache, Reference Goyache2005), which indicates a change in the growth rate. The parameters and indicators of growth, derived from non-linear models, can be taken into account in the selection criteria within a breed, with the aim of modifying the shape of the growth curve (Blasco, Reference Blasco1999; Goyache, Reference Goyache2005).
Information of genetic parameter estimation for different traits is useful in formulating breeding programmes because these parameters determine the direction and magnitude of genetic improvement (Mekuriaw and Haile, Reference Mekuriaw and Haile2014).
The biological importance of some growth curve parameters are well known. They are related to the estimation of the mature weight of the animals, to the age when they reach maturity, and to the inflection point when the growth slows to a stop, among others. This information is used to support breeders’ decisions taken over aspects strongly linked to meat productivity, such as reproduction, body condition, timing of slaughtering decision, etc. Therefore, genetic and economic parameters strongly suggest that growth curve parameters should be taken into account in breeding programmes.
Material and methods
The weight–age data for this study were obtained from 41 330 individuals taken from the historical archives of the National Association of Segureña Sheep Breeders. Each individual had four weight observations: between 0 and 15 days old (P0), between 16 and 35 days (P1), between 36 and 55 days (P2) and between 56 and 80 days (P3). The weight at 80 days of age (slaughter weight) is economically of great importance in the post-weaning growth of Segureño lambs. The data were collected from 2000 to 2014. This archive contained all the information concerning lamb weights at different ages of reference – birth, early weaning, late weaning and slaughter – and information about the origin of each (livestock, date of birth, parentage, etc.).
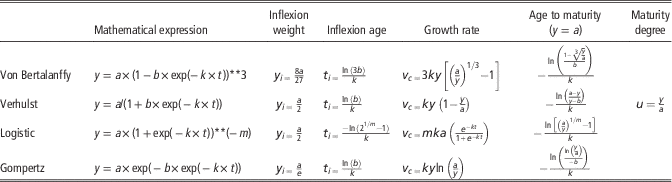
The process of data depuration was performed in two phases. Before model fitting, all records were removed that presented an average weight data±2×SD in each age or differences between weights of ⩽0. Then, using the non-linear regression procedure from the SPSS version 21 statistical package, individual data were fitted to the Von Bertalanffy, Verhulst, logistic and Gompertz non-linear models (whose mathematical expressions and biological parameters are given in Table 1) to select the model in which there was more convergence for the general data structure. As repeated measurements are generally autocorrelated, the growth models were fitted to individual lambs to remove any possible bias in statistical inference on growth parameters (Daskiran et al., Reference Daskiran, Koncagul and Bingol2010). Growth parameters in this study were estimated using unadjusted weights due to the fact that serial measurements were simultaneously considered in the estimation of parameters (Brown et al., Reference Brown, Fitzhugh and Cartwright1976).
Mathematical description of growth models, biological parameters and growth evaluators

y=weight, in kg, at age t; t=age in days; a, b, k and m= parameters.
In a previous study of the Segureña breed growth curve, it was concluded that the most suitable function to explain the evolution of weight from birth to slaughter age (80 days) in a general population was the logistic model (Lupi et al., Reference Lupi, Nogales, León, Barba and Delgado2015). Based on that study, we introduced this function into the present study. In this model, the parameter k represents the relative growth rate (rate of exponential growth); high values indicate animals with precocious maturity (i.e. animals attained mature weight quickly) and low values indicate animals with a delayed maturity or that tend to mature more slowly. The parameter m gives the shape of the growth curve and, consequently, determines the inflection point, which is the beginning of the auto-deceleration stage until the animal reaches adult size (Carolino and Gama, Reference Carolino and Gama1993; McManus et al., Reference McManus, Evangelista, Fernandes, Miranda, Moreno-Bernal and Santos2003; Lambe et al., Reference Lambe, Navajas, Simm and Bünger2006; Echeverri et al., Reference Echeverri, Bergmann, Toral, Osorio, Carmo, Mendonça, Moustacas and Henry2013; Tariq et al., Reference Tariq, Iqbal, Eyduran, Bajwa, Huma and Waheed2013).
The Verhulst model presented the best convergence and the highest proportion of individual convergence, so individual logistic and Verhulst curves were fitted for all animals with four records of weight/age. Individual parameters of both curves were recorded and stored in a database. Before genetic analysis, these data were submitted to a last depuration phase when we excluded records where the iterative fit did not converge or where the parameter a ⩾60 in each model and for each individual. Using these rejection criteria, an ‘accepted set of sheep’ was defined for each estimation method. After this depuration, we retained data from 19 388 lambs (7305 males and 12 083 females), representing 77 552 weight/age observations for the logistic model, and 30 299 lambs’ data (12 690 males and 17 609 females), representing 121 196 weight/age observations, for the Verhulst model.
To support the evaluation of practical efficiency of the fitting of both curve, we calculated the mean deviation between the predicted and observed weight and their correlations.
Variance and (co)variance components and the genetic parameters of the curve parameters were estimated with animal models under the REML methodology using the following general formula:
 $$y{\,=\,}{\equals}X\beta {\plus}Za{\plus}e$$
where y is a vector of observations (a, m and k parameters for the logistic model; a, b and k for the Verhulst model), β a vector of fixed effects:
-
∙ herd (126 levels, min 1, max 1265 and 1958, for logistic and Verhulst models, respectively);
-
∙ year of birth (15 levels, 2000 to 2014, min 51 and 67, max 4486 and 6737, for logistic and Verhulst models, respectively);
-
∙ month of birth (12 levels, January to December, min 234 and 365, max 6544 and 10293, for logistic and Verhulst models, respectively);
-
∙ lamb sex (two levels, male and female, min 7305 and 12690, max 12083 and 17609, for logistic and Verhulst models, respectively);
-
∙ kidding type (three levels, single, twin, triplet or more, min 45 and 80, max 10835 and 15925, for logistic and Verhulst models, respectively).
a is a random vector of additive genetic effects, X and Z the incidence matrices relating β and a to y, and e a random vector of error effects.
A bivariate animal model (A-B, A-M, M-K for the logistic model, and A-B, A-K, B-K for the Verhulst model) was employed to estimate (co)variance components as follows (Canaza-Cayo et al., Reference Canaza-Cayo, Huanca, Gutiérrez and Beltrán2015):
 $$\left( {\matrix{ {y_{1} } \cr {y_{2} } \cr } } \right){=}{\equals}\left( {\matrix{ {X_{1} } & 0 \cr 0 & {X_{2} } \cr } } \right)\left( {\matrix{ {\beta _{1} } \cr {\beta _{2} } \cr } } \right){\plus}\left( {\matrix{ {Z_{1} } & 0 \cr 0 & {Z_{2} } \cr } } \right)\left( {\matrix{ {u_{1} } \cr {u_{2} } \cr } } \right){\plus}\left( {\matrix{ {e_{1} } \cr {e_{2} } \cr } } \right)$$
where y 1 and y 2 are the vectors of observations for traits 1 (parameter a, b, m and k) and 2 (parameter a, b, m and k), respectively; β 1 and β 2 the vectors of fixed effects (herd, year of birth, month of birth, sex, birth type) for traits 1 and 2, respectively; u 1 and u 2 the vectors of random additive genetic effects, and e 1 and e 2 the residual effects for the traits 1 and 2, respectively; X 1 and X 2, and Z 1 and Z 2 the incidence matrices that associate the elements of β 1 and u 1, and β 2 and u 2, respectively, with y 1 and y 2. The variances and (co)variances of all random vectors are equal to:
 $${\rm Var}{\,=\,}{\equals}\left( {\matrix{ {u_{1} } \cr {u_{2} } \cr {e_{1} } \cr {e_{2} } \cr } } \right)\,\left( {\matrix{ {A\sigma ^{{\rm 2}} _{{a1}} } & {A\sigma _{{a1\,a2}} } & 0 & 0 \cr {A\sigma _{{a1\,a2}} } & {A\sigma ^{{\rm 2}} _{{a2}} } & 0 & 0 \cr 0 & 0 & {I\sigma ^{{\rm 2}} _{{e1}} } & {I\sigma _{{e1e2}} } \cr 0 & 0 & {I\sigma _{{e1e2}} } & {I\sigma ^{{\rm 2}} _{{e2}} } \cr } } \right)$$
where A is a Wright’s numerator relationship matrix, σ 2 a1 and σ 2 a2 the variances of the direct additive genetic effect; σ 2 e1 and σ 2 e2 the residual variances for traits 1 and 2, respectively; I the identity matrix. The genetic and environmental (co)variance between pairs of traits are σ a1 a2 and σ e1 e2, respectively.
Calculations were carried out using the Multiple Trait Derivate Free Restricted Maximum Likelihood (MTDFREML) program (Boldman et al., Reference Boldman, Kriese, Van Vleck, Van Tassell and Kachman1993), a set of programmes employing a simplex procedure to locate the maximum of the log likelihood (logL). Convergence was considered to be reached when the variance of function values (−2logL) in the simplex was <10−9. In the MTDFREML outputs, the population inbreeding average was near to 0, probably due to the large population size and the important number of herds under study.
Results and discussion
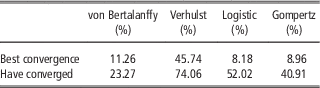
The Verhulst model presented the best convergence (45.74%), and the highest proportion of individual convergence (74.06%; Table 2).
Performance of models fitting

The Verhulst model is symmetrical regarding the inflection point; at this point, the function reached 50% from the asymptotic value (parameter a). In its first stage, it approaches to an exponential function with a constant relative growth rate. This model considers the growth rate proportional to the achieved growth and that which remains to be achieved (Goyache, Reference Goyache2005). Parameter b represents the asymptotic growth proportion that should be reached after birth, established by the initial weight and age values. The parameter k represents the relative growth rate; with k −1, we can calculate the time needed to reach maturity (McManus et al., Reference McManus, Evangelista, Fernandes, Miranda, Moreno-Bernal and Santos2003). High k values indicate animals with precocious maturity.
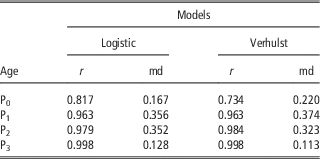
In general, the logistic model presented a better general efficiency according to the mean deviation between the predicted and observed weight and the correlation between them (Table 3); this was previously shown by Lupi et al. (Reference Lupi, Nogales, León, Barba and Delgado2015). In both cases, the efficiency increased from P0 to P3. These results support both equations as being suitable for the purposes of the present study.
Correlation (r) and mean deviation (md) between observed and predicted weights by both models, separated by age

P0= between 0 and 15 days old; P1=between 16 and 35 days; P2=between 36 and 55 days; P3=between 56 and 80 days.
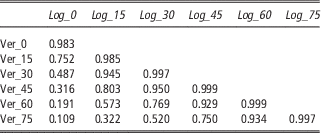
The effectiveness in the predictions is similar on both models, as it is evidenced by the strong correlations between the respective predicted weights at the different ages (Table 4).
Correlation between the predicted weight with both models (Verhulst and logistic) at 0, 15, 30, 45, 60 and 75 days of live

Log_0, Log_15, Log_30, Log_45, Log_60, Log_75 predicted weight with logistic model at 0, 15, 30, 45 60 and 75 days of live. Ver_0, Ver_15, Ver_30, Ver_45, Ver_60, Ver_75 predicted weight with Verhulst model at 0, 15, 30, 45 60 and 75 days of live.
The descriptive statistics of the curve parameters for both models are shown in Table 5. The a parameter is statistically homogeneous in both models. This parameter for asymptotic weight offered the best opportunity to make direct comparisons among all models as the other parameters measured slightly different phenomena (Brown et al., Reference Brown, Fitzhugh and Cartwright1976). The values of R 2 indicate that the proportion of variation explained was, in general, high for both models; the average R 2 values across all the growth curves were 0.996±0.02. The R 2 values were, in most cases, close to unity (the variance ratio or F-test reached a high level of significance for all the curves and models) and could be used only as an overall measure of fit rather than as a basis for model comparison, as also observed by López et al. (Reference López, France, Gerrits, Dhanoa, Humphries and Dijkstra2000).
Descriptive statistics of the curve parameters for logistic and Verhulst model for Segureña lambs

CV=coefficient of deviation; a=defined as the asymptotic value; b=allows calculation of the inflection age; k=relative growth; m=gives the shape of the growth curve; R 2=pseudo R 2 (determinative coefficient).
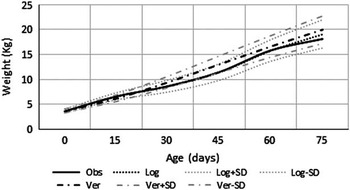
Parallelism between the performance of both models can be graphically observed in Figure 1. Weight averages estimated with both functions were similar and presented similar deviation regarding the observed weight. Unlike what presented by several authors (Brown et al., Reference Brown, Fitzhugh and Cartwright1976; Lambe et al., Reference Lambe, Navajas, Simm and Bünger2006) weights were underestimated at early ages and overestimated at slaughter age. It could be due to the restricted period of the animal life considered here, which is the commercial life, probably with the enlargement of the tested period to the whole life of the animals these bias could be balanced.
Curves obtained by observed weight average and estimated by logistic and Verhulst models (Supplementary Table S1).

Heritability (h 2) is defined as the proportion of phenotypic variance that is due to genetic additive diversity. Additive genetic correlations quantify the levels of linkage and pleiotropy existing among additive loci determining the performances of two different traits (Mekuriaw and Haile, Reference Mekuriaw and Haile2014).
Obviously, heritability and genetic correlations are important information among the factors determining genetic improvement in any trait (Mekuriaw and Haile, Reference Mekuriaw and Haile2014). So, the first step for introducing a new selection criteria into a breeding programme is the calculation of the genetic parameters of the trait.
BW and rate of gain are among the most economically important and easily measured traits of sheep; for this reason, weights and daily gains are the most common selection criteria in meat sheep breeding programmes. Knowledge of the particular trait and phase of the animals’ growth, which is the basis for selection, is the most important one. The potential for genetic improvement is largely dependent on the genetic parameters of the growth weight trait upon which selection may be applied (Mekuriaw and Haile, Reference Mekuriaw and Haile2014).
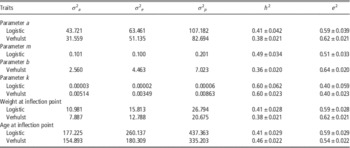
Results of the (co)variance components and genetic parameters estimation under the two different models are presented in Table 6. The heritability (h 2) estimates for the a, b and m parameters were important, in the range of 0.36±0.020 and 0.49±0.034; similar values for the asymptotic value were found by Hossein-Zadeh (Reference Hossein-Zadeh2015) in a study of Guilan sheep and by Lewis et al. (Reference Lewis, Emmans, Dingwall and Simm2002). For the parameter k, the heritability was high (0.60) in both models. These results are similar to those estimated by Bathaei and Leroy (Reference Bathaei and Leroy1998) for Mahraban Iranian sheep, but higher than the results presented by other studies (Lewis et al., Reference Lewis, Emmans, Dingwall and Simm2002; Abegaz et al., Reference Abegaz, Vanwyk and Jacobus2010; Méndez-Gomez et al., Reference Méndez-Gomez, López-Ordaz, Peralta-Laison, Ulloa-Arvizu, Pedraza-Villagómez, Ruiz-López, Berruecos-Villalobos and Vásquez-Peláez2014). If these results are translated to their biological meaning, we could interpret the asymptotic weight (a) and the maturing rate (k) showing important levels of additive variability, which implies an interesting suitability for selection. Maturing rate was more additively heritable, so the perspectives for selection over this trait are even more promising in this breed. The important positive additive genetic correlations between asymptotic growth proportion (b) and the rate of maturity (k) demonstrates the close relationship between the two parameters; a high asymptotic growth proportion implies a high rate of maturity, as expected. Other parameters, such as additive, environmental and phenotypic variance, present higher values in the logistic model for parameter a (43.721, 63.461 and 107.182) but lower for parameter k (0.00003), as shown in Table 6. This is explained by each models’ performance, which produced important differences in the estimation of these parameters. Similar values for maturity rate were found by Hossein-Zadeh (Reference Hossein-Zadeh2015) in a study of Guilan sheep.
Estimates of variance components, genetic parameters and genetic correlations of the estimated parameters for logistic and Verhulst models

σ 2 a =additive variance; σ 2 e =environmental variance; σ 2 p =phenotypic variance; h 2=heritability; e 2=environment proportion in the total variance.
With regard to the heritability (h 2) estimates for the inflection point, the estimates obtained for weight and age at the inflection point in the current study were moderate (0.41 for both with the logistic model and 0.38 and 0.46, respectively, with the Verhulst model); for weight inflexion, it was higher than the results presented by Méndez-Gomez et al. (Reference Méndez-Gomez, López-Ordaz, Peralta-Laison, Ulloa-Arvizu, Pedraza-Villagómez, Ruiz-López, Berruecos-Villalobos and Vásquez-Peláez2014) in their study of Chiapas lambs, but lower for the inflexion age.
However, an important point in the current study was the similar estimation of the genetic parameters for the four curve traits (a, b, m and k). This means that, independently of the volume of the variance components estimated for each model, the ratios between the phenotypic and the additive variance stayed constant. So, both models could supply information for breeding evaluation in the Segureño breeding programme.
Biologically, the most important relationship was between a and k. The negative additive genetic correlations (−0.82±0.098 and −0.70±0.071 for the logistic and Verhulst models, respectively) and phenotypic (−0.78 and −0.66, respectively) correlations between these two parameters indicated that animals with faster growth rates were less likely to attain as large a mature weight as those that grew more slowly in early life (Tables 7 and 8). In other words, animals that were heavy at maturity tended to have a slower growth rate and be relatively smaller in BW at earlier ages. This finding is in agreement with reports by Fitzhugh and Taylor (Reference Fitzhugh and Taylor1971) and Bathaei and Leroy (Reference Bathaei and Leroy1998), and is important information for the transmission of more profitable traits for early lamb growth. Hossein-Zadeh (Reference Hossein-Zadeh2015), in a study of Guilan sheep, found lowest values for the phenotypic correlations between a and k, but these were still negative according to our findings.
Estimates of heritability (diagonal), genetic (above diagonal) and phenotypic (below diagonal) correlations between logistic growth curve parameters in Segureño lambs

Wi=weight at inflection point; Ai=age at inflection point.
***P<0.001.
Estimates of heritability (diagonal), genetic (above diagonal) and phenotypic (below diagonal) correlations between Verhulst growth curve parameters in Segureño lambs

Wi=weight at inflection point; Ai=age at inflection point.
***P<0.001.
The moderate-to-high heritability and correlations among the growth curve parameters make it clear that genetic changes in growth patterns can be accomplished. An increase in mature weight is generally accompanied by a decrease in maturity rate (Bathaei and Leroy, Reference Bathaei and Leroy1998). The genetic correlation between mature weight (a) and rate of maturing (k) indicated a strong genetic antagonism (−0.82 and −0.70 for the logistic and the Verhulst model, respectively) between the two growth characteristics, suggesting that selection for early maturity would lead to lower mature weights. Lewis et al. (Reference Lewis, Emmans, Dingwall and Simm2002) and Abegaz et al. (Reference Abegaz, Vanwyk and Jacobus2010) presented a lower value for this genetic relationship in their studies. In other words, selection for increased growth or maturing rate tends to decrease mature weight (Bathaei and Leroy, Reference Bathaei and Leroy1998).
A model comparison based on the analysis of the estimates of growth parameters was performed to check whether the models gave similar or different estimates of these parameters. In the case of discrepancies among models of important biological significance, the function giving the most reliable estimates of the analysed growth traits should be chosen. Taking into account the similarity of the heritability and additive genetic correlations between both models, their capacities could be considered to be similar, but the data regarding the individual fit to each model recommend the Verhulst model because it maximizes the number of lambs reaching a complete fitness offering a more information for the genetic analysis.
Other growth traits can be computed for each animal using the corresponding estimates of the equations parameters, such as the maximum growth rate, average growth rate during postnatal growth or the time to half-final growth. These parameters are used to compare the genetic potential of animals and to understand the effects of genetic factors on growth; it is important to choose a model that provides accurate estimates of these parameters. The comparison between models in terms of estimating growth parameters revealed that, in spite of small differences between the values obtained with each model, ranking of animals according to those parameters was similar with both models, given the highly significant correlations observed between them (López et al., Reference López, France, Gerrits, Dhanoa, Humphries and Dijkstra2000).
Conclusions
According to the results, both equations tested here were suitable for our purposes, but we recommend the Verhulst model because it showed greater versatility, permitting the convergence of a larger number on individual lambs. It supposed a larger amount of information and, consequently, a greater precision in the estimates.
Growth curve parameters and especially their biological meaning are of great interest in Segureño sheep breeding programmes. In the present study, aspects such as asymptotic weight, growth rate, shape of the curve and inflection point have shown important levels of additive genetic variation. Therefore, these aspects have economic importance and offer excellent perspectives for genetic response to selection, so most of them should be introduced into the breeding programme as additional selection criteria. Additive genetic correlations were, in general, large, but diverse. This must be taken into account in the introduction of these new traits into the breeding programme, because desirable or undesirable indirect responses to selection will influence interactions among traits in the new growth curve trait breeding programme.
Focussing on this fact, any selective increase in early weights could be associated with an increase in mature weight, which entails an increase in feed cost in the flock. This is particularly important where supplementary feed costs constitute a relatively large proportion of the total costs. Selection could be made for animals with faster growth rate at an early age and/or that are early maturing. Faster growth rate increases the proportion of feed intake used for tissue synthesis and reduces total inputs/unit of weight gain.
Acknowledgements
The authors would like to acknowledge the dedication of all the Segureño farmers involved in the breeding programme. The authors are also grateful to all the technicians of the Segureña Breeders Association, but particularly to Pepe Puntas, the best president.
Supplementary material
To view supplementary material for this article, please visit http://dx.doi.org/10.1017/S1751731115002773