Introduction
The emerald ash borer, Agrilus planipennis Fairmaire (Coleoptera: Buprestidae), is a non-native species from Asia that kills thousands of ash trees (Fraxinus Linnaeus; Oleaceae) each year in North America (Cappaert et al. Reference Cappaert, McCullough, Poland and Siegert2005; Canadian Food Inspection Agency 2013). Several techniques have been developed to detect and survey A. planipennis populations (Cappaert et al. Reference Cappaert, McCullough, Poland and Siegert2005; Smitley et al. Reference Smitley, Davis and Rebek2008; McCullough et al. Reference McCullough, Poland and Cappaert2009; Ryall et al. Reference Ryall, Fidgen and Turgeon2011; reviewed in Ryall Reference Ryall2015), but there is no recognised sampling technique designed to obtain estimates of A. planipennis abundance on a live tree or to establish decision thresholds in the early stages of tree colonisation without adversely compromising tree health.
Colonisation of small (4 cm<diameter at breast height (dbh)<14 cm) red ash (synonym=green ash) (Fraxinus pennsylvanica Marshall) by A. planipennis starts predominantly on the bole (Timms et al. Reference Timms, Smith and de Groot2006), whereas that of semi-mature to mature ash (dbh>25 cm) typically begins higher on the bole or branches (Haack et al. Reference Haack, Jendek, Liu, Marchant, Petrice and Poland2002; Herms et al. Reference Herms, McCullough and Smitley2004; Cappaert et al. Reference Cappaert, McCullough, Poland and Siegert2005; Ryall et al. Reference Ryall, Fidgen and Turgeon2011). At that early stage of colonisation, infested trees are mostly asymptomatic because injury is inconspicuous and limited primarily to larval feeding (Cappaert et al. Reference Cappaert, McCullough, Poland and Siegert2005; Poland and McCullough Reference Poland and McCullough2006; Ryall et al. Reference Ryall, Fidgen and Turgeon2011): A. planipennis larvae feed and develop underneath the bark leaving a characteristic serpentine gallery on the outer sapwood of branches and the bole (Wilson and Rebek Reference Wilson and Rebek2005; Marshall et al. Reference Marshall, Storer, Fraser and Mastro2011; Foelker et al. Reference Foelker, Vandenberg, Whitmore and Fierke2013). As colonisation progresses, attacks spread to the lower bole and more obvious signs (adult exit holes), and symptoms (bark deformities such as splits and cracks, epicormic shoots, and crown dieback) of infestation appear (de Groot et al. Reference de Groot, Biggs, Lyons, Scarr, Czwerwinski and Evans2006; Poland and McCullough Reference Poland and McCullough2006; Lyons et al. Reference Lyons, Caister, de Groot, Hamilton, Marchant and Scarr2007).
Several techniques to detect and survey A. planipennis populations have been developed already (Cappaert et al. Reference Cappaert, McCullough, Poland and Siegert2005; Smitley et al. Reference Smitley, Davis and Rebek2008; McCullough et al. Reference McCullough, Poland and Cappaert2009; Ryall et al. Reference Ryall, Fidgen, Silk and Scarr2013). One technique currently used by some practitioners to detect A. planipennis infested trees in urban landscapes consists of sampling a “detection survey unit” (two 50-cm-long branch sections, each from the base of a mid-crown branch) and peeling its bark off in search of larval galleries (J. McNeil (Oakville, Ontario, Canada), J. Ric (Toronto, Ontario, Canada), A. Daniel (Montréal, Québec, Canada), and B. Pelot (Green Bay, Wisconsin, United States of America) (personal communications); McGowan et al. Reference McGowan, Byman, Francis, Hodge, Lidster and Rowlinosn2012; Ball Reference Ball2014; North Dakota State University 2014; Colorado Department of Agriculture 2015; Gannon et al. Reference Gannon, Kirby and Dooley2015). This technique, which does not compromise tree health, maximises detection rates of infested asymptomatic trees (Ryall et al. Reference Ryall, Fidgen and Turgeon2011). Whether statistically reliable and useful basic population estimates could be obtained from this detection survey unit has not been investigated.
Our primary objective was to study the distribution and abundance of A. planipennis larval galleries within the crown of open grown, infested and asymptomatic F. pennsylvanica for the purpose of obtaining reliable estimates from branch subsamples. We began by quantifying variation in abundance of A. planipennis larval galleries among branches within trees. After analysing these results, we recognised the need to establish the distribution and abundance of galleries within a branch. We used the latter results on within-branch abundance to establish the relationships between estimates of gallery density on an entire branch and subsamples of varying lengths from that branch. We also assessed the suitability, as determined by predictive power and efficiency (relative net precision (RNP)=relative variation (RV) versus cost), of sample units of different lengths in estimating gallery density per branch making it possible for practitioners to select one that matches desired precision and available resources.
Materials and methods
Study sites
This study follows-up that of Ryall et al. (Reference Ryall, Fidgen and Turgeon2011). In that study, we had intensively sampled open-grown F. pennsylvanica trees, 35–50-year-old, 24–34 cm in dbh, and 11–17 m in height, in autumn and winter between 2008 and 2011 in Sault Ste. Marie, Oakville, and Toronto (Ontario, Canada). At that time, these areas had light infestations of A. planipennis: more specifically, known signs or symptoms of injury were visible only on a handful of trees in each of these sites. We visually inspected the area surrounding these visibly infested trees in search of asymptomatic trees. We selected only those for which we could not detect from the ground any of the known characteristic signs or symptoms of A. planipennis injury (de Groot et al. Reference de Groot, Biggs, Lyons, Scarr, Czwerwinski and Evans2006). We kept all sampled branches at 4 °C until processed. We disposed of the remainder of any felled tree in accordance with the phytosanitary requirements established by the Canadian Food Inspection Agency (2014).
Distribution and abundance of larval galleries
To establish the within-crown distribution of A. planipennis galleries, we sampled six 3-m-long branches from asymptomatic trees: 83 in Toronto (2008 and 2009) and 11 in Oakville (2010) (hereafter the “crown” data set). We cut all branches proximal to the branch collar, where the branch joins the main stem. Sampling followed a stratified design, which included one branch from each of the upper, middle and lower crown of the north and south aspects of each tree. These six branches represented between 50% and 80% of all possible branches that could be sampled from these trees. We removed the bark, hereafter whittled, in 1–2 mm thick layers until we reached the sapwood to ensure we could locate all galleries, including those recently initiated by first instars, and to ascertain the precise location of gallery origin. We preserved in 70% ethanol all buprestid larvae and pupae found while whittling. Later, we verified their identity by comparing them to voucher specimens of known A. planipennis larvae. We obtained estimates per branch by adding up the number of galleries initiated on the first 25-cm section (S) of each m of branch length (i.e., S 0–25, S 100–125, and S 200–225: (S b–s ), where “b”=distance (cm) from base of branch where section begins (0=base of branch) and “s”=distance (cm) from base of branch where section stops). To standardise these estimates, we transformed the number of galleries per branch to the number of galleries per m2 of bark surface area as follows:
 $$G=n/[(\pi {\times}D{\times}L)/{\rm 1}0\:000]$$
where G is the gallery density (galleries/m2), n the number of galleries, D the diameter, including bark, at mid-point of subsample to the nearest 0.1 cm, L the length of sample to the nearest 0.1 cm, and “10 000” converts cm2 to m2.
To establish within-branch distribution and abundance of A. planipennis galleries, we sampled 65 branches at least 3-m long from trees in Oakville (n=11) and Sault Ste. Marie (n=30), Ontario (hereafter the “branch” data set). Once on the ground, we marked the vertical plane of each branch to separate the topside from the underside. In a few instances, we removed multiple (⩾2) branches per tree. We subdivided the basal 300 cm of each branch into 12 contiguous 25-cm-long sections (S 0–25, S 25–50, S 50–75, etc.) and discarded any distal portion exceeding 3 m. We measured the diameter at the base and tip of each 25-cm section to the nearest 0.1 cm before whittling it. We whittled one 25 cm section at a time and recorded the number of A. planipennis galleries initiated on the topside and underside of each section. We standardised these values using equation 1.
Length of sampling unit
We used results from the branch data set to study the influence of branch sample length on estimates of A. planipennis larval gallery/m2 of branch surface area. First, we established the relationship between gallery density on S 0–50, the length of the “detection survey unit” and that on the entire branch (S 0–300). Next, we examined the relationship between gallery density on the entire branch and on units longer than 50 cm, but shorter than 150 cm (see discussion for rationale). We obtained longer units by adding gallery counts from different combinations of 25 cm branch sections and transforming that number of galleries per branch using equation 1. For example, “S 0–50+S 75–100” and “S 0–50+S 125–150” are two combinations of a 75-cm-long unit.
Finally, we assessed the suitability of estimates from different combinations of 25 cm sections by comparing the predictive power (i.e., coefficient of determination or r 2) and efficiency (i.e., RNP) of each combination. Relative net precision takes into account the interaction between RV and cost. We arbitrarily required that the combination of branch sections sampled provide density estimates with r 2⩾80%. We calculated RV using the following formula (Ruesink Reference Ruesink1980):
 $${\rm RV}={\rm 1}00{\times}({\rm SE}/m)$$
where SE is the standard error, as determined from the square root of the regression mean square error (σ ε; Binns et al. Reference Binns, Nyrop and van der Werf2000), and m was the average density of A. planipennis galleries on a 300-cm branch. We pre-specified an RV of 30% or less as acceptable for management purposes (Karandinos Reference Karandinos1976). To calculate RNP, we used the formula in Ruesink (Reference Ruesink1980):
 $${\rm RNP}=({\rm 1}00/[{\rm RV}{\times}{\rm C}_{s} ])$$
where C s is the cost to complete processing of a prospective sample. To estimate costs, we recorded the time to whittle each 25-cm section, and converted to dollars using an estimate of CAD$25 per hour. For example, the time to whittle and handle S 0–50 with a density of 0–8 galleries was ~13 minutes; thus, the cost would be CAD$5.42 per detection survey unit sampled. All other costs, such as travel times and incidentals, are fixed and therefore not considered in these estimates. We considered combinations of branch sections with higher RNP values as more efficient (Ruesink Reference Ruesink1980; Sane et al. Reference Sane, Alverson and Chapin1999).
Data analysis
We used paired t-tests (PROC TTEST; SAS Institute 2006) to determine if a significant proportion of the variation in gallery abundance was attributable to their position in relation to the branch’s vertical plane (e.g., topside versus underside of branch) for all infested sections in the branch data set. We used the GLM procedure to determine if a significant proportion of the variation in gallery abundance per branch was attributable to the crown×aspect interaction with tree as a blocking factor (SAS Institute 2006). We also used PROC GLM to determine if a significant proportion of the variation in gallery density was attributable to the branch section sampled (SAS Institute 2006). We established the relationship between gallery density on S 0–50 and that on S 0–300 using a simple linear regression (PROC REG; SAS Institute 2006). We used the same procedure to evaluate goodness-of-fit regarding comparisons of the various combinations of sections sampled and gallery abundance calculated for the entire branch (S 0–300). Residuals were tested for significant departure from normality before and after data transformation using the Shapiro–Wilk and Kolmogorov–Smirnov tests (PROC univariate; SAS Institute 2006). All analyses were considered significant at the 5% probability level. If significance was detected in any of the analyses above, Tukey’s honest significant difference tests were used to separate means at P=0.05 or less (Zar Reference Zar1984). Unless otherwise stated, data are reported as raw means±SE.
Results
Distribution and abundance of larval galleries
Crown data set: gallery density in the 94 sampled trees varied between 0 and 126/m2 of branch surface area. We excluded from this data set trees with a density of zero or greater than 100 galleries per m2, resulting in final sample sizes of 10 and 34 trees for Oakville and Toronto, respectively. The high density cut-off was necessary to maintain confidence in predictive power of counts of intertwined galleries and to ensure determination of gallery origin was not compromised.
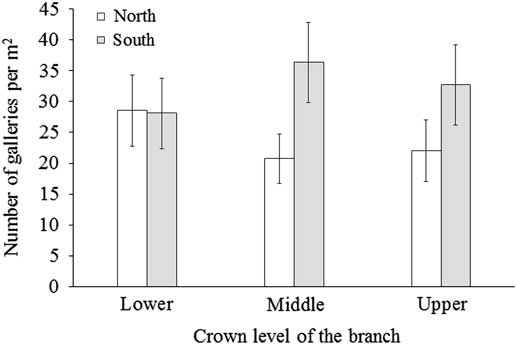
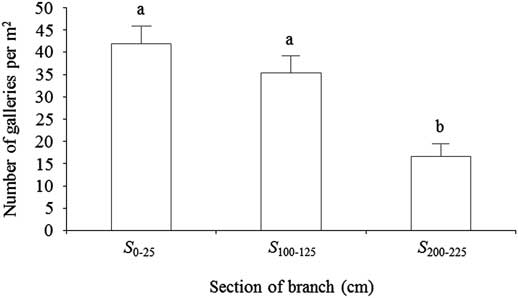
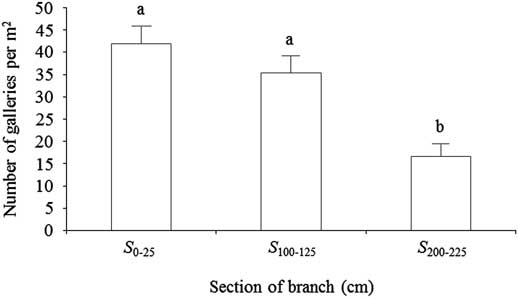
Crown level, aspect, and their interaction did not explain a significant proportion of the variation in gallery density within the crown of F. pennsylvanica (F(2,203)=0.27, P=0.77; F(1,203)=3.35, P=0.07; and F(2,186)=1.32, P=0.27, respectively) (Fig. 1). The only significant difference in gallery abundance was on middle crown branches, where density was marginally higher on branches sampled from the south than on those from the north aspect (t=2.01, P=0.047, df=83) (Fig. 1). Branch section explained a significant proportion of the variation in gallery density (F(2,345)=43.66, P<0.0001): we observed significantly higher densities on S 0–25 and S 100–125 than on S 200–225 (Fig. 2).
Mean (±SE) density of Agrilus planipennis galleries on branches sampled from the lower, middle, and upper crown and the north and south aspect of Fraxinus pennsylvanica (n=10 trees from Oakville and 34 trees from Toronto; 0<gallery density per m2⩽100) in two municipalities of Ontario, Canada, in 2008 and 2009.

Mean (±SE) density of Agrilus planipennis galleries on the first 25-cm section (S b–s , where “b”=distance (cm) from base of branch where section begins (0=base of branch) and “s”=distance (cm) from base of branch where section stops) of each 1 m of branch length (S 0–25, S 100–125, and S 200–225) sampled from Fraxinus pennsylvanica (n=10 trees from Oakville and 34 trees from Toronto; 0<gallery density per m2⩽100) in two municipalities of Ontario, Canada, in 2008 and 2009.
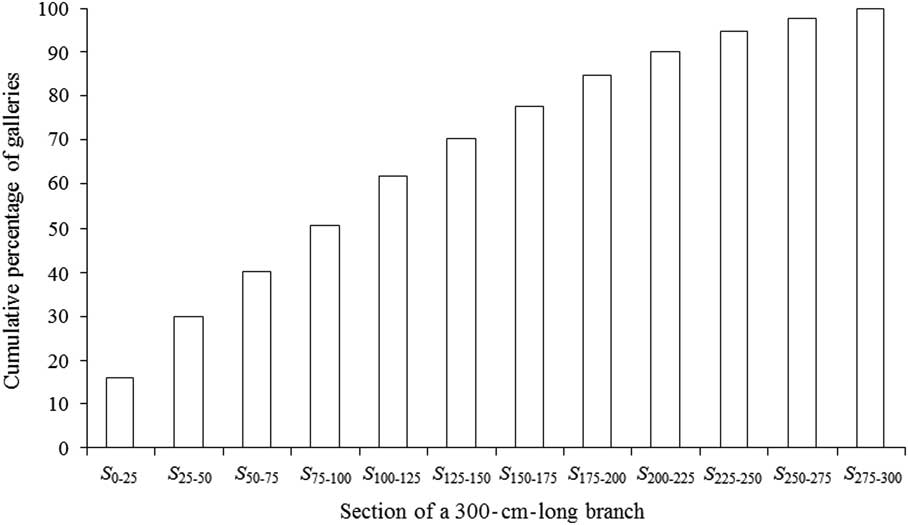
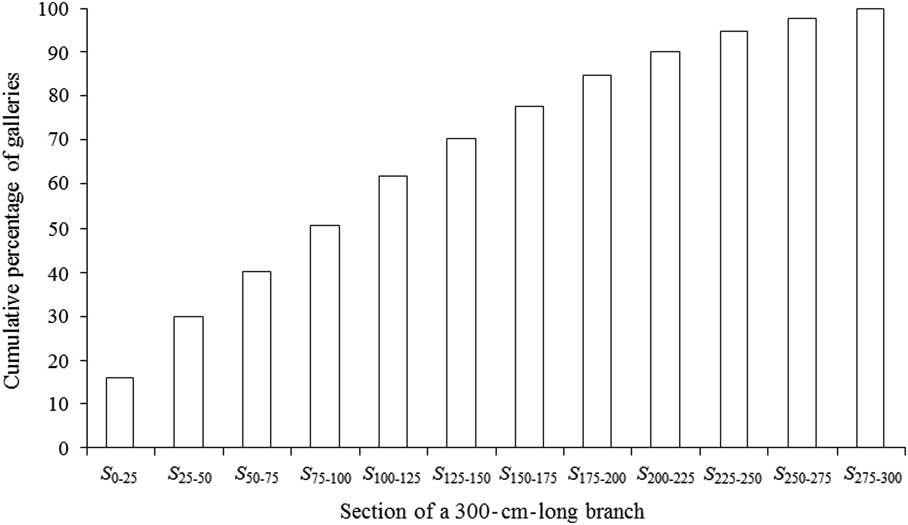
Branch data set: the average diameter at the base and tip of the 65 branches from the branch data set were 8.8±0.4 cm (range: 4.4–21.8 cm) and 3.8±0.2 cm (range: 1.9–9.2 cm), respectively. We found galleries in all 12 of the 25-cm sections from 300-cm-long branches, but not all infested branches had galleries in all 12 sections: we found ~70% of all galleries in the first six 25-cm-long sections (S 0–150; Fig. 3). The number of galleries per 25-cm section was higher on the topside (1.91±0.10 galleries per m2) than the underside (0.96±0.05 galleries per m2) of infested branches (t=8.58, P<0.0001, df=1, 399).
Cumulative percentage of Agrilus planipennis galleries for each 25-cm section (S b–s , where “b”=distance (cm) from base of branch where section begins (0=base of branch) and “s”=distance (cm) from base of branch where section stops) of 300-cm-long branches of Fraxinus pennsylvanica sampled in Ontario, Canada (n=65 branches).
Length of sampling unit
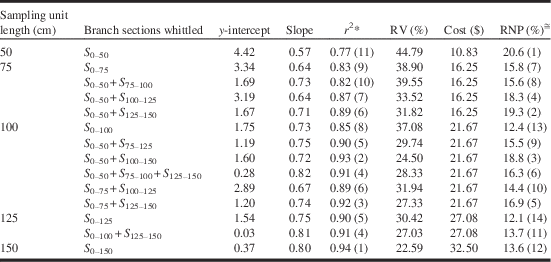
We limited our evaluation to sections from the basal 150 cm of 300-cm-long branches because A. planipennis gallery abundance on the basal half, S 0–150, exceeded 70% of, and was strongly related to, the density on the entire branch, S 0–300 (r 2=0.94): both values increased marginallly beyond that point. The suitability (r 2 and RNP) of A. planipennis gallery estimates for sample units of increasing lengths (e.g., 75, 100, or 125 cm) varied greatly when different 25 cm sections were sampled (Table 1). Only a handful of the estimates had RV equal to or below our pre-specified value of 30%: four of the six combinations of a 100-cm-long sample unit, one of the two 125-cm-long unit combinations and the 150-cm-long unit. The length of detection survey unit, S 0–50, provided the lowest predictive power (r 2=0.77), but the highest efficiency (RNP=20.6%; Table 1). Conversely, whittling 150-cm-long sample units, S 0–150, provided the highest predictive power (r 2=0.94), but the third lowest efficiency (RNP=13.6%) of all unit lengths and combinations. The most suitable combination of a 100-cm-long unit was “S 0–50+S 100–150”, which had the second highest predictive power (r 2=0.93) and the third highest efficiency (RNP=18.8%). The most suitable combination for a 75-cm-long unit was “S 0–50+S 125–150” which had the sixth highest predictive power (r 2=0.89) and the second highest efficiency (RNP=19.3%).
Regression parameters (intercept and slope) and predictive power (r 2), relative variation (RV), costs and efficiency (RNP) for estimates of Agrilus planipennis larval gallery/m2 of branch surface area on 300-cm-long branches (n=65) when whittling various combinations of 25-cm-long sections for total sampling unit lengths of 75, 100, 125, and 150 cm.

Notes: For each sampling unit length⩾75 cm, only combinations of branch sections with r 2>0.80 are presented and compared to that of the 50-cm-long A. planipennis detection survey unit, S 0–50, developed by Ryall et al. (Reference Ryall, Fidgen and Turgeon2011). Values of RV in bold font meet our pre-specified level of 30% or less, which is considered as acceptable for management purposes (Karandinos Reference Karandinos1976).
* Ranking from most (1) to least (11) accurate is given in brackets.
≅ Ranking from most (1) to least (14) efficient is given in brackets.
Discussion
Our results from both the branch and crown data sets showed that branch section was a significant source of variation in A. planipennis gallery abundance. Results from the branch data set showed that the vertical plane of a branch was another significant source of variation. Combined, these results clearly suggest that sampling only the proximal section of branches would over-estimate gallery densities per branch and sampling only the topside of a branch, although efficient, is a poor predictor of gallery density of the topside and underside branch surfaces. We were able to correct the bias of sampling only the basal 150-cm-long portion of branches using the strong correlations between A. planipennis gallery density on those proximal sections and that on a 3-m-long branch. Overall, whittling more branch sections from that proximal 150 cm to assess gallery density per branch, or the equivalent of taking longer samples, resulted in increased predictive power and precision of density estimates when compared to those obtained with the length of the detection survey unit (S 0–50) developed by Ryall et al. (Reference Ryall, Fidgen and Turgeon2011). For most of the branches we examined, coarse bark was almost always noted around the proximal end of the branch and on the upper half of the circumference, decreasing in prevalence with increasing distance from the proximal end. These results are consistent with previous reports (Timms et al. Reference Timms, Smith and de Groot2006; Anulewicz et al. Reference Anulewicz, McCullough and Cappaert2007; Marshall et al. Reference Marshall, Storer, Fraser and Mastro2011; Foelker et al. Reference Foelker, Vandenberg, Whitmore and Fierke2013) and the hypothesis that gallery distribution and abundance on branches is linked to bark texture, more specifically bark roughness. This hypothesis is also consistent with results reported by Marshall et al. (Reference Marshall, Smith, Mech and Storer2013) who compared diameter at breast height and bark roughness of dead and live ash trees over a large geographic area and concluded that the probability of ash mortality increased with increasing bark roughness. Whether bark roughness represents a microhabitat facilitating oviposition or development rate and survival of immature stages remains to be determined.
Crown level and aspect appeared of little importance when estimating gallery abundance on branches with basal diameters between 5 cm and 21 cm. Whether this result is because trees were open-grown and access to sunlight or thermal energy from the sun was likely not a limiting factor to oviposition preference or development of immature A. planipennis or because these indices were derived by whittling the first 25 cm section of each m of branch length (S 0–25, S 100–125, and S 200–225) rather than the first 150 cm S 0–150 is unknown. A look at the regression parameters (y=0.70x–4.90, P<0.0001, MSE=9.35), predictive power (r 2=0.87), relative variation (RV=33.90), and costs and efficiency (RNP=13.6%) associated with S 0–25, S 100–125, and S 200–225 revealed an efficiency similar to that of S 0–150 and a predictive power and error rate similar to other 75-cm-long sampling units (Table 1).
We obtained estimates of A. planipennis larval gallery by sampling branches from asymptomatic trees, 24–34 cm in dbh located near known infested trees growing in urban landscapes. Ours is not the first attempt at obtaining estimates for this beetle. Other types of estimates were obtained from trees in forested or peri-urban landscapes using a variety of techniques (e.g., counting exit holes, old galleries, incomplete galleries, etc.,) and approaches (e.g., counting galleries or exit holes only on a specific surface area of the bole, or on the bole and branches of differing order or lengths with different minimal branch diameter) (Timms et al. Reference Timms, Smith and de Groot2006; McCullough and Siegert Reference McCullough and Siegert2007; McKenzie et al. Reference McKenzie, Helson, Thompson, Otis, McFarlane and Buscarini2010; Siegert et al. Reference Siegert, McCullough, Williams, Fraser, Poland and Pierce2010; Smitley et al. Reference Smitley, Doccola and Cox2010a, Reference Smitley, Rebek, Royalty, Davis and Newhouse2010b; Mercader et al. Reference Mercader, Siegert and McCullough2012; Foelker et al. Reference Foelker, Vandenberg, Whitmore and Fierke2013). In most instances, these estimates were converted to similar types of units (holes or galleries per m2); however, we believe it would be inappropriate to compare them because it is unlikely that estimates from the bole or from a combination of bole and branch samples taken from felled or girdled trees could be equated to, or have the same biological significance and importance as those derived exclusively from branch samples from asymptomatic live trees. Thus, the next step should focus on the development of a method to predict sampling intensity (number of branches per tree and number of trees per site) based on the mean:variance relationship for average gallery density and variances among branches and trees.
Obtaining estimates of A. planipennis larval gallery from a branch is a relatively simple process: it requires tools to access the crown (e.g., a pole saw or a lift), removal and whittling of the branches, and disposal of branch waste. This process should not compromise tree health as drastically as other proposed methods where trees are felled or the bole is girdled to attract beetles (see Marshall et al. Reference Marshall, Storer, Fraser and Mastro2011; Mercader et al. Reference Mercader, Siegert and McCullough2012). Currently, some practitioners have already incorporated into their tree maintenance or sanitation programme the practice of removing two 50-cm-long branch sections, each from the base of one mid-crown branch of an asymptomatic ash trees and whittling them to detect A. planipennis before chipping them (J. McNeil (Oakville, Ontario), J. Ric (Toronto, Ontario), A. Daniel (Montréal, Québec), and B. Pelot (Green Bay, Wisconsin), personal communications). Because estimates have a value as a basis for management decisions (Pedigo Reference Pedigo2002), it may make sense for those already collecting this detection survey unit to take the extra step of recording the number of galleries rather than just noting presence or absence of galleries and stopping whittling when the first gallery is found. It is unknown at this time if gallery estimates based on two 50–150-cm-long branches would be accurate enough to extrapolate useful gallery density per branch within the crown or for a site; however, if we assume it was, practitioners could use such estimates to delineate areas with trees that are un-infested, asymptomatic with low, moderate or high gallery densities or symptomatic. This information on infestation severity could then be used to allocate and prioritise treatments.
The task of sampling branches to estimate larval gallery/m2 of branch surface area could also be incorporated into existing decision guides for managing A. planipennis (Nagel and Sadof Reference Nagel and Sadof2013) and provide additional insight into the most appropriate treatment method for each tree condition. In addition to affecting tree health, A. planipennis larval galleries can interfere with the uptake of injected insecticides and thus reduce treatment efficacy (Herms et al. Reference Herms, McCullough, Smitley, Sadof, Williamson and Nixon2009; McKenzie et al. Reference McKenzie, Helson, Thompson, Otis, McFarlane and Buscarini2010; Smitley et al. Reference Smitley, Doccola and Cox2010a, Reference Smitley, Rebek, Royalty, Davis and Newhouse2010b; McCullough et al. Reference McCullough, Poland, Anulewicz, Lewis and Cappaert2011). Thus, knowledge of the gallery density in branches at which infested F. pennsylvanica trees of various ages or sizes can recover if treated could help practitioners select the most appropriate option (e.g., no action this year, inject with insecticide, or fell and chip) and plan the timing of these treatments. This knowledge would also remove the need to wait for the appearance of symptoms of decline, which typically appear a few years after galleries are created (Lyons et al. Reference Lyons, Caister, de Groot, Hamilton, Marchant and Scarr2007), before making a decision on whether early remedial treatment is necessary, possible or effective. Whether a comparison of pre-treatment and post-treatment estimates of larval gallery/m2 of branch surface area within a tree targeted for treatment, rather than from surrounding trees (McCullough et al. Reference McCullough, Poland, Anulewicz, Lewis and Cappaert2011), could improve assessment of insecticide efficacy without compromising tree health remains to be determined.
This work is complementary to that of Ryall et al. (Reference Ryall, Fidgen and Turgeon2011) which described the use of branch sampling to detect the presence of A. planipennis in ash trees. Herein, we provided baseline data on how to obtain estimates of A. planipennis larval gallery/m2 of branch surface area from sections of a branch of a non-girdled, asymptomatic tree for use in management programmes, particularly those in urban areas with high-valued street trees. In addition, we have presented the predictive power and efficiency associated with sampling units of increasing lengths to assess these estimates. All of these estimates can be obtained from the basal 150 cm of a branch, a sample size that is far more convenient and less time consuming to cut, handle and process than a 300-cm-long branch. Our results can be used by practitioners to develop a branch sampling programme tailored to their objectives, needs and resources. More specifically, if practitioners want estimates with a predictive power and precision levels higher than those provided by the detection survey unit (S 0–50 from two branches), they simply need to increase the number of 25-cm sections whittled per branch, as reported here, or increase the number of branches sampled per tree (K.L.R., personal observation). An incidental benefit of whittling additional 25-cm sections per branch beyond S 0–50 is that detectability of low level infestations can be improved. For example, based on our branch data set, whittling an additional 25-cm section per branch from two branches improved detectability of low level A. planipennis infested trees (<20 galleries/m2) by 21.3%.
Finally, it is worth emphasising that sampling branches to detect infested trees or to obtain estimates of gallery density per branch with known predictive power and RNP, can occur before trees show outward signs or symptoms of A. planipennis attack. That distinctive feature has the potential to improve decision-making by practitioners managing A. planipennis infestations in urban centers.
Acknowledgements
The authors thank B. Gasman (Canadian Food Inspection Agency (CFIA)) for instigating this study; J. Doyle, J. Ric, and R. Ubbens (Toronto), R. Traviligni and D. Dzama (Sault Ste. Marie), and J. McNeil (Oakville) for permission to sample trees and for providing access to indoor work facilities; H. Evans, C. Jones, and A. Keizer (Natural Resources Canada (NRCan)) for technical assistance with laboratory and field work; P. Hodge, E. Cleland, S. McGowan, and E. Czerwinski (Ontario Ministry of Natural Resources and Forestry (OMNRF)) for assistance with data collection; L. Fidgen for assistance with whittling; J. Sweeney and D. Pitt (NRCan) and two anonymous referees for reviewing an earlier version of this manuscript and providing valuable suggestions for improvement. Funding for this project was provided by NRCan, the CFIA, and the OMNRF. In kind support was provided by staff from the municipalities of Toronto, Oakville and Sault Ste. Marie.