INTRODUCTION
The Great Basin of the western United States contained more than 60 pluvial lakes during the late Pleistocene (e.g., Smith and Street-Perrot, Reference Smith, Street-Perrott and Porter1983; Benson and Thompson, Reference Benson, Thompson, Ruddiman and Wright1987; Morrison, Reference Morrison and Morrison1991; Negrini, Reference Negrini, Hershler, Madsen and Currey2002; Reheis et al., Reference Reheis, Adams, Oviatt and Bacon2014). Lake levels in each of these basins fluctuated according to prevailing climate conditions in their respective drainage basins. By the end of the Pleistocene, however, most of these lakes were greatly diminished from their late Pleistocene high stands of just a few thousand years before or had completely evaporated. Only a handful of these basins contained lakes during the Holocene, and fewer still maintained lakes into the historical period.
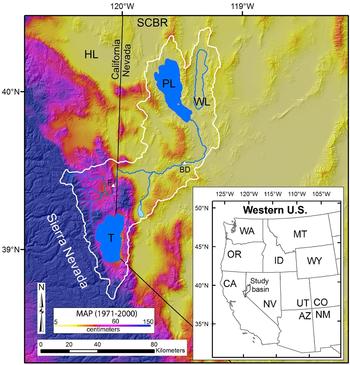
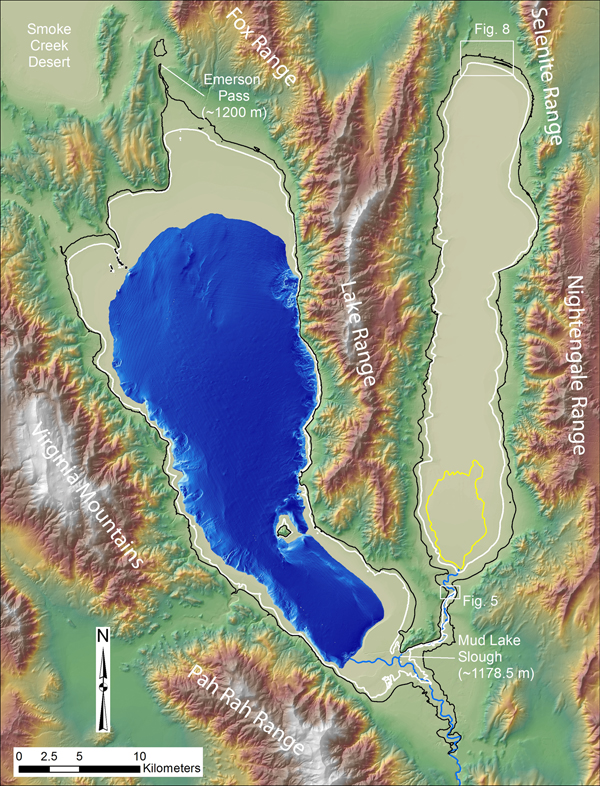
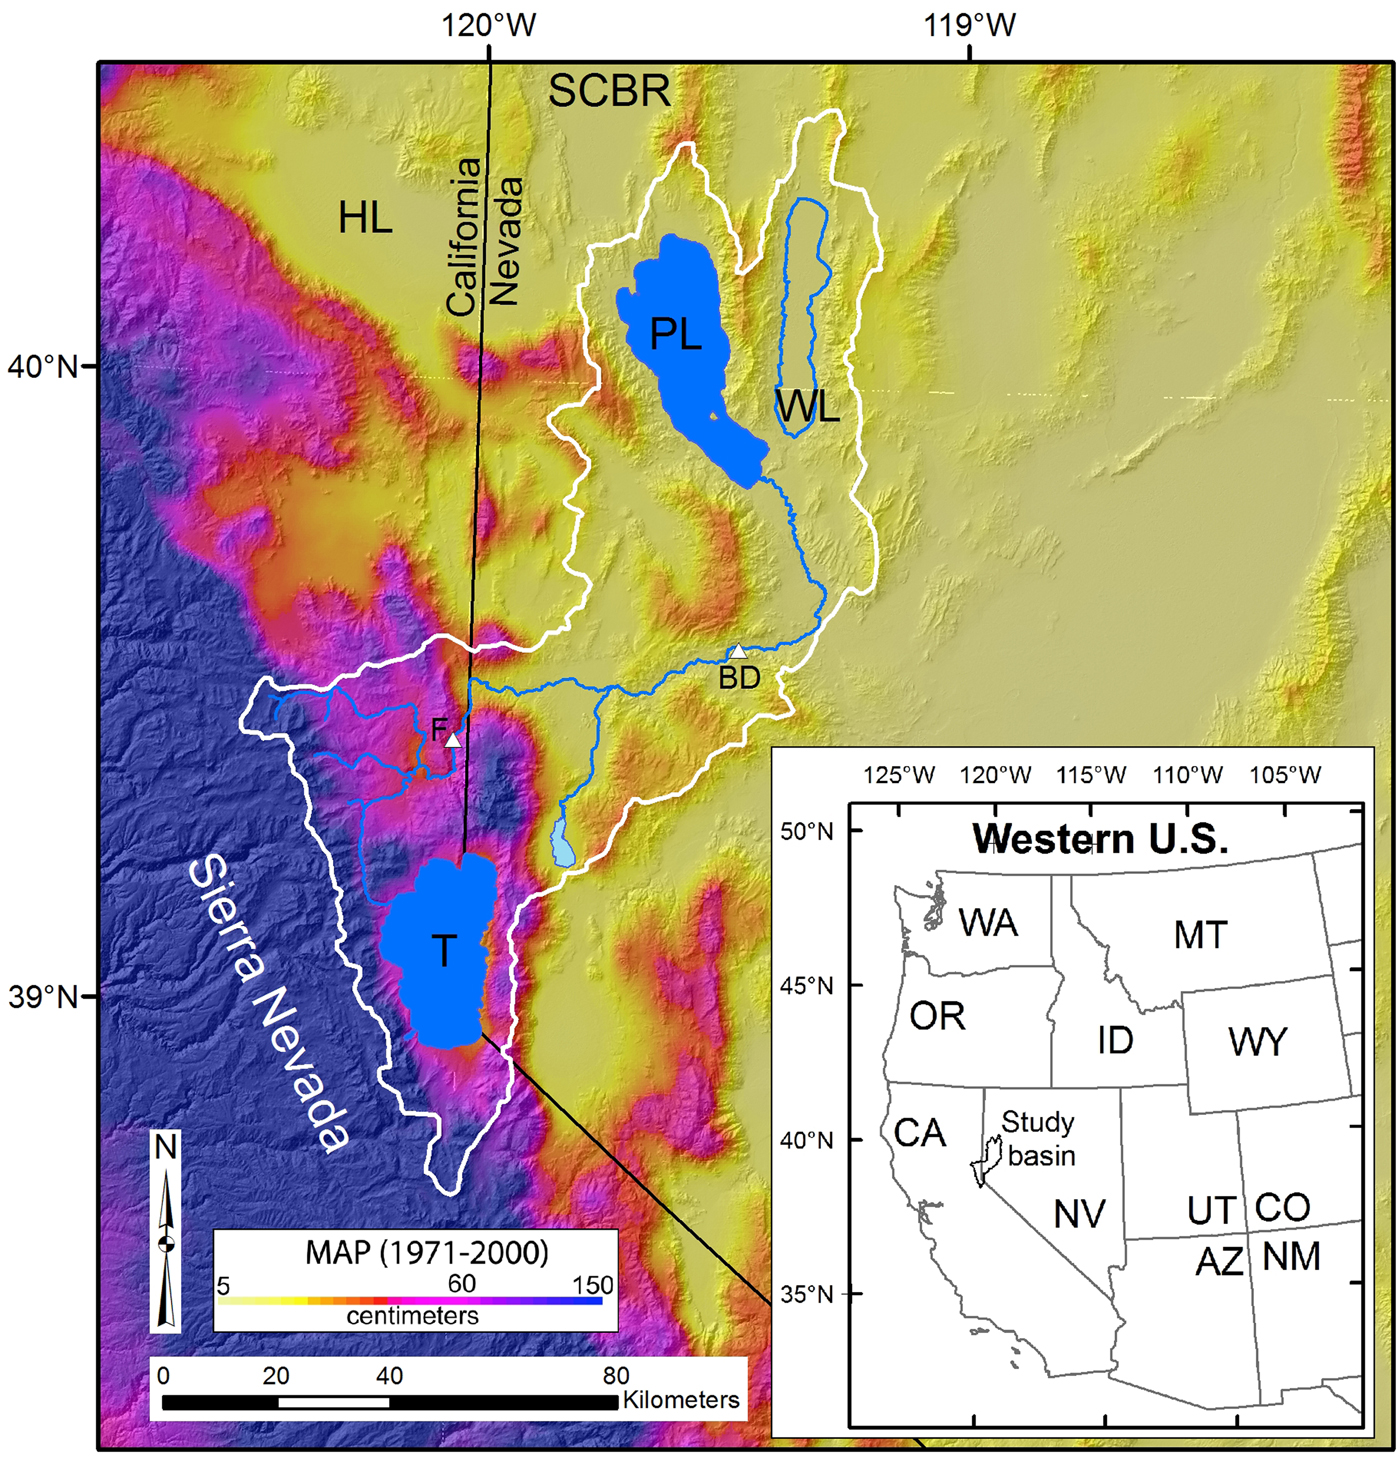
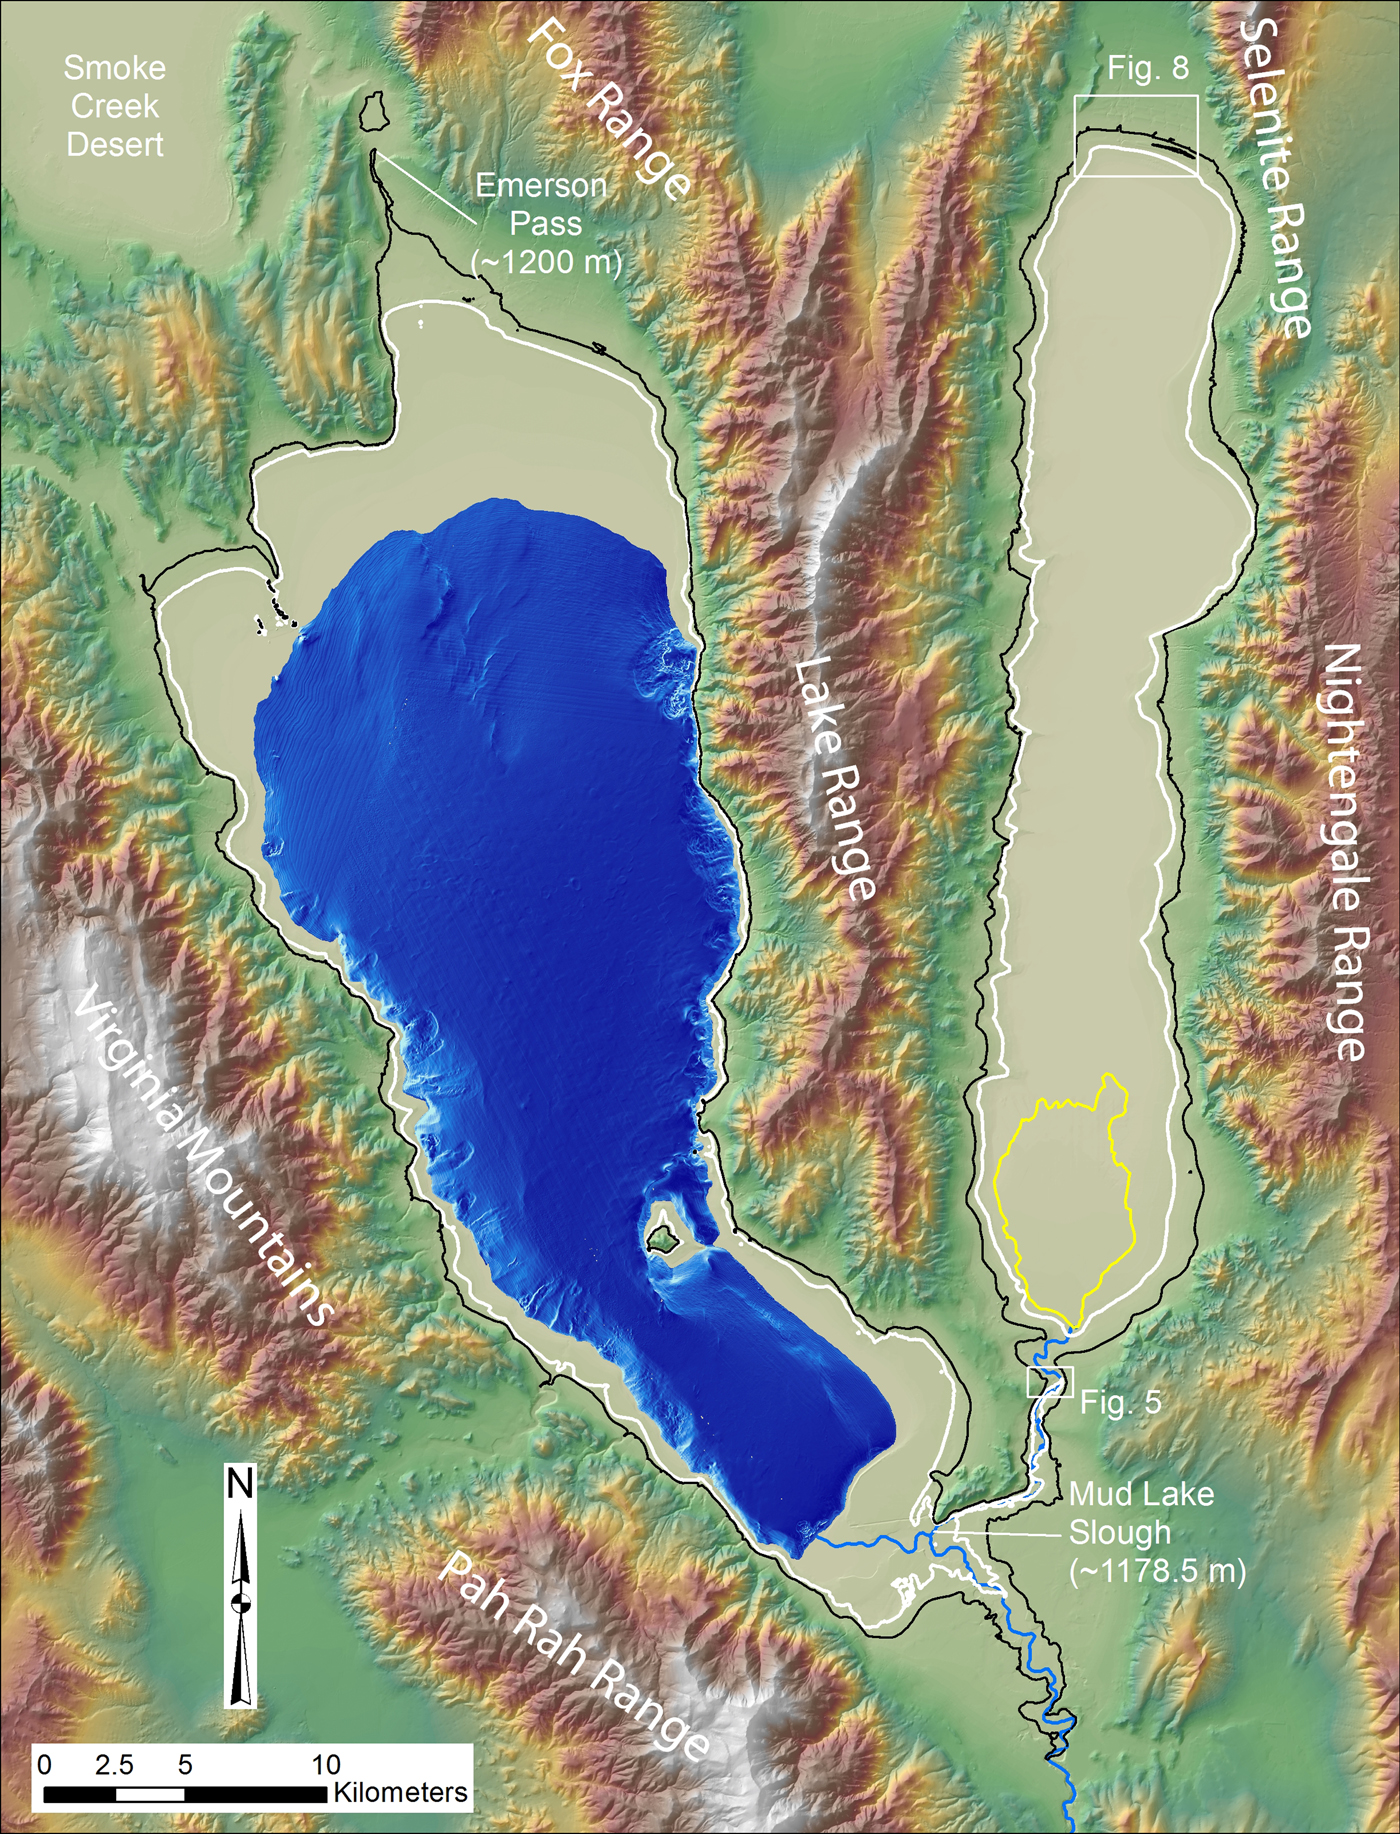
Pyramid Lake in western Nevada is the third largest perennial lake in the Great Basin today, behind Great Salt Lake and Lake Tahoe, and represents a remnant of pluvial Lake Lahontan that has existed throughout the Holocene and into the historical period (Fig. 1) (Benson and Thompson, Reference Benson, Thompson, Ruddiman and Wright1987). Its sister basin, Winnemucca Lake, is located directly to the east and also contained a relatively large lake in the early historical period (Russell, Reference Russell1885; Hardman and Venstrom, Reference Hardman and Venstrom1941; Harding, Reference Harding1965) and at other discrete times during the Holocene (Hattori, Reference Hattori1982; Hattori and Tuohy, Reference Hattori and Tuohy1993) but is currently dry because of upstream water diversions. These two terminal basins are connected by a low sill (Mud Lake Slough; ~1178.5 m) and can be thought of as the same lake system when lake levels were moderately high (Fig. 2).
(color online) Overview map of the Truckee River drainage basin (thin white line) showing the locations of Pyramid (PL) and Winnemucca (WL) lakes in the lower basin and Lake Tahoe (T) near the headwaters. BD, Below Derby gauge; F, Farad gauge; HL, Honey Lake, SCBR, Smoke Creek–Black Rock Desert. The background is mean annual PRISM (Parameter-elevation Relationships on Independent Slopes Model) precipitation map (Daly et al., Reference Daly, Halbleib, Smith, Gibson, Doggett and Taylor2008). The inset map shows the location of the Truckee River basin with respect to the western United States.
Overview map of the Pyramid Lake and Winnemucca Lake basins showing the distribution of geographic features mentioned in the text. Pyramid Lake is shown at the 1160 m level with hill-shaded bathymetry after Eisses et al. (Reference Eisses, Kell, Kent, Driscoll, Baskin, Smith, Karlin, Louie and Pullammanappallil2015). The thin white line shows the extent of the historic high stands at Pyramid (1182 m) and Winnemucca (1175 m) lakes, and the thin black line shows the extent of the integrated lake basins when they were at an elevation of 1200 m. The thin yellow line shows the extent of the fan delta emanating from the north end of Mud Lake Slough. Locations of Figures 5 and 8 are also shown. (For interpretation of the references to color in this figure legend, the reader is referred to the web version of this article.)
This combined lake system likely has preserved a continuous record of climate change from the Pleistocene to the modern era that reflects changing conditions within its watershed, which includes Lake Tahoe and the northern Sierra Nevada (Fig. 1). Although Pyramid and Winnemucca lakes reside in Nevada, deciphering their past lake-level fluctuations is highly relevant for understanding long-term water supply fluctuations in northern California as well, because most of the water for these lakes is derived from near the crest of the Sierra Nevada. Therefore, the aim of this article is to present a well-constrained lake-level curve for Pyramid and Winnemucca lakes that is based on dated shorelines and other indicators of changing lake levels over the last 16,000 years, from the time of the Lake Lahontan high stand to the present. The emphasis, however, is placed on the late Holocene part of the record because this information is important for defining natural hydrologic variability that is possible under modern and future climatic conditions.
GEOLOGIC SETTING, CLIMATE, AND HYDROLOGY
Pyramid and Winnemucca basins are located at the terminus of the Truckee River, whose headwaters are Lake Tahoe and other tributaries draining the Sierra Nevada crest (Fig. 1). This river is the only significant source of inflow to Pyramid and Winnemucca lakes on a volumetric basis. The drainage basin encompasses about 7050 km2, and most of the flow in the river is derived from the highest parts of the basin (>2500 m) where mean annual precipitation ranges from about 150 to 170 cm/yr (Daly et al., Reference Daly, Halbleib, Smith, Gibson, Doggett and Taylor2008), falling mostly as snow in the winter months that subsequently melts in the spring (Fig. 1). Precipitation at Pyramid Lake (~1160 m) is much less and ranges from about 16 to 20 cm/yr (Daly et al., Reference Daly, Halbleib, Smith, Gibson, Doggett and Taylor2008). In contrast, mean annual lake evaporation at Pyramid Lake is reported to average about 125–135 cm/yr (Houghton et al., Reference Houghton, Sakamoto and Gifford1975; Milne, Reference Milne1987).
Flows down the Truckee River during spring snowmelt typically range from 60 to 120 m3/s, but over the last 100 yr or so, large floods of >300 m3/s have occurred every 10 or 20 yr because of heavy rains or rain-on-snow events (Horton, Reference Horton1997; Adams, Reference Adams2012b). In terms of flow volumes, the mean annual natural flow of the Truckee over the last 100 yr is about 0.67 km3, ranging from 2.2 km3 (1983) to 0.16 km3 (1931) (Fig. 3) (data accessed December 17, 2017, from U.S. Geological Survey gauge 10346000, Truckee River at Farad). The Truckee delivered about 1.7 km3 of water to Pyramid Lake during the 2017 water year (WY), leading to a lake-level rise of about 3 m from a historically wet winter (Fig. 4). Because all of the upstream reservoirs on the Truckee River were at very low levels at the beginning of the 2017 WY, attributable to drought (WY 2011–2015), the total water delivered to Pyramid Lake in 2017 may have exceeded the 1983 volume, if there were no upstream impoundments or diversions.
Annual discharge volumes for two points along the Truckee River. The Farad gauge record represents discharge in the upper part of the basin, upstream of the largest withdrawals, and the Below Derby gauge record represents discharge that actually reaches Pyramid Lake. Locations of gauges are shown in Figure 1.

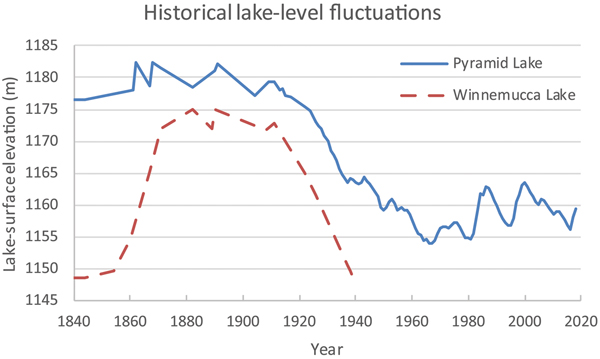
(color online) Historical lake-level changes at Pyramid and Winnemucca Lakes from the mid-nineteenth century to the present. Data from Hardman and Venstrom (Reference Hardman and Venstrom1941) and the U.S. Geological Survey (https://waterdata.usgs.gov/nv/nwis/inventory/?site_no=10336500&agency_cd=USGS). Derby Dam, where about 50% of the mean annual discharge of the Truckee River is diverted, was installed in 1906.

The Pyramid and Winnemucca basins straddle the boundary between the primarily right-oblique Walker Lane belt to the west (Stewart, Reference Stewart and Ernst1988; Wesnousky, Reference Wesnousky2005) and the Basin and Range Province to the east, which is characterized more by east–west directed extension (Stewart, Reference Stewart, Smith and Eaton1978; Unruh et al., Reference Unruh, Humphrey and Barron2003). The Virginia Mountains and Pah Rah Range, to the west and southwest of Pyramid Lake, respectively (Fig. 2), are primarily composed of Tertiary volcanic rocks, as is the Lake Range that separates the Pyramid and Winnemucca basins (Bonham and Papke, Reference Bonham and Papke1969). The Nightingale Range to the east of Winnemucca Lake is composed of Mesozoic metasedimentary rocks and younger Mesozoic granitics, overlain in places by Tertiary volcanic rocks (Van Buer, Reference Van Buer2012).
PREVIOUS WORK
Early historical lake-level fluctuations at Pyramid and Winnemucca lakes, prior to large-scale diversions, provide a frame of reference for the magnitude of Holocene fluctuations. Russell (Reference Russell1885) produced detailed maps of the hydrography of these basins that show how large the water bodies were in 1882. At that time, Pyramid Lake was at an elevation of about 1178 m, and Winnemucca Lake was at about 1175 m (Hardman and Venstrom, Reference Hardman and Venstrom1941; Harding, Reference Harding1965). Pyramid Lake had reached its historical high-stand elevation of about 1182 m in 1862, 1868, and again in 1891 after exceptionally wet winters in those years (Fig. 4) (Hardman and Venstrom, Reference Hardman and Venstrom1941). Lake level remained relatively high until about 1913, although substantial diversions of Truckee River flow into the Carson River basin began in 1906 via Derby Dam and the Truckee River canal (Horton, Reference Horton1997). Winnemucca Lake was dry in the 1840s but rose rapidly to its historical high stand of about 1175 m in 1882 and again in 1890 (Fig. 4). The diversion of Truckee River water by Derby Dam ultimately caused the level of Pyramid Lake to drop and led to incision in the distal part of the Truckee River because of lowered base level and abandonment of Mud Lake Slough (Hardman and Venstrom, Reference Hardman and Venstrom1941; Harding, Reference Harding1965; Adams, Reference Adams2012b). This incision cut the main water supply for Winnemucca Lake causing it to completely evaporate by the mid-1930s (Harding, Reference Harding1965).
The first radiocarbon chronology for the Lahontan basin was produced by Broecker and Orr (Reference Broecker and Orr1958), which was subsequently added to by Broecker and Kaufman (Reference Broecker and Kaufman1965). Although these assessments include a handful of radiocarbon ages dating to the Holocene, they are not used in the lake-level reconstructions presented herein because the shell samples were collected from elevations below the historical high stand and radiocarbon ages generated in the early 1960s from tufa are not thought to be reliable (e.g., Benson, Reference Benson1978). The remaining Holocene ages from Broecker and Orr (Reference Broecker and Orr1958) were generated on organic carbon from archaeological sites that are located far above maximum Holocene levels in the Pyramid and Winnemucca basins.
Born (Reference Born1972) collected a series of wood radiocarbon samples from Truckee River delta exposures that date from the Holocene. Although all of these samples were collected from below the elevation of the historical high stand (~1182 m), some of them were collected from outcrops of stream alluvium interbedded with lacustrine deposits, indicating times when lake level was relatively low. Based on the ages and elevations of samples, as well as their depositional environments, Born (Reference Born1972) constructed a lake-level curve that shows relatively high lake levels (≤1220 m) around 10,000 14C yr BP that descend to low levels between 8000 and 4000 14C yr BP and subsequent rises around 3000 14C yr BP and in the last few hundred years. Several radiocarbon ages generated from wood samples collected by Prokopovich (Reference Prokopovich1983) in the same area are consistent with the lake-level interpretations presented by Born (Reference Born1972).
Benson et al. (Reference Benson, Currey, Lao and Hostetler1992) presented a model for lake-level fluctuations at Pyramid Lake for the late Pleistocene-Holocene transition. The model includes a high stand of about 1222 m at about 10,700 14C yr BP that they correlated to the Younger Dryas (YD) period, which was followed by a drop in lake level to about 1154 m by 9700 14C yr BP, constrained by the age of sagebrush bark cordage found at the north end of Pyramid Lake (Touhy, Reference Tuohy, Willig, Aikens and Fagan1988). Briggs et al. (Reference Briggs, Wesnousky and Adams2005) dated an articulated mussel shell to 10,800 14C yr BP, which was collected from a beach ridge at 1212 m. Although this age and elevation is consistent with the curve of Benson et al. (Reference Benson, Currey, Lao and Hostetler1992), Briggs et al. (Reference Briggs, Wesnousky and Adams2005) presented geomorphic and stratigraphic evidence that the YD high stand actually transgressed to an elevation of about 1230 m. Briggs et al. (Reference Briggs, Wesnousky and Adams2005) also dated beach ridges at 1187 m and 1195 m to about 3600 14C yr BP and 2600 14C yr BP, respectively. These dated shorelines indicate that late Holocene Pyramid levels fluctuated with much higher amplitude than suggested by Born (Reference Born1972).
Hattori (Reference Hattori1982) and Hattori and Tuohy (Reference Hattori and Tuohy1993) used the ages of cultural materials found at archaeological sites at the north end of Winnemucca Lake to infer the periods during the Holocene when a lake was present there. This inference was based on the lack of other water sources available to the inhabitants of those sites and the type of materials found, which showed a dependence on marsh or lake resources (Hattori and Tuohy, Reference Hattori and Tuohy1993). Their data show relatively high frequencies of radiocarbon ages between 4000–3500 14C yr BP and 2500–1000 14C yr BP.
Benson et al. (Reference Benson, Kashgarian, Rye, Lund, Paillet, Smoot, Kester, Mensing, Meko and Lindstrom2002) documented the frequency and durations of hydrologic fluctuations at Pyramid Lake over the last 7600 cal yr BP using a variety of core proxies and regional paleoclimatic data. They found that multiple multidecadal to multicentennial droughts have affected this region throughout the mid- to late Holocene. The higher temporal resolution of these core records over typical outcrop and landform records provides important information about the timing of hydrologic changes but cannot be used directly to infer the magnitude of lake level or volume changes (Benson et al., Reference Benson, Kashgarian, Rye, Lund, Paillet, Smoot, Kester, Mensing, Meko and Lindstrom2002).
Adams et al. (Reference Adams, Goebel, Graf, Smith, Camp, Briggs and Rhode2008) synthesized the available information on the post–high-stand history of Pyramid and Winnemucca lakes and also compared the ages and elevations of archaeological sites to the lake-level records in order to test the hypothesis that lake-level changes influenced the spatiotemporal distribution of archaeological sites. This compilation of geologic and archaeological data focused on the period from the Lahontan high stand to the beginning of the middle Holocene (~15,500–7000 cal yr BP), which includes the YD period. Based on available evidence at that time, Adams et al. (Reference Adams, Goebel, Graf, Smith, Camp, Briggs and Rhode2008) concluded that during the YD, lake level reached an elevation of about 1230 m in the Pyramid and Winnemucca basins.
Benson et al. (Reference Benson, Hattori, Southon and Aleck2013a) presented a synthesis of paleoclimatic data for Pyramid Lake from the period 48,000 to 11,500 cal yr BP, based on the ages of tufa samples at different elevations and various core proxies. This latest effort represents the continuing evolution of lake-level curves of Benson (Reference Benson1978), Thompson et al. (Reference Thompson, Benson and Hattori1986), Benson and Thompson (Reference Benson, Thompson, Ruddiman and Wright1987), and Benson et al. (Reference Benson, Kashgarian and Rubin1995). The curve of Benson et al. (Reference Benson, Hattori, Southon and Aleck2013a) was further modified by Benson et al. (Reference Benson, Smoot, Lund, Mensing, Foit and Rye2013b) for the period 14,000 to 9000 cal yr BP by incorporating the ages of tufa on which petroglyphs were carved. A slight variation on the curve of Benson et al. (Reference Benson, Hattori, Southon and Aleck2013a) was also made by Reheis et al. (Reference Reheis, Adams, Oviatt and Bacon2014) for the period 16,000 to 10,000 cal yr BP, by incorporating the ages and depositional settings of organic carbon samples and tephra beds to constrain the level of Lake Lahontan at specific times.
METHODS
To better understand the history of post–high-stand lake-level fluctuations in the Pyramid and Winnemucca basins, we evaluated and selectively used existing geochronological data, surveyed the elevations of key features, described natural and artificial exposures through lake deposits, and collected and processed radiocarbon and luminescence dating samples. Standard field and laboratory procedures were utilized in each of these tasks as outlined subsequently.
Geochronological data were initially compiled from numerous published sources and evaluated for their quality and context. Of the hundreds of radiocarbon ages that pertain to lake-level fluctuations in the Pyramid and Winnemucca basins (e.g., Broecker and Orr, Reference Broecker and Orr1958; Broecker and Kaufman, Reference Broecker and Kaufman1965; Born, Reference Born1972; Benson, Reference Benson1978; Thompson et al., Reference Thompson, Benson and Hattori1986; Benson et al., Reference Benson, Currey, Dorn, Lajoie, Oviatt, Robinson, Smith and Stine1990, Reference Benson, Currey, Lao and Hostetler1992, Reference Benson, Kashgarian and Rubin1995, Reference Benson, Kashgarian, Rye, Lund, Paillet, Smoot, Kester, Mensing, Meko and Lindstrom2002, Reference Benson, Hattori, Southon and Aleck2013a, Reference Benson, Smoot, Lund, Mensing, Foit and Rye2013b; Adams and Wesnousky, Reference Adams and Wesnousky1998; Bell et al., Reference Bell, House and Briggs2005b; Briggs et al., Reference Briggs, Wesnousky and Adams2005; Adams et al., Reference Adams, Goebel, Graf, Smith, Camp, Briggs and Rhode2008), only a relatively small percentage of these are related to post–high-stand lake-level fluctuations. Radiocarbon ages have been generated on a variety of materials including charcoal, wood, plant debris, bone, shells, tufa, total organic fraction of sediments, and bulk organic content of soils that were subjected to a variety of pretreatment techniques. In addition, many ages have been generated from archaeological contexts (e.g., Hattori, Reference Hattori1982; Hattori and Tuohy, Reference Hattori and Tuohy1993; Adams et al., Reference Adams, Goebel, Graf, Smith, Camp, Briggs and Rhode2008) that span a range of elevations.
Samples were classified by whether they were deposited above, at, or below lake level based on their depositional setting using the guidance of Adams (Reference Adams2007, Reference Adams2010) and Reheis et al. (Reference Reheis, Adams, Oviatt and Bacon2014). Tufa ages from Broecker and Orr (Reference Broecker and Orr1958) and Broecker and Kaufman (Reference Broecker and Kaufman1965) were not used because of their potential for contamination (e.g., Benson, Reference Benson1978). The five Holocene tufa ages from Benson et al. (Reference Benson, Currey, Lao and Hostetler1992) were also not used because they were all collected from elevations below the historic high stand of Pyramid Lake. The potential reservoir effect in Pyramid Lake was estimated to range from 200 to 600 yr, depending on the size of the lake (Broecker and Kaufman, Reference Broecker and Kaufman1965; Benson et al., Reference Benson, Kashgarian, Rye, Lund, Paillet, Smoot, Kester, Mensing, Meko and Lindstrom2002, Reference Adams2013b), so all ages from shell or other carbonates are considered maximum ages. All radiocarbon ages have been calibrated with the Calib 7.1 program using the IntCal13 calibration curve (Reimer et al., Reference Reimer, Bard, Bayliss, Beck, Blackwell, Bronk Ramsey and Buck2013) and are reported in radiocarbon years before present (14C yr BP) and calibrated years before present (cal yr BP).
We also employed infrared-stimulated luminescence (IRSL) dating to directly date samples collected from the suite of beach ridges at the north end of Winnemucca Lake. Two samples each were collected from six beach ridges ranging in elevation from 1177 to 1231 m. Five samples were collected from two different exposures on the 1202 m beach ridge. All samples were collected by pounding a steel pipe horizontally into the vertical wall of a trench or pit and then excavating the pipe without exposing the sediment to light and capping the ends with light-tight material. An attempt was made to sample parts of the exposures with visible bedding in order to minimize the mixing effects of bioturbation, but no bedding was observed in the excavations in the 1202 m ridge. In situ gamma spectrometer measurements were collected from the same holes where the sediment was collected to determine dose rate. In addition, bulk samples surrounding each sample site were collected for laboratory radiation measurements. All samples were processed at the University of California, Los Angeles luminescence laboratory using the single grain K-feldspar post-IR IRSL protocol outlined in Rhodes (Reference Rhodes2015). More details on this methodology are found in the Supplementary Materials.
Stream terraces and fluvial deposits at a range of elevations along the lower Truckee River represent different lake levels to which the river was graded, because Pyramid Lake acts as base level for this system. Adams (Reference Adams2012b) showed that the Truckee River responds very quickly (decadal time periods) to the lowering of Pyramid Lake by adjusting its slope through incision and altering its planform. Therefore, elevations of the downstream extents of Holocene fluvial terraces and deposits mapped by Bell et al. (Reference Bell, House and Briggs2005b) are used as close approximations of lake level when these terrace surfaces represented the active floodplain of the Truckee River graded to Pyramid Lake.
Elevations associated with dating samples and landforms either were surveyed with a total station referenced to local geodetic benchmarks or a map-grade GPS instrument with differential correction or were determined from high-precision LIDAR (light detection and ranging) topographic data. All elevations therefore have a precision of ≤1 m and sometimes are substantially more precise, which is well within the natural variability in the height that shorelines form above an associated still water plane (Atwood, Reference Atwood1994; Adams and Wesnousky, Reference Adams and Wesnousky1998). Exceptions to this level of precision include the radiocarbon samples of Born (Reference Born1972) and Prokopovich (Reference Prokopovich1983) from the Truckee River delta, but these were collected from below the elevation of the historical high stand and only provide broad limiting elevations on lake-level fluctuations. Elevations are reported as meters above sea level (m asl) (NAVD88), which is shortened to meters (m). The horizontal coordinate system is UTM NAD 83 Zone 11.
To assess the paleohydrologic implications of Holocene lake-level fluctuations, the hypsometries of the subaerial portions of the Pyramid and Winnemucca basins were calculated from 10 m digital elevation models (DEMs) using the surface volume tool in ArcGIS. The hypsometry of the submerged portion of Pyramid was derived from the bathymetric data set of Eisses et al. (Reference Eisses, Kell, Kent, Driscoll, Baskin, Smith, Karlin, Louie and Pullammanappallil2015), which was then integrated with the results calculated from the subaerial 10-m DEM data.
RESULTS
The history of lake-level fluctuations in the Pyramid and Winnemucca basins is reconstructed from multiple lines of evidence that include the ages and elevations of shorelines surrounding the basins, fluvial terraces and deposits graded to former lake levels, pack rat middens that have not been submerged since their formation, and archaeological materials found at low elevations surrounding the basins (Table 1). This history is also constrained by the elevations of both internal and external sills, where water spilling to a downstream basin effectively restricts further lake-level rises until the downstream basin fills to the elevation of the sill.
Radiocarbon ages used to constrain lake-level fluctuations in the Pyramid and Winnemucca lake basins.

a All radiocarbon ages calibrated with Calib 7.1 using the IntCal13 calibration curve (Reimer et al., Reference Reimer, Bard, Bayliss, Beck, Blackwell, Bronk Ramsey and Buck2013).
b Average of three radiocarbon ages (Adams et al., Reference Adams, Goebel, Graf, Smith, Camp, Briggs and Rhode2008).
Topographic constraints
The two sills that affected lake-level fluctuations in the Pyramid and Winnemucca basins during the Holocene include Mud Lake Slough, which constrains flow into Winnemucca Lake, and Emerson Pass where spill into Smoke Creek Desert occurred (Fig. 2). When Russell was working in the basin in the early 1880s, the Truckee River bifurcated near its distal end, and one branch of the river flowed through Mud Lake Slough and into Winnemucca Lake, while the other branch continued into Pyramid Lake. According to historical records, the bifurcation of the Truckee was not a permanent condition, and the Mud Lake Slough channel was variously occupied and abandoned by the Truckee River (Hardman and Venstrom, Reference Hardman and Venstrom1941). Based on a detailed contour map of the area of bifurcation, Hardman and Venstrom (Reference Hardman and Venstrom1941) determined that the elevation of the junction of the two channels was about 1177.5 m, which is similar to the LIDAR-derived elevation of 1178.5 m. From the junction, the low gradient channel (~0.0003 m/m) of Mud Lake Slough extends about 13 km to the north where it becomes unconfined and deposits from the channel spread out into a broad, delta-like feature covering the southern end of the Winnemucca Lake bed (Fig. 2).
When Pyramid Lake was at or above 1178.5 m, the Truckee River–Mud Lake Slough junction acted as a sill, and water from Pyramid flowed toward Winnemucca Lake (Russell, Reference Russell1885; Hardman and Venstrom, Reference Hardman and Venstrom1941). At no time in the late nineteenth century, however, were the two lakes at the same elevation (Fig. 4), despite Pyramid rising several times to inundate the sill by several meters (Hardman and Venstrom, Reference Hardman and Venstrom1941). These observations beg the question: How could Pyramid rise to its historical high stand of about 1182 m, thereby submerging the sill by about 3.5 m, while Winnemucca only rose to its historical high stand of about 1175 m during the late nineteenth century?
One potential explanation is the presence and elevation of a sand dune complex that blocks the Mud Lake Slough channel about 11 km downstream from its junction with the Truckee River (Fig. 5). These active transverse dunes terminate in the Mud Lake Slough channel and appear to be sourced from sandy beach ridges on the southeast shore of Pyramid Lake, about 3.5 km to the west-southwest of the blockage. The dunes are about 7–8 m thick where they block the channel, and the lowest point at the blockage is presently at about 1183 m, similar to the historical high-stand elevation of Pyramid Lake. Thus, the dunes may have effectively dammed the channel at this elevation.
Aerial image of the active dune field (location in Fig. 2) that is blocking the Mud Lake Slough channel. Flow in the channel is from south to north. The green line represents the 1183 m contour on the Pyramid Lake side of the dune barrier. (For interpretation of the references to color in this figure legend, the reader is referred to the web version of this article.)

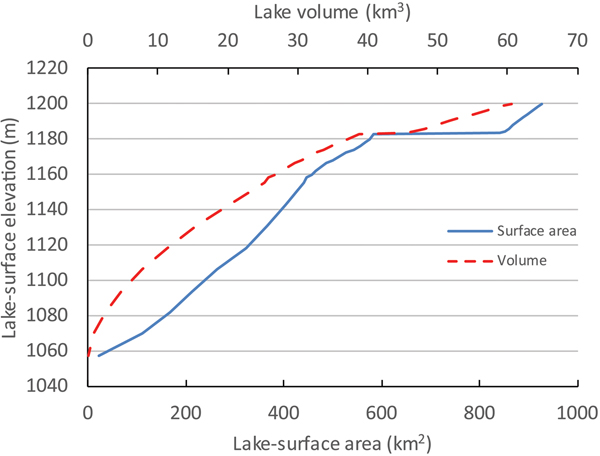
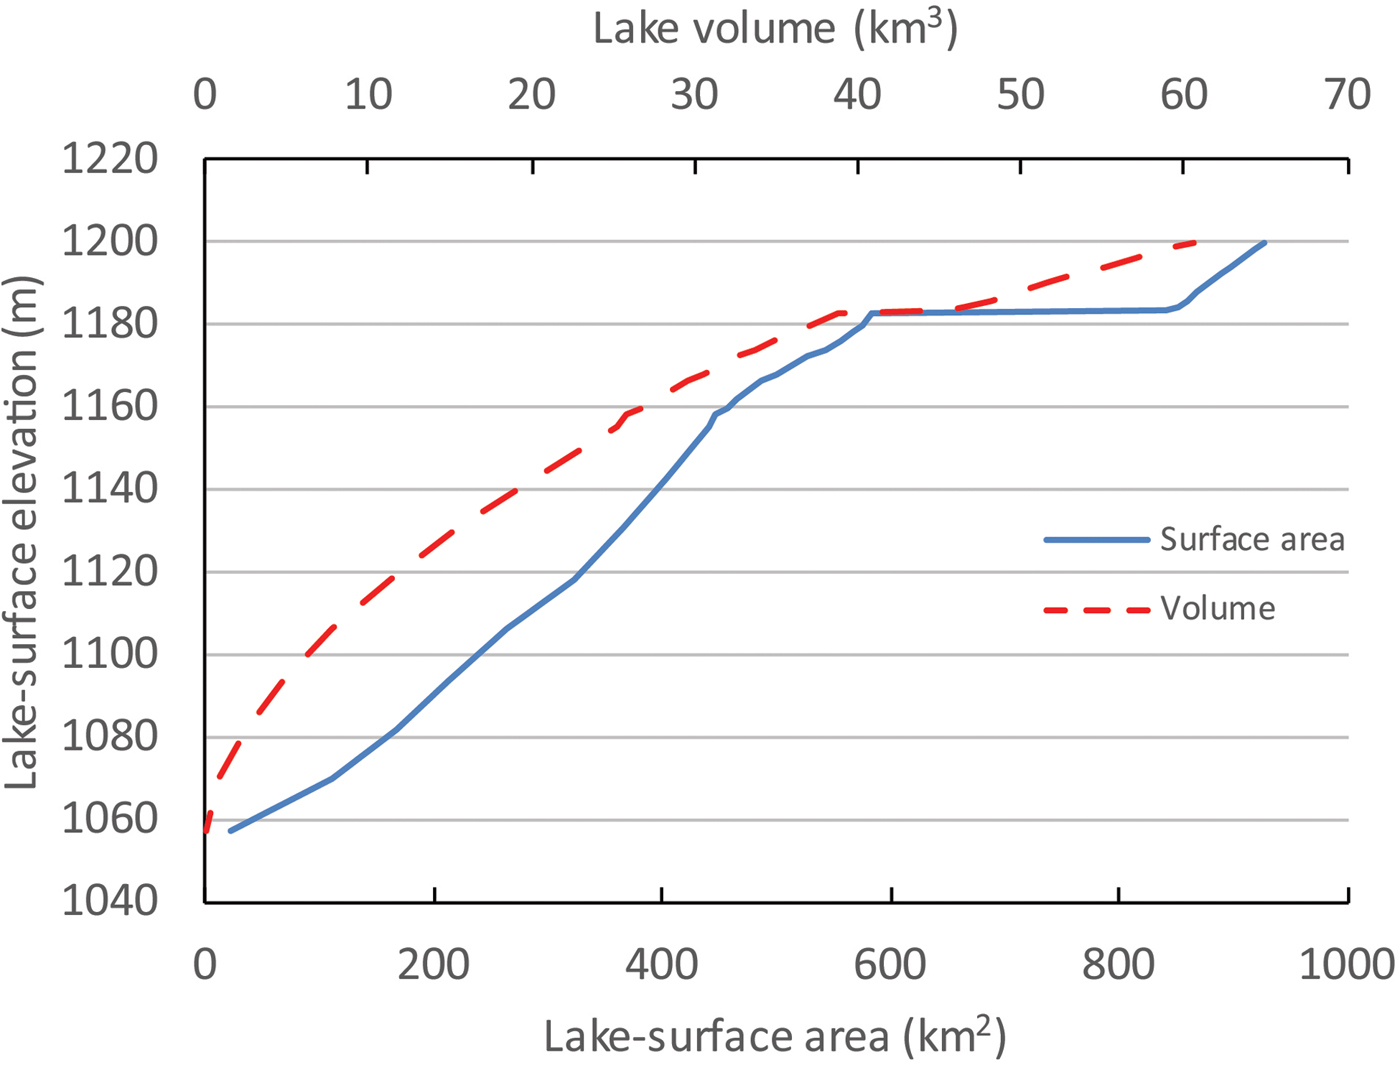
The other factor in the disparate lake levels is the evaporative potential and volume of Winnemucca Lake below 1182 m (Figs. 2 and 6). As water begins to fill an empty Winnemucca Lake, the basin essentially acts as a large evaporative pan. By the time lake level in Winnemucca Lake reaches 1178 m, the lake has a surface area of about 250 km2 and volume of 5.5 km3 (Fig. 6). The combined surface area of Pyramid at this same elevation and Winnemucca (~570 km2) corresponds to an evaporative output of about 1 km3/yr, assuming an evaporation rate of 125 cm/yr (Milne, Reference Milne1987). The magnitude of this output is significantly greater than the current mean annual discharge into the basin of ~0.67 km3/yr.
(color online) Hypsometric relations between lake-surface elevation, lake-surface area, and lake volume for Pyramid and Winnemucca Lakes. The flat parts of the curves represent Pyramid Lake spilling at an elevation of 1183 m and filling Winnemucca Lake.
The next higher sill in the Pyramid and Winnemucca basins is Emerson Pass, which constrains spill from the north end of Pyramid Lake into the Smoke Creek Desert (Fig. 2). The present elevation of this sill is about 1207 m, but geologic mapping by Anderson et al. (Reference Anderson, Faulds and Dering2014) indicates that Holocene alluvial fans shed from the Fox Range have buried Emerson Pass and raised its elevation since the last time overflow occurred. Adams et al. (Reference Adams, Goebel, Graf, Smith, Camp, Briggs and Rhode2008) suggested that the functional overflow elevation of the sill was at about 1202 m based on the elevation of the crest of a large barrier complex at the north end of Winnemucca Lake, whose size was attributed to a stable lake level controlled by the sill. The actual elevation of Emerson Pass when spill was occurring may have been 1–2 m below the crest of the barrier, however, accounting for wave run-up above still water level. Therefore, the elevation of Emerson Pass during periods of overflow was probably closer to 1200 m.
Geochronological constraints
Adams et al. (Reference Adams, Goebel, Graf, Smith, Camp, Briggs and Rhode2008) presented several late Holocene radiocarbon ages for beach ridges between 1185 m and 1195 m at the north end of Winnemucca Lake, as well as a latest Pleistocene age for the beach ridge at 1231 m. That data set is augmented with more radiocarbon ages from samples collected from the trench through the 1231 m beach ridge and a group of luminescence ages collected from the crests of beach ridges extending from 1177 m to 1231 m.
Figure 7 shows the stratigraphy and sedimentology of the 1231 m beach ridge and underlying nearshore deposits with the locations and ages of dating samples plotted. These deposits are primarily composed of discrete packages of basaltic gravel and sand separated from granitic sand and grus units by angular unconformities and lags and are numbered 1 through 8 in order of decreasing relative age. The basalt sands and gravels were derived from the Lake Range to the west of the trench, and the granitic sands and gravels were derived from the Selenite Range to the east (Fig. 2), although a few granitic clasts can be found in the basalt-dominated units and vice versa. All of the units in this exposure are interpreted as wave-affected beach or nearshore deposits, based on their relatively coarse nature and sedimentary features, but only units 7 and 8 represent the backsets of the 1231 m surface beach ridge.
Log of the west wall of the trench through the 1231 m beach ridge at the north end of Winnemucca Lake showing the arrangement of stratigraphic units and the distribution of dating samples. The location of this trench is shown in Figure 8. The age of the Timber Lake tephra is from Benson et al. (Reference Benson, Liddicoat, Smoot, Sarna-Wojcicki, Negrini and Lund2003).

The ages of seven radiocarbon samples and one tephra sample collected from various units exposed in the trench demonstrate that this stack of primarily beach and nearshore deposits accumulated between about 28,000 and 14,000 14C yr BP (Fig. 7) (Table 1), which represents a time period when Lake Lahontan transgressed and regressed through this elevation range several times (Benson et al., Reference Benson, Hattori, Southon and Aleck2013a; Reheis et al., Reference Reheis, Adams, Oviatt and Bacon2014). Two luminescence samples collected from the backsets of the beach ridge (Unit 7) date to about 13.7 and 12 ka (Fig. 7, Table 2), which are younger than the radiocarbon samples collected from the same backsets. The two radiocarbon ages from unit 7, however, are out of stratigraphic order with respect to the ages from units 2–6.
Luminescence ages from beach ridges at the north end of Winnemucca Lake.

a UTM coordinates are all in Zone 11 NAD83.
b Ages not used in Figure 9.
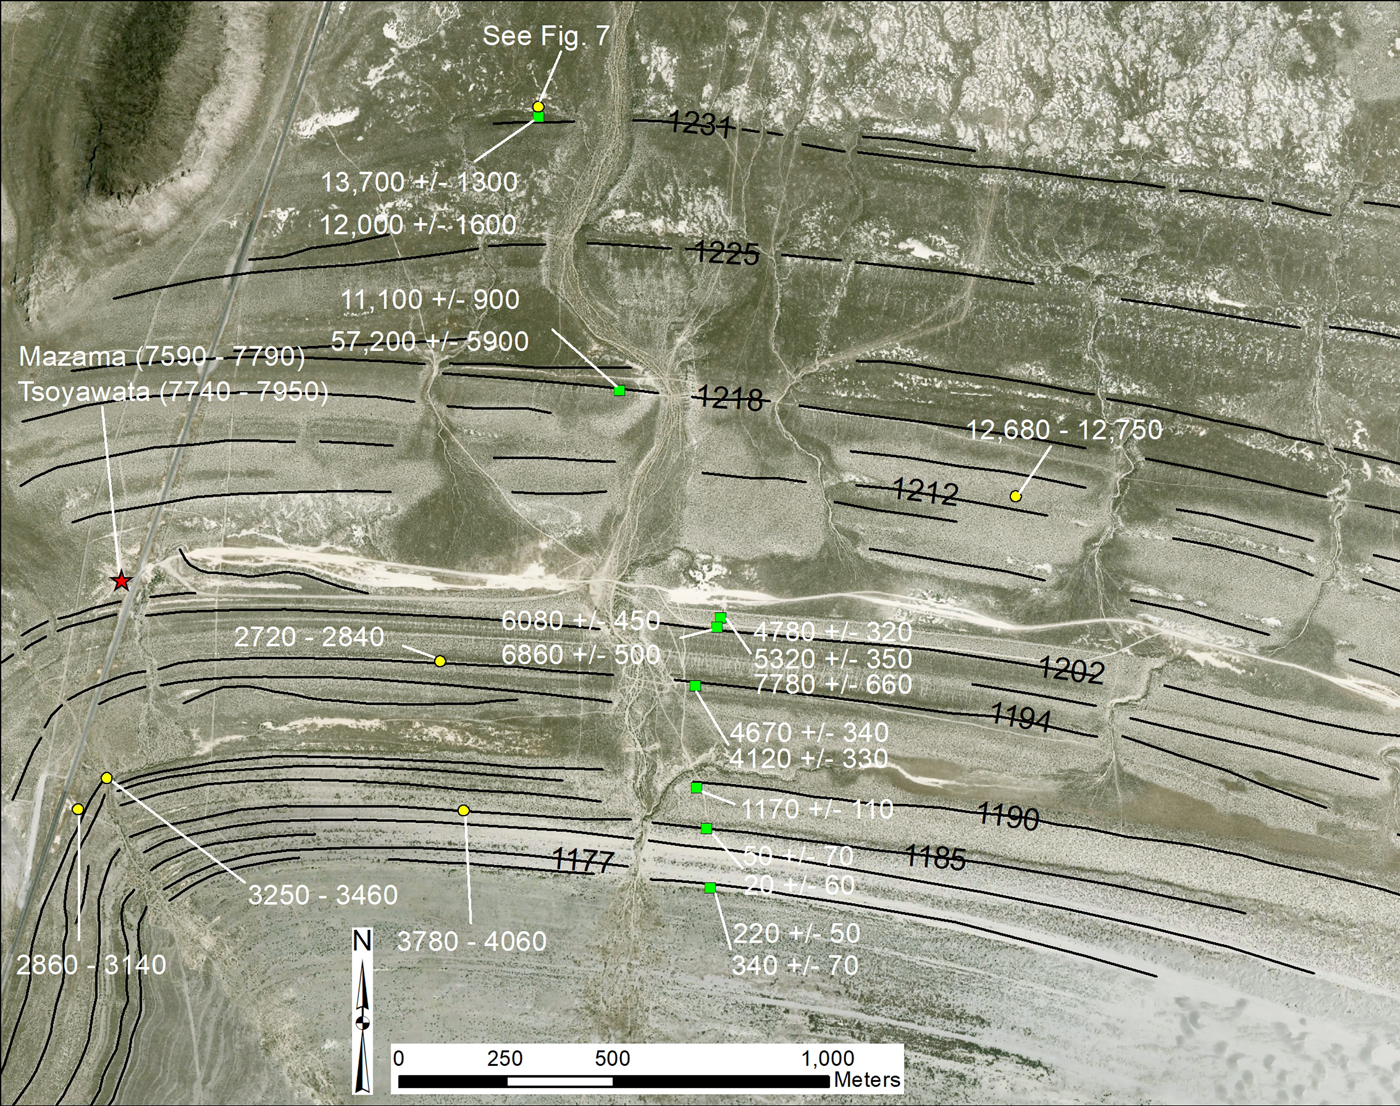
Additional luminescence samples were collected from beach ridges at 1218 m (11.1 and 57.2 ka), 1202 m (4.8, 5.3, 7.8, 6.1, and 6.9 ka), 1194 m (4.1 and 4.7 ka), 1190 m (1.2 ka), 1185 m (0.05 and 0.02 ka), and 1177 m (0.22 and 0.34 ka) (Fig. 8; Table 2). The IRSL ages for the 1194, 1185, and 1175 m ridges overlap at 1-sigma, whereas the five sample ages for the 1202 m ridge and the two sample ages for the 1218 m ridge do not (Table 2).
Map of beach ridges at the north end of Winnemucca Lake showing the locations and results of dating samples. Yellow circles are radiocarbon samples, green circles are luminescence samples, and the red star indicates the locations of the Mazama and Tsoyawata tephras. Thin black lines delineate beach ridge crests, and the elevations of several of the crests are labeled. See Figure 2 for location. (For interpretation of the references to color in this figure legend, the reader is referred to the web version of this article.)
A series of fluvial terraces are found along the distal reaches of the Truckee River, just upstream from Pyramid Lake, which range in age from modern to about 12,700 14C yr BP (Bell et al., Reference Bell, House and Briggs2005b; Adams, Reference Adams2012b). The youngest terraces are a few meters above the river channel, and the oldest are as much as 15 m above the channel. The Mazama tephra is found within fluvial deposits, along with age-consistent radiocarbon samples, that are exposed in the lower parts of the Nixon terrace (Qtn) at an elevation just below 1200 m (Bell et al., Reference Bell, House and Briggs2005b), which indicates that lake level was around or slightly below this elevation when the tephra was deposited (~7700 cal yr BP; Table 1). The elevations of the two radiocarbon samples from the Nixon terrace were erroneously reported to be 1189 m by Adams et al. (Reference Adams, Goebel, Graf, Smith, Camp, Briggs and Rhode2008). Based on a GPS survey and elevations extracted from LIDAR data (Adams, Reference Adams2012b), these elevations are herein corrected to 1198 m. The Mazama tephra and its slightly older sibling, the Tsoyawata tephra, are also found ponded behind the 1202 m beach ridge at the north end of Winnemucca Lake (Adams et al., Reference Adams, Goebel, Graf, Smith, Camp, Briggs and Rhode2008), which is consistent with a lake level around 1200 m.
The age and elevation of the downstream extent of the late Holocene fill-cut Qty2 terrace of Bell et al. (Reference Bell, House and Briggs2005b) indicate that lake level was at about 1181 m around 500 cal yr BP (Table 1). When the fill-cut Qty3 terrace formed around 1240 cal yr BP (Bell et al., Reference Bell, Garside and House2005a, 2005b), it was graded to a lake level at about 1183 m. Similarly, a fluvial gravel (Qtry) interbedded with lacustrine deposits can be traced along the south wall of the deep trench cut by the Truckee River over the last 100 yr to a point as low as about 1171 m, indicating that lake level was at least that low at about 2100 cal yr BP (Bell et al., Reference Bell, House and Briggs2005b).
Several radiocarbon ages on human bones and associated cultural materials collected from the northwest shore of Pyramid Lake constrain the timing of low lake levels during the late Pleistocene and Holocene (Table 1) (Tuohy, Reference Tuohy, Willig, Aikens and Fagan1988; Hattori and Tuohy, Reference Hattori and Tuohy1993; Edgar, Reference Edgar1997; Tuohy and Dansie, Reference Tuohy and Dansie1997). In particular, low lake levels (~1154 m) are indicated at about 11,000–10,500, 6700, and 2500 cal yr BP. All of these samples were eroding out of beach or nearshore deposits and only exposed when lake levels fell to artificially low levels in the mid-twentieth century because of upstream water diversions.
Indirect data constraining the lake-level curve include drowned trees in the nearshore zone of Lake Tahoe that date from about 6400 to 4800 cal yr BP (Lindström, Reference Lindström1990). These trees indicate extended periods in the middle Holocene when Lake Tahoe was below its natural rim. By inference, flow down the Truckee River was likely greatly reduced, leading to relatively low levels at Pyramid Lake (Benson et al., Reference Benson, Kashgarian, Rye, Lund, Paillet, Smoot, Kester, Mensing, Meko and Lindstrom2002).
The ages, elevations, and significance of all the dating samples used to reconstruct the post–Lahontan high-stand lake-level curve of Pyramid and Winnemucca Lakes are listed in Table 1 and plotted in Figure 9. The part of the curve extending from about 16,000 to 7000 cal yr BP is similar to the curve of Adams et al. (Reference Adams, Goebel, Graf, Smith, Camp, Briggs and Rhode2008), but there are now more geochronological data constraining the curve from about 12,000 to 8000 cal yr BP. The middle to late Holocene part of the curve is presented here for the first time.
(color online) Lake-level curve for the Pyramid Lake and Winnemucca Lake basins extending from the late Pleistocene high stand of Lake Lahontan to the present. The main subdivisions of the late Pleistocene and Holocene along the bottom of the graph are from Broecker et al. (Reference Broecker, McGee, Adams, Cheng, Edwards, Oviatt and Quade2009), Walker et al. (Reference Walker, Berkelhammer, Bjorck, Cwynar, Fisher, Long, Lowe, Newnham, Rasmussen and Weiss2012), and Sigl et al. (Reference Sigl, Fudge, Winstrup, Cole-Dai, Ferris, McConnell and Taylor2016) and are as follows: BA, Bølling-Allerød; BD, Big Dry; BW, Big Wet; EH, early Holocene; LH, late Holocene; MH, middle Holocene; YD, Younger Dryas. Further subdivisions of the middle and late Holocene include the following: H, historical period; LHDP, late Holocene dry period (Mensing et al., Reference Mensing, Sharpe, Tunno, Sada, Thomas, Starratt and Smith2013); LIA, Little Ice Age (Cook et al., Reference Cook, Seager, Heim, Vose, Herweijer and Woodhouse2010); LTT, the time period over which trees were growing on the shore of Lake Tahoe below its natural rim (Lindström, Reference Lindström1990); MCA, Medieval Climate Anomaly (Stine, Reference Stine1994; Cook et al., Reference Cook, Seager, Heim, Vose, Herweijer and Woodhouse2010); NP, Neopluvial (Allison, Reference Allison1982). IRSL, infrared-stimulated luminescence.

DISCUSSION
The Pyramid-Winnemucca lake-level curve presented herein (Fig. 9) extends from the late Pleistocene Lahontan high stand to the historical period and is constrained by multiple lines of evidence employing a variety of dating techniques, in which samples were collected from a range of depositional settings and landforms. Existing data were selected from the literature based on the type of sample material and its context, particularly on whether the sample was deposited above, at, or below lake level (Table 1). The principal dating technique was the radiocarbon method, focusing on wood, charcoal, bones, and carbonate shells as sample material (Table 1). These ages were augmented with a series of new IRSL ages on a suite of beach ridges at the north end of Winnemucca Lake (Table 2, Figs. 7 and 8).
Sources of uncertainty
The lake-level curve was drawn as a dotted line, constrained by the data points, but there could have been, and likely were, significant fluctuations between some of these points that are not captured in this curve. This uncertainty stems from a variety of sources that include analytical errors and geologic causes. Laboratory precision for the radiocarbon ages, which were generated by many different researchers at many different labs, ranges from decadal to centennial, with the larger errors typically associated with conventional ages that were generated in the 1970s and 1980s (Table 1). When calibrated at 2-sigma, the errors expand to range from about 100 yr up to about 2500 yr, depending on the original laboratory error and on which part of the calibration curve the age falls.
Potential geologic errors include radiocarbon samples that do not accurately reflect the age of the sediments in which they were found and reservoir effects for samples that derived their carbon from lake water. Both of these types of errors are difficult to assess, but an attempt was made to minimize their effects on the resultant lake-level curve by preferentially selecting from the literature organic samples in known contexts that acquired their carbon from the atmosphere. The reality of this kind of field research, however, dictates that one is often forced to sample whatever carbon material that can be found in key landforms and outcrops, even if it is less than ideal.
In many instances, carbon material simply cannot be found, which is why IRSL dating was utilized, but this technique also has its own set of associated uncertainties. At least two samples were collected from each of the excavations on the seven different beach ridges (Table 2, Fig. 8). Ideally, all samples from a single excavation would return the same age if all sand grains in the deposit were last exposed to sunlight at the same time. For four of the seven beach ridges (1231, 1194, 1185, and 1175 m), this is indeed the case, where each of the pairs of ages overlap at 1-sigma (Table 2). For the 1202 m ridge, however, the five samples collected from two different excavations range from about 4.8 to 7.8 ka. The older age is preferred because of its agreement with the ages of the Mazama and Tsoyawata tephras, which are ponded behind the beach ridge (Fig. 8). For the 1218 m ridge, the age discrepancy is even larger with the two sample ages of 11.1 and 57.2 ka collected just 12 cm apart.
Several processes may account for the age differences expressed by the duplicate samples. The first may be incomplete bleaching of sand grains while a beach ridge is being formed, which is consistent with the overprinted nature of nearshore environments. The 57.1 ka age from the 1218 m ridge may be explained by this process, as could the two ages from the historical high stand (1177 m ridge), which appear to be as much as several hundred years too old.
The second process may be eolian reworking of the lower, sandy beach ridges, which is observed in the form of sand sheets, small dunes, and blowouts on these features, particularly at their eastern ends (Fig. 8). Reworking of the beach sediment by eolian processes could presumably lead to ages that were younger than the original beach sediment. This may be the case with four of the samples from the 1202 m ridge and the samples from the 1185 m ridge (Table 2).
A third source of geologic uncertainty is in the often palimpsest record of nearshore environments, where wave action has the potential to rework sediment packages as lake level rises and falls through a particular elevation range. This often leads to a complicated, reworked, and overprinted sedimentary record in nearshore environments that can span long periods of time and likely also contains significant unconformities. The trench excavated through the 1231 m beach ridge at Winnemucca Lake reveals a record that is probably typical of this type of environment (Fig. 7). The ~2-m stack of lacustrine sediments exposed here represents an interval of time lasting about 13,000–15,000 yr during the late Pleistocene as Lake Lahontan repeatedly rose and fell through this elevation range.
Adams et al. (Reference Adams, Goebel, Graf, Smith, Camp, Briggs and Rhode2008) presented geomorphic and stratigraphic evidence that the 1231 m surface ridge was formed after the Lahontan high stand and probably represented the maximum lake level that occurred during the YD period. At the time that the 2008 article was written, however, there was only a single radiocarbon age of 16,610 ± 80 14C yr BP that was generated from shell fragments collected from the backsets of the surface beach ridge (Fig. 7). The shells were interpreted as reworked material. An additional six radiocarbon samples collected from the trench since 2008, as well as the presence of the Timber Lake tephra (28,120 ± 300 14C yr BP; Benson et al., Reference Benson, Liddicoat, Smoot, Sarna-Wojcicki, Negrini and Lund2003), suggest that the majority of these nearshore deposits (below unit 6; Fig. 7) accumulated prior to the Lahontan high stand (13,070 ± 60 14C yr BP; Adams and Wesnousky, Reference Adams and Wesnousky1998), although there are some slight age inversions in the upper part of the stratigraphy.
The two luminescence ages of about 12.7 and 13.1 ka generated from sediment samples collected in the backsets of the 1231 m surface beach ridge suggest that this feature was formed during the YD period (Fig. 7; unit 7), which is the same conclusion reached by Briggs et al. (Reference Briggs, Wesnousky and Adams2005) and Adams et al. (Reference Adams, Goebel, Graf, Smith, Camp, Briggs and Rhode2008). The older radiocarbon ages of about 15,500 and 16,600 14C yr BP, collected from the same stratigraphic unit, highlight the potential difficulty of dating these types of landforms and sediments in nearshore environments. In particular, abundant sediment, along with shells, tufa fragments, and other datable material, are likely reworked into younger deposits each time a lake transgresses or regresses across a piedmont.
Some of the lower beach ridges at the north end of Winnemucca Lake also have radiocarbon control that can be directly compared to the IRSL ages. The 1194 m beach ridge has a radiocarbon age of 2720–2840 cal yr BP, whereas the luminescence age for this feature is 4.12 or 4.67 ka. Similarly, the radiocarbon age of the 1190 m beach ridge is 2860–3140 or 3250–3460 cal yr BP, but the luminescence age is 1.17 ka. The disparity is even larger for the 1185 m beach ridge, which has a radiocarbon age of 3780–4060 cal yr BP and a luminescence age of either 0.05 or 0.02 ka (Fig. 8, Tables 1 and 2). In short, none of the radiocarbon ages closely agree with the luminescence ages, which may also highlight the overprinted nature of beach deposits. Therefore, caution is recommended when evaluating geochronological data from these types of settings. Based on the data included in this study, however, it is likely that there have been multiple transgressions and regressions through the 1175–1195 m elevation range in the late Holocene (Fig. 9).
The hypsometries of different basins and how they are connected may also highlight the complex nature of these systems and increase the uncertainties when attempting to decipher their histories. A good example of this is the nature and dynamics of the Mud Lake Slough sill that connects the Pyramid and Winnemucca basins. A cursory examination of the channel where it splits off from the Truckee River (Fig. 2) does not explain why historical lake levels in the two subbasins of this system never achieved the same height even though the channel junction was several times submerged by several meters. Only by looking many kilometers downstream is the probable role of active sand dunes in blocking the channel revealed. If Pyramid Lake were to rise today above the 1178.5 m elevation of the mouth of Mud Lake Slough, flow through the channel would likely be blocked by the dunes until water seeped through or rose above the 1183 m height of the obstruction, followed by quick incision through the pile of sand. When flow through Mud Lake Slough ceased, the sand dune dam may also have reformed relatively quickly, judging by the active nature of the dune complex (Fig. 5), enabled by a fresh supply of recently exposed nearshore Pyramid Lake sand. The height of this periodic damming mechanism is likely to have varied somewhat through time. The large (~28 km2) fan delta complex spread across the southern bed of Winnemucca Lake (Fig. 2) may be the product of repeated formation and destruction of the dune dam, moving the easily transportable sediment into the subbasin. This apparent dynamism complicates efforts to date past lake levels in the 1175–1185 m range in this system because the levels are dependent not solely on climate but also on a suite of geomorphic processes.
Paleohydrologic implications
This section compares the results of this study with previous studies and discusses the implications of past lake-level fluctuations at Pyramid and Winnemucca lakes over the last 16,000 cal yr BP, but the emphasis is on the late Holocene part of the curve because of its relevance for understanding possible magnitudes of future hydrologic changes. In particular, documenting lake-level changes leads directly to quantifying absolute changes in water volume delivered by the Truckee River drainage basin over centennial to millennial timescales.
The history of Pyramid and Winnemucca lakes has been studied by many different researchers over the last 130 years, but probably the most relevant studies to compare to the work presented herein are those of Benson et al. (Reference Benson, Currey, Lao and Hostetler1992, Reference Benson, Kashgarian, Rye, Lund, Paillet, Smoot, Kester, Mensing, Meko and Lindstrom2002, Reference Benson, Hattori, Southon and Aleck2013a, Reference Benson, Smoot, Lund, Mensing, Foit and Rye2013b) that focus on several periods since the late Pleistocene. Benson et al. (Reference Benson, Currey, Lao and Hostetler1992) were the first to propose a YD high stand of about 1220 m at Pyramid Lake, but this interpretation is based on rock varnish “ages” that are not thought to be reliable (e.g., Beck et al., Reference Beck, Donahue, Jull, Burr, Broecker, Bonani, Hajdas and Malotki1998).
The study of Benson et al. (Reference Benson, Hattori, Southon and Aleck2013a) on tufa-covered petroglyphs at Winnemucca Lake covers a similar time period to that of Adams et al. (Reference Adams, Goebel, Graf, Smith, Camp, Briggs and Rhode2008) and the early part of the lake-level curve presented herein (Fig. 9). Although there are some similarities in the lake-level curves, there are also some significant differences. For example, the timing of the Lahontan high stand and subsequent drop to low levels from 13,000 to 14,000 cal yr BP is similar for all reconstructions, but the curves of Benson et al. (Reference Benson, Hattori, Southon and Aleck2013a, Reference Benson, Smoot, Lund, Mensing, Foit and Rye2013b) show a much lower lake level at this time than do the curve from Adams et al. (Reference Adams, Goebel, Graf, Smith, Camp, Briggs and Rhode2008) and the present curve. The present curve (Fig. 9) shows a distinct rise to 1230 m at ~12,000 cal yr BP, during the YD period, followed by a drop to 1154 m by 10,500 cal yr BP. This low lake level is constrained by the age and elevation of sagebrush bark cordage found along the lakeshore (Tuohy, Reference Tuohy, Willig, Aikens and Fagan1988; Hattori and Tuohy, Reference Hattori and Tuohy1993), as well as other data indicating low lake levels at this time (Fig. 9, Table 1). In contrast, Benson et al. (Reference Benson, Hattori, Southon and Aleck2013a) simply show a rise beginning at 13,000 cal yr BP to about 1210 m where lake level remained until about 9800 cal yr BP. Benson et al. (Reference Benson, Smoot, Lund, Mensing, Foit and Rye2013b) drew this part of the curve slightly higher, at about 1215 m, and ended this high stand slightly sooner, at ~11,000 cal yr BP. These parts of both Benson curves are based on the ages of tufa at elevations of about 1205 m, which do not necessarily constrain how high the lake rose during this period.
Near the beginning of the middle Holocene, lake level was at about 1200 m when the Tsoyawata and Mazama tephras were deposited (~7700–7900 cal yr BP; Bacon, Reference Bacon1983) but fell to relatively low levels (~1154 m) by about 6800 cal yr BP (Fig. 9). This relatively large lake-level change roughly corresponds to abrupt changes in the δ18O record from a Pyramid Lake core (Benson et al., Reference Benson, Kashgarian, Rye, Lund, Paillet, Smoot, Kester, Mensing, Meko and Lindstrom2002). The lake-level curve is queried for the next 2000 yr because there is no direct evidence of lake state. However, drowned tree stumps in Lake Tahoe that date from about 6300 to 4800 cal yr BP (Lindström, Reference Lindström1990) provide indirect evidence for reduced Truckee River input. The elevations, ages, and life spans of these stumps are interpreted to indicate time periods when Lake Tahoe was below its natural rim and not contributing to the Truckee River, which implies correspondingly low levels at Pyramid Lake (Benson et al., Reference Benson, Kashgarian, Rye, Lund, Paillet, Smoot, Kester, Mensing, Meko and Lindstrom2002).
Lake level began to rise again by ~5000 cal yr BP, reaching relatively high levels (>1178–1195 m) and remaining there until ~2800 cal yr BP, except for a brief drop to about 1174 m around 3000 cal yr BP (Fig. 9). These shorelines represent the Neopluvial period, which was first defined by Allison (Reference Allison1982) based on relatively high late Holocene lake levels in the Summer Lake basin of Oregon. The Summer Lake shorelines were not dated, but Allison (Reference Allison1982) thought that they were roughly 2000 to 4000 yr old. Although the temporal range may vary slightly from place to place, the spatial range of the Neopluvial apparently extended from Oregon south through Pyramid, Walker (Adams et al., Reference Adams, Bacon, Lancaster, Rhodes and Negrini2014), Fallen Leaf (Noble et al., Reference Noble, Ball, Zimmerman, Maloney, Smith, Kent, Adams, Karlin and Driscoll2016), Mono (Stine, Reference Stine1990), Owens (Bacon et al., Reference Bacon, Lancaster, Stine, Rhodes and McCarley Holder2018), Tulare (Negrini et al., Reference Negrini, Wigand, Draucker, Gobalet, Gardner, Sutton and Yohe2006), and the Mojave (Enzel et al., Reference Enzel, Wells, Lancaster, Enzel, Wells and Lancaster2003) basins, all of which experienced high lake levels around 3500 to 4000 cal yr BP. This signal also extended into the eastern Great Basin as cooler and wetter conditions are indicated by the records at Ruby Marsh (Thompson, Reference Thompson1992) and the Great Salt Lake (Murchison, Reference Murchison1989; Broughton et al., Reference Broughton, Madsen and Quade2000; Broughton and Smith, Reference Broughton, Smith, Oviatt and Shroder2016).
At Pyramid Lake, lake level reached its late Holocene high stand of about 1195 m at around 2800 cal yr BP, before dramatically falling to an elevation of about 1154 m by 2500 cal yr BP. This large change in lake state (Fig. 9) is coincident with the start of the late Holocene dry period (Mensing et al., Reference Mensing, Sharpe, Tunno, Sada, Thomas, Starratt and Smith2013), which was a multicentennial long dry period affecting the Great Basin from about 2800 to 1900 cal yr BP. This abrupt lake-level fall is constrained by the presence of cultural materials found on the shore of Pyramid Lake by Tuohy (Reference Tuohy, Willig, Aikens and Fagan1988). Lake level had recovered by about 1300 cal yr BP, reaching an elevation of about 1189 m.
During the subsequent Medieval Climate Anomaly and the Little Ice Age, Pyramid levels apparently fluctuated within a relatively narrow range from about 1172 to 1182 m (Fig. 9), or essentially within the early historical range, prior to major Truckee River diversions (Hardman and Venstrom, Reference Hardman and Venstrom1941). The δ18O record of Benson et al. (Reference Benson, Kashgarian, Rye, Lund, Paillet, Smoot, Kester, Mensing, Meko and Lindstrom2002) only fluctuates by about 1‰ during this period, also indicating low amplitude lake-level changes.
This relative stability is in contrast to the records of Walker Lake (Adams, Reference Adams2007; Hatchett et al., Reference Hatchett, Boyle, Putnam and Bassett2015), the Carson Sink (Adams, Reference Adams2003, Reference Adams2008), Mono Lake (Stine, Reference Stine1990, Reference Stine1994), and Owens Lake (Bacon et al., Reference Bacon, Lancaster, Stine, Rhodes and McCarley Holder2018), all of which experienced relatively large lake-level fluctuations over the last 1000 yr or so. One potential explanation for this discrepancy is that the Truckee drainage basin lies to the north of the drainage basins for Walker, Mono, and Owens lakes. In tree ring–based maps showing the spatiotemporal distributions of the Medieval droughts in western North America (Cook et al., Reference Cook, Seager, Heim, Vose, Herweijer and Woodhouse2010), the Truckee basin is just to the north of the areas that were most severely affected by these droughts and therefore may have escaped their worst effects. Similarly, the Medieval pluvial (875–829 cal yr BP; Cook et al., Reference Cook, Seager, Heim, Vose, Herweijer and Woodhouse2010) did not seem to have much of an effect in the Pyramid basin, even though an unusually large lake was present at this time in the Carson Sink to the east (Adams, Reference Adams2003, Reference Adams2008, Reference Adams2012a).
Documented lake-level changes were converted into other metrics to provide additional insight into the magnitude of hydrologic changes over the late Holocene. Figure 10 presents three derivative lake state curves that were constructed using the hypsometric relations of the basin (Fig. 6) and are expressed in terms of surface area changes, evaporation volume changes, and lake volume changes through time. Combining these metrics with knowledge of Truckee River discharge and historical lake evaporation rates provides a more complete view of the magnitude of hydrologic changes that have occurred in this system over the last 5000 years.
Plots of fluctuations in lake state over the last 5000 yr. (A) Simplified lake-surface elevation changes. (B) Fluctuations in surface area (solid line) and total annual evaporation (dashed line), which is based on surface area. (C) Changes in lake volume over time.

During the late Holocene, lake levels at Pyramid and Winnemucca lakes have fluctuated by about 40 m, which corresponds to changes in lake-surface area ranging from about 450 to 900 km2, or about a factor of two (Fig. 10). Assuming an annual lake-surface evaporation rate around 125 to 135 cm/yr (Milne, Reference Milne1987), the range in the total annual volume of water evaporated from Pyramid and Winnemucca lakes has ranged from about 0.45 to 0.95 km3, also roughly a factor of two. Similarly, the volume of these lakes has fluctuated by about a factor of two over the late Holocene, ranging from about 25 to 55 km3 (Fig, 10). The surface area and volume constraints imposed by the hypsometries of the basins (Fig. 6) therefore indicate that discharge must have been significantly higher than the modern average (~0.67 km3), for a period of years or decades, in order for lake levels to have risen above 1178–1182 m and achieve the late Holocene high stands (Fig. 9).
The largest drop in Pyramid Lake and Winnemucca Lake levels occurred around 2800 cal yr BP when surface elevation fell from 1195 m to about 1154 m, and the lake basin lost approximately 30 km3 of water (Figs. 9 and 10). The radiocarbon data do not provide much precision in constraining the rate of lake-level fall, but based on modern evaporation rates, this change must have occurred over at least several to many decades.
The historical drop from about 1180 m in 1910 to Pyramid's historical low stand of about 1154 m in 1967 (Fig. 4) may provide a similar but modern example of how much inflow had to be decreased to cause a 26-m drop and loss of about 20 km3 of water in about six decades. Figure 3 shows the annual discharge flowing past two gauges along the Truckee River, one above where the largest withdrawals occur (Farad) and one below where they occur (Below Derby). Even though in large flow years the annual totals are similar, during most years about one half of the Truckee River annual flow is diverted for other uses, which has caused the precipitous drop in Pyramid levels over the last century. Suffice it to say that a 50% reduction in natural flow from the Truckee River drainage occurring over several decades would present a serious water supply issue in this region. Based on the late Holocene record of Pyramid Lake, however, this magnitude of drought is within the realm of possibility for future climatic scenarios, even without considering the potentially compounding effects of climate change.
Overall, the late Holocene lake-level fluctuations at Pyramid and Winnemucca lakes offer a perspective on the magnitude and duration of climate extremes possible in the northern Sierra Nevada, both on the dry and wet ends of the climatic continuum. This is because the climate boundary conditions that govern eastern Pacific Ocean–western North America climate have been in place for about the last 5000 years (e.g., Wanner et al., Reference Wanner, Beer, Butikofer, Crowley, Cubasch, Fluckiger and Goosse2008), so whatever has occurred over the last few thousand years may again be possible in the future. Thus, understanding the late Holocene paleohydrology of a region helps define possible future hydrologic variability.
CONCLUSIONS
A new lake-level curve is presented for the Pyramid Lake and Winnemucca Lake basins in western Nevada that spans the time period from when Lake Lahontan occupied the basins and was carving shorelines at an elevation of about 1338 m through to the present when Pyramid Lake would naturally fluctuate around 1175–1182 m. This curve is based on existing radiocarbon data culled from the literature, new radiocarbon ages, and new luminescence ages collected from beach ridges at the north end of the Winnemucca Lake basin.
Since the late Pleistocene high stand of Lake Lahontan, lake-level fluctuations have been decreasing in amplitude through time. The YD high stand in Pyramid and Winnemucca Lakes is confirmed to have reached an elevation of about 1230 m; this high stand also integrated a number of other subbasins in the western part of the Lahontan system (Adams et al., Reference Adams, Goebel, Graf, Smith, Camp, Briggs and Rhode2008). During the Holocene, however, lake levels have alternated between lows of about 1154 m to a high stand at about 1200 m that was roughly coincident with the eruption of the Mazama tephra at about 7700 cal yr BP. After relatively low levels in the middle Holocene, the lake again expanded to reach levels around 1185–1195 m during the Neopluvial period (~4800–3400 cal yr BP) before crashing to low levels during the late Holocene dry period. By about 2000 cal yr BP, lake levels had recovered, briefly rising to about 1189 m by about 1200 cal yr BP. Since that time, lake levels have fluctuated within a relatively narrow elevation range of about 1170–1180 m, except for the historical period when they have been artificially lowered because of upstream water diversions.
These late Holocene lake-surface elevation changes correspond to surface area changes ranging from about 500 to 900 km2 and volumetric changes ranging from about 25 to 55 km3. Based on modern Truckee River inflow records and Pyramid Lake evaporation rates, these changes must have occurred over at least decades, suggesting that droughts that have occurred in this drainage basin have been far more severe than any droughts that have occurred during the historical period.
Accurately defining the timing, magnitude, and duration of late Holocene lake-level fluctuations is relevant to water supply concerns because these changes have occurred under approximately the same climate boundary conditions that exist today. Any climate-induced hydrologic fluctuations that have occurred in these basins over the last few thousand years are still possible in the future. Another way of thinking about this is that defining the magnitude of lake-level changes during the late Holocene places bounds on possible future fluctuations in water supply.
ACKNOWLEDGEMENTS
This work was partially funded by National Science Foundation grant EAR1252225 and by the General Frederick Lander Endowment administered by the Desert Research Institute, but the authors are responsible for all analyses and interpretations. We thank Mike Lawson and Chris McGuire for their help in luminescence sample collection, Wendy Barrera and Tom Capaldi for sample preparation, and Nathan Brown for sample preparation and measurements. K.D. Adams thanks John Bell for the many helpful discussions and field trips to the lower Truckee River over the years, and Wally Broecker for the multiple radiocarbon ages from the 1231 m trench at Winnemucca Lake. Sophie Baker was very helpful in preparing some of the figures in this paper. Helpful reviews by Marith Reheis, David Miller, Jim O'Connor, and Noah Abramson improved the clarity and content of this manuscript.
SUPPLEMENTARY MATERIAL
The supplementary material for this article can be found at https://doi.org/10.1017/qua.2018.134.