Introduction
Understanding the dietary ecology of biotic organisms, both today and in the past, is critical to current species management and conservation efforts. A powerful tool used to make conservation decisions in the face of ongoing climate change is bioclimatic envelope models, which predict an organism’s future distribution (e.g., Araújo and Townsend Peterson Reference Araújo and Townsend Peterson2012). However, these models make a critical assumption that “what an animal does today an animal will do tomorrow,” also known as niche conservatism. Niche conservatism can also be defined as the capacity of a species to retain components of its fundamental niche over time (Hadly et al. Reference Hadly, Spaeth and Li2009) or the phenomenon that enables species to persist in ecological environments over time (Wiens and Graham Reference Wiens and Graham2005). Regardless of the precise definition, assuming that niches are static over time may not be valid, even over short time spans. While recent reviews reveal that “niche conservatism” is generally widespread (e.g., Wiens and Graham Reference Wiens and Graham2005; Losos Reference Losos2008; Peterson Reference Peterson2011), even over deep time (Hadly et al. Reference Hadly, Spaeth and Li2009; DeSantis et al. Reference DeSantis, Beavins Tracy, Koontz, Roseberry and Velasco2012a), the majority of these studies focus on assessing an organism’s niche based on range areas or characteristics of those occupied ranges (as broken down to temperature and precipitation, in most cases). However, studies of mammalian dietary niches over time have demonstrated a mixture of results, with some taxa maintaining static dietary niches (e.g., like tapirs, also referred to as “living fossils”; DeSantis and MacFadden Reference DeSantis and MacFadden2007) and others shifting their diets with changing climatic conditions like interglacial warming during the Pleistocene (DeSantis et al. Reference DeSantis, Feranec and MacFadden2009). This dietary plasticity documents the adaptability of mammalian dietary behavior in response to available resources (and potential biotic interactions) and falsifies the idea that dietary niches are conserved over time. Therefore, examining whether and how dietary niches are conserved over time is critical to assessing the scientific foundation upon which conservation decisions are made, including how much confidence we put in bioclimatic envelope models that assume niche conservatism.
An underutilized but valuable model organism for testing dietary niche conservatism is the spotted hyena (Crocuta crocuta). While C. crocuta is now largely restricted to sub-Saharan Africa, the ranges of Pleistocene cave spotted hyenas (C. crocuta spelaea in Europe and C. crocuta ultima in Asia) were much wider. Pleistocene Crocuta fossils are known from England, across Europe, Africa, and Asia, to the Pacific island of Taiwan, and into southeast Asia (Tseng and Chang Reference Tseng and Chang2007). A recently proposed evolutionary model for Eurasian Crocuta populations during the past 400 Kyr, based on ancient mtDNA, postulates that genetic isolation of the East Asian populations of Crocuta occurred between 400–230 Ka (Sheng et al. Reference Sheng, Soubrier, Liu, Werdelin, Llmas, Thomson, Tuke, Wu, Hou, Chen, Lai and Cooper2014). A bottleneck in genetic diversity of the postdivergence Asian and European Crocuta populations was suggested as one possible mechanism for the local extinction of those populations during the late Pleistocene. One key question that remains unanswered with this scenario, however, is whether East Asian Crocuta populations exhibited any ecological or niche divergence from the western Eurasian populations (to which extant Crocuta are most closely related) in concordance with evidence of genetic divergence, or whether dietary niches were conserved over time. Given the drastic range contraction of C. crocuta, and recent ancient DNA data that suggest the presence of genetically unique Pleistocene Crocuta populations in Asia (Sheng et al. Reference Sheng, Soubrier, Liu, Werdelin, Llmas, Thomson, Tuke, Wu, Hou, Chen, Lai and Cooper2014), understanding differences and similarities in the ecological niches and dietary preferences of extinct Crocuta populations versus their modern counterparts is critical for elucidating whether niche conservatism is upheld over this narrow temporal window (less than 400–230 Ka) and across a broad geographic range. Further, East Asian populations of C.c. ultima had disparate mammalian communities, including the absence of social lions (as are sympatric with C. crocuta today; Kruuk Reference Kruuk1972; Schaller Reference Schaller1972), but did include wolves (Canis lupus). Furthermore, whereas rhinos and deer are found with C. c. ultima in our study area, no antelopes or other bovids (common prey of African Crocuta) are known (Liu et al. Reference Liu, Wagner, Chen, Sheng, Chen, Jiangzuo and Liu2015). With these notable differences in geographic location and mammalian communities, we can here test whether the extant and extinct hyenas (members of the same species, C. crocuta) both maintained a hyperscavenging dietary niche and thus conserved their dietary ecology during the latest Pleistocene.
In addition to the reasons outlined above, hyaenids are more broadly an ideal taxon for assessing niche conservatism, as they have long exhibited an impressive range of ecological and morphological adaptations throughout their ~28 Myr evolutionary history (Werdelin and Solounias Reference Werdelin and Solounias1996). Although three out of the four living hyaenid species are categorized as specialized bone-cracking carnivores, extinct hyaenid species represented a wide range of ecological morphologies from omnivorous and scansorial basal species, jackal- and wolf-like transitional forms, to bone-cracking and highly cursorial species (Werdelin and Solounias Reference Werdelin and Solounias1991). In addition, the fourth living hyaenid, aardwolf, is a termite specialist with a much reduced, peg-like dentition. Mirroring their macroevolutionary, taxonomic (more than 80 described species), and ecomorphological (six dietary/locomotor categories) diversity, paleogeographic distributions of hyaenids were much more widespread than their modern-day, largely African, Middle Eastern, and South Asian distributions. The extinction of hyaenids in Europe and most of Asia occurred very recently, in the wave of megafaunal extinctions during the end-Pleistocene; thus, this group as a whole demonstrates the capacity to alter their dietary niches over deeper time and across their range.
Clarifying the dietary ecology of extinct carnivorans has traditionally relied on morphological assessments of teeth and other craniodental features (e.g., Van Valkenburgh Reference Van Valkenburgh1988, Reference Van Valkenburgh1999, Reference Van Valkenburgh2007; Werdelin Reference Werdelin1996). For example, the robust cranium, hypertrophied dentition, and mandibles with high dorsoventral bending strength are classic examples of features indicative of bone-cracking adaptations and are exemplified by C. crocuta (Biknevicius and Ruff Reference Biknevicius and Ruff1992; Tseng and Binder Reference Tseng and Binder2010). However, assessing features such as bending strength was traditionally based on beam theory and calculations using linear measurements (Biknevicius and Ruff Reference Biknevicius and Ruff1992). More recently, finite element analysis (FEA) has allowed for a more detailed assessment of structural stress dissipation patterns, also revealing potential dietary behavior (Rayfield Reference Rayfield2007). In carnivorans in particular, FEA results have demonstrated different ways in which carnivorans have evolved to handle the increased muscle forces required in bone cracking—with more robust crania and potentially unique muscle activation patterns in hyaenids and borophagine canids to help dissipate cranial stress during biting (Tseng and Wang Reference Tseng and Wang2010; Tseng Reference Tseng2013). Further, FEA-based approaches to clarifying the overall linkage between carnivoran skull biomechanics and masticatory and predatory behavior show promise to further reveal the complex interplay between morphological adaptation and phylogenetic history (Tseng and Flynn Reference Tseng and Flynn2015a). Finite element models have also helped constrain dietary interpretations of noncarnivorans including carnivorous marsupials, suggesting that the recently extinct Tasmanian wolf Thylacinus cynocephalus consumed smaller prey and were poorly suited to engage in bone crushing, in contrast to the extant Tasmanian devil Sarcophilus harrisii and the extinct marsupial lion (Wroe Reference Wroe2008). This and other current and potential applications of FEA in paleobiology makes this simulation method an increasingly valuable tool for testing functional morphological hypotheses (Bright Reference Bright2014).
Dental microwear texture analysis (DMTA) has similarly advanced our understanding of durophagous behavior in extinct taxa by moving beyond inferences of potential diet as based on morphological assessments and instead capturing the dietary behavior of an animal during its life. DMTA is useful for assessing an animal’s realized diet, as it “records” food items consumed over the past few days to weeks of an animal’s life (Teaford Reference Teaford1988). Instead of focusing on individual features, as traditional dental microwear methods require (e.g., Taylor and Hannam Reference Taylor and Hannam1987; Robson and Young Reference Robson and Young1990; Van Valkenburgh et al. Reference Van Valkenburgh, Teaford and Walker1990; Anyonge Reference Anyonge1996; Goillot et al. Reference Goillot, Blondel and Peigné2009; Peigné et al. Reference Peigné, Goillot, Germonpré, Blondel, Bignon and Merceron2009; Münzel et al. Reference Münzel, Rivals, Pacher, Döppes, Rabeder, Conard and Bocherens2014), DMTA characterizes three-dimensional (3D) surfaces according to the variables of complexity (Asfc), anisotropy (epLsar), and textural fill volume (Tfv), using scale-sensitive fractal analysis (SSFA; Ungar et al. Reference Ungar, Brown, Bergstrom and Walkers2003; Scott et al. Reference Scott, Ungar, Bergstrom, Brown, Grine, Teaford and Walker2005, Reference Scott, Ungar, Bergstrom, Brown, Childs, Teaford and Walker2006; DeSantis Reference DeSantis2016). Specifically, complexity is a scale-sensitive measure of roughness and is used to distinguish taxa that consume hard, brittle foods from those that eat softer ones, with greater complexity indicative of hard-object processing (such as bone, i.e., durophagy) in carnivores (Ungar et al. Reference Ungar, Brown, Bergstrom and Walkers2003; Scott et al. Reference Scott, Ungar, Bergstrom, Brown, Grine, Teaford and Walker2005, Reference Scott, Ungar, Bergstrom, Brown, Childs, Teaford and Walker2006; Schubert et al. Reference Schubert, Ungar and DeSantis2010; DeSantis et al. Reference DeSantis, Schubert, Scott and Ungar2012b, Reference DeSantis, Schubert, Schmitt-Linville, Ungar, Donohue and Haupt2015; Donohue et al. Reference Donohue, DeSantis, Schubert and Ungar2013; DeSantis and Haupt Reference DeSantis and Haupt2014; DeSantis Reference DeSantis2016; Jones and DeSantis Reference Jones and DeSantis2016). Anisotropy is the degree to which surface textures show a preferred orientation, such as the dominance of parallel striations that might be formed by carnassial action in meat slicing, given constraints to tooth–tooth movement during occlusion (Ungar et al. Reference Ungar, Brown, Bergstrom and Walkers2003; Scott et al. Reference Scott, Ungar, Bergstrom, Brown, Grine, Teaford and Walker2005, Reference Scott, Ungar, Bergstrom, Brown, Childs, Teaford and Walker2006; Schubert et al. Reference Schubert, Ungar and DeSantis2010; DeSantis et al. Reference DeSantis, Schubert, Scott and Ungar2012b, Reference DeSantis, Schubert, Schmitt-Linville, Ungar, Donohue and Haupt2015; Donohue et al. Reference Donohue, DeSantis, Schubert and Ungar2013; DeSantis and Haupt Reference DeSantis and Haupt2014; DeSantis Reference DeSantis2016). Textural fill volume is a measure of the difference in volume filled by large- (10 μm) and small- (2 μm) diameter square cuboids, with high values indicating many deep features between these sizes (Ungar et al. Reference Ungar, Brown, Bergstrom and Walkers2003; Scott et al. Reference Scott, Ungar, Bergstrom, Brown, Grine, Teaford and Walker2005, Reference Scott, Ungar, Bergstrom, Brown, Childs, Teaford and Walker2006). The use of 3D data is particularly critical in carnivorans, where for a given surface, pits may actually decline in frequency but increase in size with increased durophagy (DeSantis et al. Reference DeSantis, Scott, Schubert, Donohue, McCray, Van Stolk, Wilburn, Greshko and O’Hara2013, Reference DeSantis, Schubert, Schmitt-Linville, Ungar, Donohue and Haupt2015); thus, DMTA is necessary for properly resolving diet in carnivorans and has the added benefit of minimizing or eliminating observer variability, as individuals are not counting pits and scratches.
Extant feliforms with known differences in diet also have distinct 3D microwear surfaces (Schubert et al. Reference Schubert, Ungar and DeSantis2010; DeSantis et al. Reference DeSantis, Schubert, Scott and Ungar2012b, Reference DeSantis, Schubert, Schmitt-Linville, Ungar, Donohue and Haupt2015). For example, the African cheetah—known to eat primarily flesh and avoid bone (Van Valkenburgh Reference Van Valkenburgh1996, Hayward et al. Reference Hayward, Hofmeyr, O’Brien and Kerley2006)—has dental microwear that is characterized as having high anisotropy and lower complexity (Schubert et al. Reference Schubert, Ungar and DeSantis2010; DeSantis et al. Reference DeSantis, Schubert, Scott and Ungar2012b, Reference DeSantis, Schubert, Schmitt-Linville, Ungar, Donohue and Haupt2015). In contrast, C. crocuta has the highest complexity of any mammal examined to date, suggestive of brittle object consumption, including bone (Schubert et al. Reference Schubert, Ungar and DeSantis2010; DeSantis et al. Reference DeSantis, Schubert, Scott and Ungar2012b, Reference DeSantis, Schubert, Schmitt-Linville, Ungar, Donohue and Haupt2015), and consistent with observed dietary behavior (Estes Reference Estes1991; Van Valkenburgh Reference Van Valkenburgh1996; Nowak Reference Nowak2005; Hayward Reference Hayward2006). The African lion, observed to be intermediate in dietary behavior between cheetahs and spotted hyenas (including incidence of durophagy; Van Valkenburgh Reference Van Valkenburgh1996; Hayward and Kerley Reference Hayward and Kerley2005; Hayward Reference Hayward2006), has more intermediate microwear (Schubert et al. Reference Schubert, Ungar and DeSantis2010; DeSantis et al. Reference DeSantis, Schubert, Scott and Ungar2012b, Reference DeSantis, Schubert, Schmitt-Linville, Ungar, Donohue and Haupt2015), although it is not distinct from C. crocuta in complexity values.
Although prior work has demonstrated the efficacy of DMTA in evaluating diets of extinct carnivorans (e.g., Schubert et al. Reference Schubert, Ungar and DeSantis2010; Ungar et al. Reference Ungar, Scott, Schubert and Stynder2010; DeSantis et al. Reference DeSantis, Schubert, Scott and Ungar2012b, Reference DeSantis, Schubert, Schmitt-Linville, Ungar, Donohue and Haupt2015; Donohue et al. Reference Donohue, DeSantis, Schubert and Ungar2013; DeSantis and Haupt Reference DeSantis and Haupt2014; Jones and DeSantis Reference Jones and DeSantis2016), we aim here to expand the DMTA baseline of extant feliforms to include larger samples sizes than were previously possible, including a broader diversity of hyena species, including those thought to be more omnivorous (i.e., the brown hyena Parahyaena brunnea, a.k.a. Hyaena brunnea; Mills Reference Mills1989). Specifically, P. brunnea scavenges less than C. crocuta (Mills Reference Mills1989) and consumes a significant proportion of fruit (fecal samples from individuals in the central Kalahari desert have contained fruit rinds and seeds, up to ~50% by volume during dry months; Owens and Owens Reference Owens and Owens1978; Mills Reference Mills1989). The striped hyenas, although less well studied, are documented to consume smaller prey items than C. crocuta, and much like the brown hyena (and in contrast to C. crocuta) they tend to forage alone (Mills Reference Mills1989; Wagner Reference Wagner2006). These dietary differences may be recorded in the dental microwear textures of their teeth, and if so, could help improve our understanding of the dietary behavior of extinct carnivorans.
The macroscopic wear of teeth (i.e., whether teeth are minimally, moderately, or extremely worn, as defined by degree of dentin exposure) is often used to place individuals into age categories (e.g., Stander Reference Stander1997; Binder and Van Valkenburgh Reference Binder and Van Valkenburgh2010; Olifiers et al. 2010) but may also have the potential to reveal dietary information (Van Valkenburgh Reference Van Valkenburgh1988). While macroscopic wear is affected by the duration of time an animal has been alive, the degree of wear may also represent a longer-term picture of the dietary behavior of carnivorans. Additionally, other proxies, including tooth breakage, may be useful for inferring diet, specifically the degree of carcass utilization (Van Valkenburgh and Hertel Reference Van Valkenburgh and Hertel1993; Van Valkenburgh Reference Van Valkenburgh2009; Binder and Van Valkenburgh Reference Binder and Van Valkenburgh2010). However, as teeth can also break from prey capture and defensive interactions, tooth breakage data may not be a direct measure of diet and have been found to contradict other dietary proxy data (DMTA; DeSantis et al. Reference DeSantis, Schubert, Scott and Ungar2012b, Reference DeSantis, Schubert, Schmitt-Linville, Ungar, Donohue and Haupt2015; DeSantis and Haupt Reference DeSantis and Haupt2014). Broken teeth can also be a fairly rare event, with extant carnivores representing very different dietary strategies having 5–10% broken canines (Van Valkenburgh Reference Van Valkenburgh2009); thus, this method may require higher sample sizes than are typically available and may only be useful for the most well-preserved carnivoran faunas (i.e., the La Brea Tar Pits, in Southern California).
Here, we aim to assess whether dietary niche conservatism is upheld over a narrow temporal window (<400–230 Ka), across a broad geographic range (Africa to Asia), and present in ecosystems with a different mix of apex predators (including the absence of social lions in Asia during the late Pleistocene). Specifically, we assess whether the dietary ecology of C. c. ultima (from China) was similar to the extant African spotted hyena C. crocuta. We apply a multiproxy approach to assess dietary behavior of extinct and extant hyenas. Specifically, we use FEA of C. c. ultima and C. crocuta crania to assess biomechanical response of the skull to biting forces—revealing potential dietary behavior as based on morphological evidence and models of stress dissipation. Further, we quantify the textural properties of food consumed in the extinct C. c. ultima as compared with extant feliforms, including the African cheetah, African lion, brown hyena, striped hyena, and spotted hyena. Finally, we use this improved modern baseline of dental microwear textures of feliforms to further clarify relationships between macroscopic wear (the degree of dentin exposure) and dental microwear textures. Collectively, these data have the potential to reveal whether dietary niches are conserved over time. Further, our multiproxy approach is a model that can be used to infer dietary ecology in a broad diversity of extinct carnivorans.
Materials and Methods
Site and Specimen Background
During 2003–2006, commercial excavation of Lingxian Cave as a tourist attraction resulted in the discovery of fossil mammal remains, and systematic excavation of the fossil deposit was subsequently conducted under the supervision of one of the authors (J.L.). Up to the present, thousands of skeletal elements belonging to Crocuta have been excavated, including 30 intact or broken skulls and three relatively complete skeletons. In addition, dozens of coprolites were found along with the bones. Based on preliminary identification of the contemporaneous mammal fauna preserved in Lingxian Cave, including fossils of Cervus elaphus (red deer), Canis lupus (gray wolf), Vulpes corsac (corsac fox), Stephanorhinus kirchbergensis (Merck’s rhinoceros), and the like, Lingxian cave has delivered a typical late–middle to early–late Pleistocene faunal assemblage (Liu et al. Reference Liu, Wagner, Chen, Sheng, Chen, Jiangzuo and Liu2015).
Of the C. c. ultima specimens available from Lingxian Cave, we molded and cast 13 lower first molars for DMTA and macrowear analysis. This sample size is the largest sample of C. c. ultima around today, as the previous largest collection of C. c. ultima, from Zhoukoudian (Upper Cave), was lost or destroyed during World War II. All specimens examined are housed in the Institute of Vertebrate Paleontology and Paleoanthropology in Beijing, China. Extant feliform specimens used in this study include the cheetah Acinonyx jubatus (n=36), the African lion Panthera leo (n=29), the brown hyena Parahyaena brunnea (n=11), the striped hyena Hyaena hyaena (n=35), and the spotted hyena Crocuta crocuta (n=26). While a portion of these specimens were analyzed for DMTA and included in prior studies (e.g., Schubert et al. Reference Schubert, Ungar and DeSantis2010; DeSantis et al. Reference DeSantis, Schubert, Scott and Ungar2012b, Reference DeSantis, Schubert, Schmitt-Linville, Ungar, Donohue and Haupt2015; DeSantis and Haupt Reference DeSantis and Haupt2014), we have more than tripled the number of specimens included in the DMTA analysis and have reanalyzed the surfaces of previously published specimens on the Sensofar PLu neox optical profiler at Vanderbilt University. All extant specimens are wild caught and housed in publicly accessible collections at the American Museum of Natural History (New York, N.Y.; AMNH); the Field Museum of Natural History (Chicago, Ill.; FMNH); the National Museum of Natural History, Smithsonian Institution (Washington, D.C.; USNM); and the Iziko South African Museum (Cape Town, South Africa; SAM). FEA was performed on one specimen of C. crocuta from the National Museum of Natural History (a wild-caught female specimen, USNM 164506) and a fossil specimen of C. c. ultima from the Lingxian Cave (LXD0007), City of Qinhuangdao, Heibei Province collection currently housed in the Institute of Vertebrate Paleontology and Paleoanthropology (IVPP) in Beijing, China.
Finite Element Analysis
A model of an adult, wild-caught specimen of C. crocuta from Tseng et al. (Reference Tseng, Antón and Salesa2011) was used for comparison with a newly constructed model of a fossil Crocuta from Lingxian Cave. The extant Crocuta model, built from USNM 164506, was computed tomography (CT) scanned by Blaire Van Valkenburgh (University of California, Los Angeles) at the University of Texas–Austin CT facility. An adult specimen of C. c. ultima from Lingxian Cave (specimen number LXD0007) was CT scanned at the Key Laboratory of Vertebrate Evolution and Human Origins, Chinese Academy of Sciences (CAS), using a custom-built scanner designed by the Institute of High Energy Physics with a beam energy of 450 kV and X-ray flux of 1.5 mA. Detector resolution was set at a pixel size of 200 μm; images were reconstructed into 2048 coronal slices with dimensions of 2048×2048 pixels using software also developed by the Institute of High Energy Physics. The finite element model of the C. c. ultima cranium was constructed as outlined in Tseng et al. (Reference Tseng, Antón and Salesa2011). The particular fossil skull analyzed was chosen based on completeness and size; LXD0007 is a nearly undamaged adult specimen with complete dentition, and therefore was used to approximate a healthy adult individual from the Lingxian Cave population. Additional fossil specimens from the locality are either less complete or were not fully prepared (to be free of sediment matrix) at the time the analyses were conducted, so we did not CT scan or analyze multiple individuals. The extant Crocuta comparative model also represents a complete adult skull and was used to represent a healthy adult individual from an extant population.
Briefly, TIFF images reconstructed from CT-scan data were imported into Mimics, Version 16 (Materialise, Leuven, Belgium) for segmentation. Bone was separated from its surrounding matrix or soft tissue by using a combination of automated and manual operations within Mimics. A 3D reconstruction was generated from the segmented layer and exported as a stereolithography (STL) file. The STL file was imported into Geomagic Studio, Version 10 (3D Systems, Cary, N.C.), in which the cranium reconstruction was smoothed to remove artifacts of image slicing during CT reconstruction, decimated to maintain comparable triangular element aspect ratios, and patched and repaired to create a “water-tight” structure for solid meshing (Dumont et al. Reference Dumont, Piccirillo and Grosse2005). The repaired 3D STL file was next imported into FEA software Strand7, Version 2.4.6 (Strand7, Sydney, Australia), in which the surface triangle mesh was converted into a solid mesh using four-noded tetrahedral elements. The final solid mesh contained element-filled regions where cortical bone is found and empty space where internal cavities (such as the braincase) are found.
Next, attachment regions of the main jaw-closing muscles (temporalis, masseter, medial pterygoid) were selected in the C. c. ultima model, with the C. crocuta model as reference, by following analogous anatomical boundaries and muscle scars that delineate the attachment regions of those muscles on the fossil specimen (Supplementary Fig. 1). Muscle input forces proportional to the surface area occupied by each muscle group were created using the BoneLoad program (Grosse et al. Reference Grosse, Dumont, Coletta and Tolleson2007; Dumont et al. Reference Dumont, Grosse and Slater2009), with the lower jaw propped open at 30 degrees gape (Bourke et al. Reference Bourke, Wroe, Moreno, McHenry and Clausen2008). Because no associated mandible was found with the fossil skull, the mandible from the C. crocuta model was scaled linearly to fit the fossil skull and used for muscle orientation estimates. The mandible from the extant model, rather than another fossil specimen, was used to orient muscle forces in the fossil model, because both cranial models represented complete adult individuals; no comparable fossil material from Lingxian Cave was available for this purpose. Muscle forces were calculated by multiplying the area occupied by each muscle by 0.3 N, the maximum contractile force of mammalian muscle fiber (Pollock and Shadwick Reference Pollock and Shadwick1994; Bennett and Taylor Reference Bennett and Taylor1995). All simulations portrayed unilateral biting, and balancing side muscle forces were accordingly adjusted to 60% of working side muscle force (Dessem and Druzinsky Reference Dessem and Druzinsky1992). Homogeneous, isotropic material properties of 18 GPa for Young’s modulus and 0.3 for Poisson’s ratio were used in both models. The models were constrained from transverse movement at the temporomandibular joints (TMJ) except for movement along the axis through the TMJ (Dumont et al. Reference Dumont, Davis, Grosse and Burrows2011); biting was simulated at each tooth position by constraining a single node from movement in the dorsoventral axis at the tip of each tooth. Bite positions from the canine to the fourth premolar were simulated. All biting scenarios were solved using the preconditioned conjugate gradient solver with 10,000 iterations.
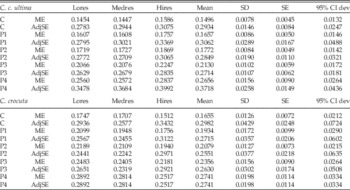
To provide an assessment of uncertainty in the FEA output results, we constructed low, medium, and high element quantity models of each skull and calculated mean and standard error values of the biomechanical parameters compared (Tseng and Flynn Reference Tseng and Flynn2015b; Tables 1, 2). For comparison, we visualized the distribution of von Mises stress as approximation of the likely locations of bone damage under a ductile mode of deformation (Nalla et al. Reference Nalla, Kinney and Ritchie2003). In addition, we constructed biomechanical profiles of mechanical efficiency (output bite force divided by total input muscle force) versus stored strain energy (a measure of stiffness, with lower values indicating higher stiffness) across the biting location to assess the overall strength and efficiency of biting (Tseng and Flynn Reference Tseng and Flynn2015a).
Attributes of finite element models of Crocuta crocuta and Crocuta crocuta ultima constructed and analyzed in the study. Low-, medium-, and high-resolution models (Lores, Medres, and Hires, respectively) were constructed to quantify uncertainty in simulation outputs.

Standardized and left and right averaged output values from FEA of cranium models. Bite positions (C, canine; P1–4, first to fourth premolars) and the resulting mechanical efficiency (ME, ratio between output bite force and input muscle force) and skull strain energy (AdjSE, in units of joule, standardized relative to model surface area and volume as detailed in Dumont et al. [Reference Dumont, Grosse and Slater2009]). Low-, medium-, and high-resolution models (Lores, Medres, and Hires, respectively) and their mean, standard deviation, standard error, and 95% confidence interval (CI) distance from the mean are listed.

Dental Microwear Texture Analysis
For all feliforms here studied, we analyzed microwear features on the lower carnassial shearing facet of the m1 trigonid (as described in Schubert et al. Reference Schubert, Ungar and DeSantis2010; DeSantis et al. Reference DeSantis, Schubert, Scott and Ungar2012b, Reference DeSantis, Schubert, Schmitt-Linville, Ungar, Donohue and Haupt2015; DeSantis and Haupt Reference DeSantis and Haupt2014). All tooth facets analyzed were cleaned with cotton swabs soaked in acetone (to remove preservatives such as Butvar) and subsequently molded using a polyvinylsiloxane dental impression material (President’s Jet regular body, Coltène-Whaledent, Cuyahoga Falls, Ohio). Tooth replicas were then prepared using Epotek 301 epoxy resin and hardener (Epoxy Technologies, Billerica, Mass.).
DMTA was performed on all replicas that preserved antemortem microwear on the Sensofar PLu neox optical profiler. All specimens were scanned in three dimensions in nine areas (in a 3×3 grid), subsequently stitched together, leveled, and then subdivided into four adjacent areas of equal size (102×138 μm2) for a total sampled area of 204×276 μm2, identical to sized areas in previously published DMTA studies (e.g., Schubert et al. Reference Schubert, Ungar and DeSantis2010; DeSantis et al. Reference DeSantis, Schubert, Scott and Ungar2012b, Reference DeSantis, Schubert, Schmitt-Linville, Ungar, Donohue and Haupt2015). The measured neighbor algorithm was applied to all areas on the scan where no data were collected (this is typically due to steep surfaces and approximately <2% of a given surface) and resulting surface files (.sur) were created. All surface files were analyzed using SSFA software (ToothFrax and SFrax, Surfract Corporation, www.surfract.com) to characterize tooth surfaces according to complexity (Asfc), anisotropy (epLsar), and textural fill volume (Tfv).
None of the DMTA variables here assessed are normally distributed for all subgroups being compared (as determined using Shapiro-Wilk tests); therefore, nonparametric statistical tests (e.g., Kruskal-Wallis) are used to compare differences between taxa. We also used Dunn’s procedure (Dunn Reference Dunn1964) to conduct multiple comparisons of complexity, anisotropy, and textural fill volume between taxa. Further, as the Bonferroni correction is meant to reduce the likelihood of false positives (type I errors) by taking into consideration the number of comparisons being made, it also increases the probability of false negatives (type II errors) and is therefore not appropriate for our analyses (Cabin and Mitchell Reference Cabin and Mitchell2000; Nakagawa Reference Nakagawa2004). We ran correlation tests to assess the significance of relationships between DMTA and dental macrowear characterizations and between individual dental macrowear characterizations of different individuals. Finally, we statistically compared previously acquired data from A. jubatus, P. leo, and C. crocuta from a white-light confocal microscope at the University of Arkansas (in the Department of Anthropology; DeSantis et al. Reference DeSantis, Schubert, Scott and Ungar2012b) with data acquired on the Sensofar PLu neox optical profiler at Vanderbilt University (Wilcoxon signed-rank tests).
Dental Macrowear
Dental macrowear, as defined here, is a method of categorizing teeth into categories that reflect the degree of macroscopic wear, and is similar to herbivore mesowear, which classifies teeth into categories based on tooth shape, relief, and a combined numerical score (e.g., Fortelius and Solounias Reference Fortelius and Solounias2000; Rivals et al. Reference Rivals, Mihlbachler and Solounias2007; Mihlbachler et al. Reference Mihlbachler, Rivals, Solounias and Semprebon2011; Loffredo and DeSantis Reference Loffredo and DeSantis2014). We have classified carnivore teeth into one of three discrete categories representing minimal, moderate, and extreme macrowear. Specifically, these categories are defined as follows: (1) minimal macrowear, wear facets are visible but little to no dentin (approximately <1 mm) is exposed; (2) moderate macrowear, wear facets are moderate to large and dentin is exposed (>1 mm); and (3) extreme macrowear, wear facets are well developed and significant dentin is exposed (~the width of dentin exposure is greater than the wear facets).
All teeth examined for DMTA were here classified into macrowear categories by L.R.G.D., Z.J.T., A.H., and two trained paleontology students (J. Bradham and D.B. Jones). The relative proportion of teeth in each category was calculated per extant species. Further, average macrowear scores were calculated per species based on assignments made by L.R.G.D. and average scores based on median values per tooth of the five total observers. We compared macrowear assignments made by the lead author (L.R.G.D.) with the median of five observers (Wilcoxon signed-rank test). Further, we calculated the percent of teeth scored the same as the lead author to assess the degree of observer variability. Finally, these macrowear scores were compared between extant species with known dietary behavior to assess whether dietary behavior can be inferred based on macrowear scores alone. Further, dental macrowear was compared with dental microwear at the species level and when including all feliforms to evaluate whether dental microwear textures and dental macrowear are significantly correlated (Spearman’s rank-order correlations).
Results and Discussion
Finite Element Analysis
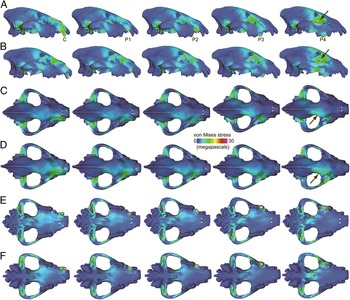
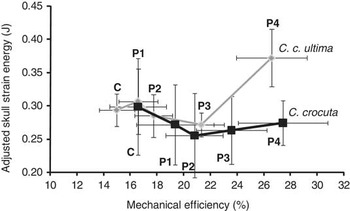
The overall distributions of von Mises stress in the C. c. ultima and C. crocuta models are similar across biting simulations from the canine to the third premolar (Fig. 1). In lateral and dorsal views, a band of heightened stress can be observed to stretch from the bite point through the rostrum and onto the frontal bone. Lateral to the frontal region, the anterior portion of the zygomatic arches also exhibit heightened von Mises stress (Fig. 1). In the ventral view, the more anterior bite points place more stress along the palate, whereas the posterior bite points create stress in the pterygoid region. The largest difference between the hyena models is the presence of relatively higher stress in the orbital region of the C. c. ultima model than in the C. crocuta model during P4 biting simulations (Fig. 1). This visual difference in von Mises stress distribution is corroborated by differences in adjusted skull strain energy values (Fig. 2, raw data in Supplementary Tables 1 and 2); at the P4 position, the C. c. ultima model is significantly less stiff (as indicated by the distinct values of strain energy with nonoverlapping 95% confidence intervals) than the corresponding position in the C. crocuta model. However, mechanical efficiency (ratio between output bite force and input muscle force) is not significantly different at the P4 between the models (Fig. 2, Table 2). All other bite positions simulated are also not significantly different between the hyena models. The results of the FEA indicate that adult skulls of C. crocuta and C. c. ultima largely functioned in similar ways in terms of stiffness and efficiency changes across the dentition. The largest difference between the skull models is located at the P4, the carnassial tooth. Carnassials are the main shearing teeth in hypercarnivorous carnivorans; the lingual face of the upper P4 occludes against the labial face of the lower m1 to create self-sharpening wear facets with cutting enamel edges. Modern spotted hyenas also use their carnassials to crack bones (Van Valkenburgh Reference Van Valkenburgh1996), and extinct carnivorans such as some borophagine canids exhibit such extreme wear on the carnassials from durophagy that shearing function was likely lost (Werdelin Reference Werdelin1989). Significantly lower skull stiffness during P4 biting simulations indicates that C. c. ultima likely could not process prey tissues (soft and/or hard) with the same degree of efficiency as modern Crocuta, using the carnassial teeth.
Von Mises stress distributions from FEA biting simulations of hyena cranium models. Results for canine to fourth premolar (P4) simulations are shown. Lateral view of C. c. ultima model (A), lateral view of C. crocuta model (B), dorsal view of C. c. ultima model (C), dorsal view of C. crocuta model (D), ventral view of C. c. ultima model (E), ventral view of C. crocuta model (F). Hotter/brighter shades indicate higher stress. Arrows indicate differences between the P4 biting simulations of the two cranium models.

Biomechanical biting profiles of FEA results from C. c. ultima and C. crocuta cranium models. Error bars are 95% confidence interval ranges. Note significantly different stored strain-energy values in fourth premolar (P4) biting simulations between C. c. ultima and C. crocuta, with C. c. ultima having higher strain energy (less stiff cranium) than C. crocuta, when P4 biting is simulated.

Dental Microwear Texture Analysis
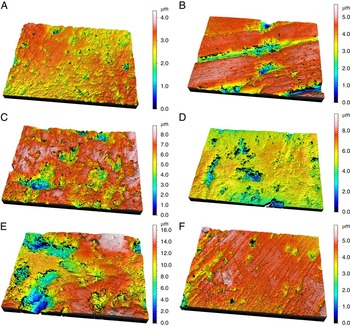
Results are presented in Tables 3 and 4, Figures 3 and 4, and Supplementary Table 3. Data published by DeSantis and colleagues (Reference DeSantis, Schubert, Scott and Ungar2012b) are not significantly different from newly analyzed surfaces in any of the species previously studied in Asfc, epLsar, or Tfv. The absence of significant species-level differences between confocal microscopes is compelling, especially as identical surfaces were not scanned on both microscopes/profilers. Thus, using data from different optical profilers should be reasonable in some cases, as long as precautions are taken to try to minimize profiler variability (Ungar et al. Reference Ungar, Ragni and DeSantis2014; Arman et al. Reference Arman, Ungar, Brown, DeSantis, Schmidt and Prideaux2016); however, all data here analyzed and discussed are from the same optical profiler, the Sensofar PLu neox optical profiler at Vanderbilt University (in the Department of Earth and Environmental Sciences).
Meshed axonometrics of digital elevation models of microwear surfaces of all extant and extinct carnivorans analyzed. Examples include: (A) Acinonyx jubatus (AMNH 35998), (B) Panthera leo (AMNH 52073), (C) Parahyaena brunnea (SAM 39359), (D) Hyaena hyaena (FMNH 31122), (E) Crocuta crocuta (AMNH 83593), and (F) Crocuta crocuta ultima (LXD0015). All axonometrics noted here represent 204×274 μm in area with depth scales noted to the right of each image.

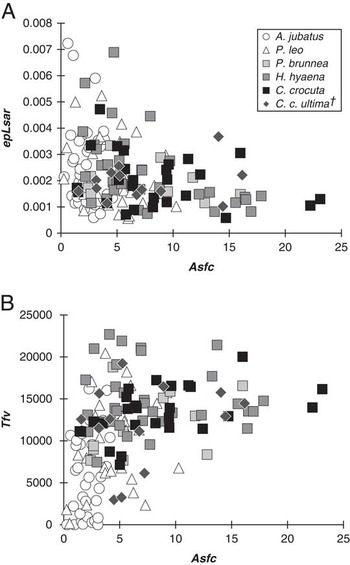
Scatterplots of (A) complexity (Asfc) and anisotropy (epLsar) and (B) complexity (Asfc) and textural fill volume (Tfv, µm3 ) of all taxa examined. † denotes extinct taxon.

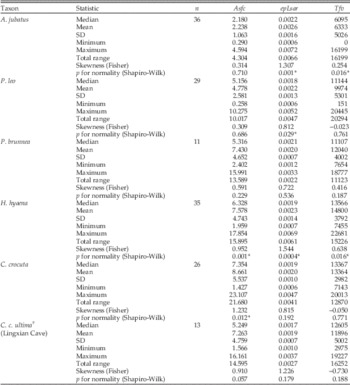
Descriptive statistics for each DMTA variable for each extant and extinct taxon. All extant taxa are wild-caught specimens. n, number of individuals sampled; Asfc, area-scale fractal complexity; epLsar, anisotropy; Tfv, textural fill volume. All teeth analyzed are lower first molars, per “Materials and Methods.”

† Extinct taxon (all other taxa are extant wild-caught specimens).
*Significant p-values (p<0.05).
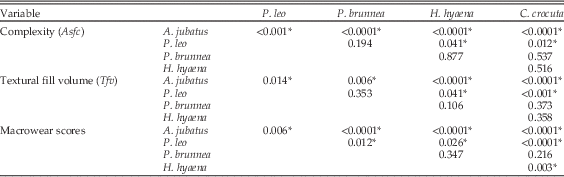
Statistical results for taxonomic comparisons of complexity values, textural fill volume values, and macrowear scores assigned by the lead author (L.R.G.D.) for all extant feliforms.

*p-values<0.05.
Similar to results in previous work (Schubert et al. Reference Schubert, Ungar and DeSantis2010; DeSantis et al. Reference DeSantis, Schubert, Scott and Ungar2012b), A. jubatus has significantly lower complexity and textural fill volume than both P. leo and C. crocuta; however, we here demonstrate that P. leo has significantly lower complexity and textural fill volume values than C. crocuta (Table 4). With additional data from both the brown and striped hyenas, we consistently find that DMTA attributes can distinguish primarily flesh-eating cheetahs from the more intermediate and generalized African lions and the bone-crunching hyenas (P. brunnea, H. hyaena, and C. crocuta; Table 4) in both complexity and textural fill volume. Further, P. brunnea falls intermediately between P. leo and the other hyenas (not significantly different from P. leo, H. hyaena, and C. crocuta; Table 4), consistent with a more generalized and omnivorous diet as compared with other extant hyenas (Owens and Owens Reference Owens and Owens1978; Mills Reference Mills1989). Additionally, none of the hyenas are significantly different from one another in either complexity or textural fill volume (Table 4). In contrast to prior work that documented significantly greater anisotropy in A. jubatus compared with P. leo and C. crocuta (Schubert et al. Reference Schubert, Ungar and DeSantis2010; DeSantis et al. Reference DeSantis, Schubert, Scott and Ungar2012b), anisotropy does not here differentiate any of the carnivorans from one another.
As high complexity and textural fill volume are reflective of increased consumption of brittle objects and having larger microwear features, respectively, these data provide clear evidence that DMTA can be used to infer durophagous behavior in extant and extinct feliforms. Further, more nuanced differences in diet (e.g., relatively less scavenging and increased seasonal consumption of fruit in P. brunnea) are captured in dental microwear textures like complexity and textural fill volume (Figs. 3, 4, Table 4), where P. brunnea is intermediately between lions and other hyenas and not significantly different from either.
When C. c. ultima is compared with all extant feliforms examined here, it has significantly greater complexity (p<0.0001) and textural fill volume (p=0.002) than A. jubatus and is statistically indistinguishable from P. leo and all extant hyenas. Further, the rank order (from least to greatest) of Asfc values is: A. jubatus, P. leo, C. c. ultima, P. brunnea, H. hyaena, and C. crocuta (Table 3). These data suggest that C. c. ultima did engage in bone processing similar to all extant hyenas but may have had a diet most similar to P. brunnea (a more omnivorous hyena; Owens and Owens Reference Owens and Owens1978; Mills Reference Mills1989). While C. c. ultima is not significantly different from C. crocuta in any DMTA attributes here discussed, it is also not significantly different from P. leo. This is in contrast to both H. hyaena and C. crocuta, which demonstrate dental microwear textures distinct from both A. jubatus and P. leo in both complexity and textural fill volume (Table 4).
Based on FEA and DMTA, C. c. ultima engaged in durophagous behavior yet may have been fairly generalized in their diet (e.g., eating smaller prey and potentially scavenging and processing vertebrate tissues to a lesser degree as compared with its closest living relative, C. crocuta). The cave hyenas retain the capability to crack bones, yet may have had diets most similar to P. brunnea (which are also not significantly different from P. leo, H. hyaena, and C. crocuta).
Dental Macrowear
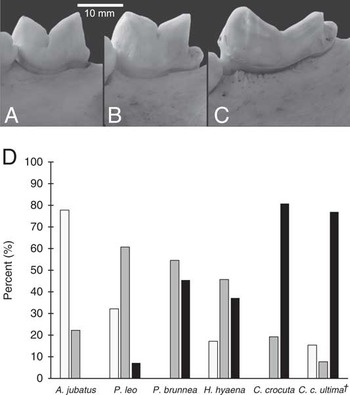
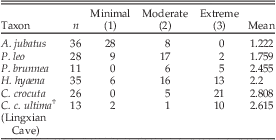
Dental macrowear results are reported in Figures 5 and 6, Tables 4 and 5, and Supplementary Table 4. Dental macrowear as determined by the lead author did not differ from median values from five observers (p=0.181); thus, macrowear assignments made by the lead author are here analyzed and discussed (Table 4), although all data are available (Supplementary Table 4). Feliforms can be distinguished from one another via dental macrowear assignments, and these assignments are largely correlated with known diet (Table 5). Specifically, A. jubatus has the lowest mean dental macrowear score and the highest percent of carnassial teeth categorized as having minimal wear (77.8%; Fig. 5, Table 5, Supplementary Table 4). In contrast, P. leo has significantly higher macrowear scores than A. jubatus but less than all hyenas (Tables 4, 5), with the greatest percentage of moderate classifications (60.7%; Fig. 5). Extant hyenas are here characterized as having a higher percentage of teeth categorized as having extreme wear (>37%), with significantly greater dental macrowear scores than A. jubatus and P. leo (Table 4). Further, C. crocuta has the highest dental macrowear score of all feliforms here examined and is significantly different from H. hyaena (Tables 4, 5). It should also be noted that more than 80% of classified teeth were considered as having extreme macrowear, with none considered as having minimal wear (Fig. 5, Table 5). While the proportion of teeth classified in each macrowear category for A. jubatus, P. leo, H. hyaena, and C. crocuta is different from those made by Van Valkenburgh (Reference Van Valkenburgh1988) on similar taxa, the relative scale of minimal (1), moderate (2), and extreme wear (3) may have been defined differently. Nevertheless, similar large-scale patterns (i.e., the rank order of taxa from least to greatest tooth wear, specifically: A. jubatus, P. leo, H. hyaena, and C. crocuta) are consistent between these studies.
Examples of lower first molars (carnassial teeth) assigned to the three macrowear categories of minimal wear (A, showing left m1 of Acinonyx jubatus, AMNH 88626), moderate wear (B, showing left m1 of Parahyaena brunnea, AMNH 83588), and extreme wear (C, showing left m1 of Crocuta crocuta, AMNH 187771). (D) Histograms noting the frequency of macrowear categories in extant African feliforms and extinct C. c. ultima with macrowear categories of minimal wear (1, white), moderate wear (2, gray), and extreme wear (3, black). † denotes extinct taxon.

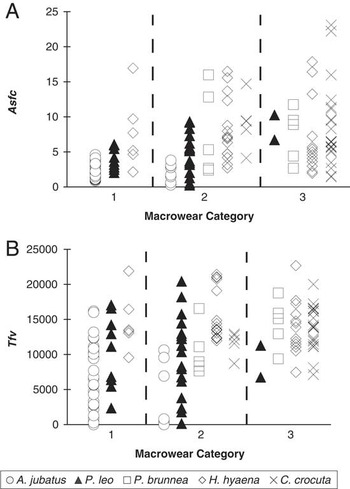
Asfc (A) and Tfv (B, in µm3) values among different macrowear categories for all extant feliforms examined.

Frequency of dental macrowear assignments (see “Materials and Methods”) for each extant and extinct taxon (in ascending order by mean value). All teeth analyzed are lower first molars, per “Materials and Methods.”

† Extinct taxon (all other taxa are extant wild-caught specimens).
Dental macrowear results of extant feliforms suggest that the coarse evaluation of tooth wear may be useful for characterizing diets of extinct taxa. Dental macrowear of C. c. ultima is statistically indistinguishable from all extant hyenas (P. brunnea, H. hyaena, and C. crocuta), in contrast to A. jubatus (p<0.0001) and P. leo (p=0.001). Thus, dental macrowear results are similar to DMTA results in predicting the dietary behavior of extant and extinct feliforms and may provide a cheap and easy supplement to dental microwear analysis, capturing dietary information (as inferred from gross wear) at a different timescale. That being said, sufficient samples sizes of similar tooth positions may be necessary for appropriate dietary classifications. Sample sizes of the extinct C. c. ultima are small (n=11); thus, while macrowear scores do statistically distinguish C. c. ultima from A. jubatus and P. leo, and are indistinguishable from P. brunnea, H. hyaena, and C. crocuta, caution should be exercised in making dietary interpretations. Additionally, taphonomic processes that may contribute to a skewed age distribution (e.g., the disproportionate accumulation of juveniles at a given deposit) may influence dental macrowear analyses.
Despite the potential use of dental macrowear for dietary classifications, there are no significant relationships between dental macrowear and DMTA attributes at the species level. These data demonstrate that individuals with minimal, moderate, or extreme wear do not consistently have greater complexity and textural fill volume with increased wear (Fig. 6). However, significant positive relationships exist between dental macrowear and complexity and textural fill volume (Spearman’s rank-order correlation coefficient of 0.435 and p<0.0001; 0.344 and p<0.0001, respectively) when all taxa were analyzed together. While DMTA attributes cannot be predicted based on coarse dental macrowear classifications, increased complexity, textural fill volume, and dental macrowear are all indicative of increased bone processing in extant feliforms. Yet, DMTA and dental macrowear capture dietary information at different temporal scales. In contrast to DMTA, which records the textural properties of food consumed during the past few days to weeks of an animal’s life, dental macrowear captures a longer-term record of wear and is also influenced by the age of the individual. While dental macrowear is a tool that is broadly accessible to researchers and the public (especially from digitized specimens that are available from online museum databases), the combined use of dental macrowear and microwear is likely to result in a more complete understanding of the dietary behavior of extinct carnivorans. In addition, the testing of cranial biomechanical capability using FEA also represents a measure of cranial function over each individual’s lifetime up to the point of death and fossilization; bone remodeling from changing dietary preferences and different ontogenetic life histories are relatively long-term processes that are closer in scale to macrowear generation than to dental microwear signals captured by DMTA. Thus, a multiproxy approach such as the one demonstrated by this study may be necessary to distinguish the relative importance of factors influencing diet and feeding ability over varying scales of time.
Concluding Remarks
Based on FEA, DMTA, and dental macrowear data, Lingxian Cave spotted hyenas are inferred to have engaged in durophagous behavior. As FEA suggests that skull stiffness in C. c. ultima was significantly lower during carnassial biting than in C. crocuta, and DMTA suggests that C. c. ultima was most similar to P. brunnea, the Lingxian Cave hyenas may have possessed the capability to crack bones yet had more generalized diets most similar to brown hyenas. Thus, genetic isolation of East Asian spotted hyenas from extant spotted hyenas was likely coupled with dietary differences similar to those observed in extant, partially sympatric brown and spotted hyenas (Mills Reference Mills1990). The large numbers of specimens of C. c. ultima found at Pleistocene localities such as Zhoukoudian (Pei Reference Pei1940) and Lingxian Cave suggest that the fossil cave hyenas were probably highly social, similar to its extant African sister populations (Kruuk Reference Kruuk1972; Reference MillsMills Reference Mills1990; Nowak Reference Nowak1999). However, the degree to which C. c. ultima foraged in groups is unknown and may be more similar to the behaviors of P. brunnea, which are known to forage alone but live in small female-bonded social groups (Mills Reference Mills1978, Reference Mills1989; Reference MillsMills Reference Millsand Reference MillsMills Reference Mills and Mills1978; Owens and Owens Reference Owens and Owens1979).
Collectively, the Lingxian Cave Crocuta represents a spotted hyena ecomorph that combines attributes observed in other less closely related extant hyaenid species. It is possible that certain living Crocuta populations may record more intermediate diets as similar to the Lingxian Cave C. c. ultima, but our broad sample of extant C. crocuta individuals shows that both complexity and textural fill volume of the wear surface are distinct from more intermediate feeders like P. leo. The dietary differences here inferred suggest that the dietary niches of the living and extinct hyenas here studied were not conserved over time and space. While it is not possible to conclusively infer whether C. crocuta currently engages in more scavenging behavior than C. c. ultima due to its presence among a higher diversity of social and solitary apex predators in Africa, it is clear that the dietary niches of these hyenas are not static and that mammalian dietary niches may be fairly plastic. While assuming that biotic niches are conserved over time may be necessary for making future predictions regarding species distributions, it is important to recognize that mammalian taxa such as hyenas may be more plastic and adaptable to environmental, climatic, and other biotic changes over time. Further, this multiproxy approach is useful for assessing the paleobiology of a diversity of extinct feliforms and, more broadly, carnivorous mammals.
Acknowledgments
We thank B. Van Valkenburgh and UT–Austin Digimorph for providing the image data for the extant Crocuta model and Vanderbilt graduate student J. Bradham and undergraduate student D. B. Jones for assigning tooth casts to dental macrowear categories. Additionally, we thank all of the curators and collections managers from the American Museum of Natural History, Field Museum of Natural History, Florida Museum of Natural History, National Museum of Natural History, Smithsonian Institution, and Iziko South African Museum who have allowed access to specimens. We are particularly grateful to P. Wang and Y. Hou, from the Institute of Vertebrate Paleontology and Paleoanthropology, for carefully preparing and scanning the fossil skull (LXD0007), respectively. Thanks to C. Badgley, D. Fox, and two anonymous reviewers for feedback on an earlier version of this article. This research was funded in part by the National Natural Science Foundation of China, NSFC40972013 (to J.L.); Vanderbilt University and the National Science Foundation (NSF) EAR1053839 (to L.R.G.D.); NSF DEB1257572 and an American Museum of Natural History Frick Postdoctoral Fellowship (to Z.J.T.); and the Don Sundquist Center of Excellence in Paleontology at East Tennessee State University.
Supplementary Material
Data available from the Dryad Digital Repository: http://dx.doi.org/10.5061/dryad.hn0dt