Introduction
Poverty analysis is currently undergoing a multidimensional turn, increasingly moving beyond an exclusive focus on income-centric or otherwise unidimensional forms of what might be called material poverty to incorporate information from a wider set of dimensions that reflect the many different ways in which human life can be impoverished. The multidimensional perspective, it can be argued, not only provides a more accurate reflection of the experience of poverty itself, but also potentially influences who we identify as being poor, which is a task of considerable public policy importance. This turn towards multidimensionality can be motivated by a range of conceptual frameworks, but one of these – and one that is itself receiving an increasing amount of attention – is the capability approach, developed initially by the economist and philosopher Amartya Sen. The capability approach argues that, in analysing poverty, our focus should be on what people are able to do and be, and not just on what they have (i.e. their resources) or how they feel. Since what people can do and be is inherently multidimensional, the capability approach provides a theoretical justification for adopting a multidimensional conceptualisation of poverty.
However, although multidimensional analysis has, at least from a capability perspective, clear conceptual advantages, further evidence is required to demonstrate that it can also provide substantive empirical insights that are not provided by a more limited, unidimensional focus on material poverty. As Nolan and Whelan (Reference Nolan and Whelan2011, 19, emphasis in original) note, “the need for a multidimensional measurement approach in identifying the poor/excluded is an empirical matter, rather than something one can simply read off from the multidimensional nature of the concepts themselves”.
In this paper, we present an empirical analysis of material poverty and multiple deprivation in Great Britain inspired by the capability approach. In particular, we focus on two measures of material poverty (low income and material deprivation) and seven dimensions of what we call multiple deprivation (ill-health, mental ill-health, housing deprivation, low life satisfaction, lack of autonomy, financial stress and unemployment). These dimensions of multiple deprivation were selected because each represents functionings (beings and doings) that we assume each respondent would avoid if they could – that is, these deprivations are the product of constraints and not choices (see below). In examining the distinctiveness of the multidimensional perspective, we distinguish between identifying vulnerable individuals and identifying vulnerable groups – two distinct but policy-relevant forms of identification.
The capability approach and poverty analysis
The central concepts of the capability approach are functionings and capabilities. A person’s “functionings” refer to the various things a person succeeds in “doing or being”, such as participating in the life of society, being healthy and so forth, whereas “capabilities” refer to a person’s real or substantive freedom to achieve such functionings – for example, the ability to take part in the life of society (Sen Reference Sen1999, 75). Of crucial importance is the emphasis on real or substantive – as opposed to formal – freedom, as capabilities are opportunities that one could exercise if so desired.
Sen argues that, although people’s incomes (or, more broadly, their resource holdings) are important, they are only of instrumental importance because of what they allow a person to do or be. In contrast, what a person can do or be is intrinsically important (e.g. Sen Reference Sen2009) – our ultimate concern when analysing poverty. Such a distinction would not matter much if people’s resources were a good measure of their capabilities; however, Sen argues that this is unlikely to be the case because (i) people have different needs, which means that there will be systematic variations between people’s incomes and their capabilities, and because (ii) low income is just one of the influences on people’s capabilities (Sen Reference Sen1999, 87–88).
The capability approach has by now spawned a substantial body of literature and has both its own academic association (the Human Development and Capability Association) and academic journal (the Journal of Human Development and Capabilities). However, we have previously argued that the approach should not be seen as constituting a distinct field of studies (“capability studies”), but rather that its value lies in providing a lens with which to understand our existing concerns (Hick Reference Hick2012) – in this case, the problem of poverty and deprivation in Great Britain. Conceiving of the capability approach in this way is significant, because it emphasises the importance of engaging with both capability- and non-capability-inspired analyses of poverty and deprivation.
A number of challenges have been identified with drawing on the capability approach to provide a framework for poverty analysis, two of which we discuss here. First, Lister (Reference Lister2004) has argued that the concept of capability deprivation is broader than that of poverty, as it incorporates a focus on both resource- and non-resource-based dimensions and constraints, whereas the concept of poverty is typically understood to be ultimately concerned with a lack of monetary resources. It has been argued elsewhere (Hick Reference Hick2012) that the capability approach is essentially a normative approach – concerned primarily with “what we study” and less concerned with whether this analytical terrain is analysed using one or more concepts. The concept of poverty can, therefore, retain its widely accepted, resource-based focus – what we call here material poverty – if the wider dimensions of concern do not fall from our analytic focus. We employ the concept of multiple deprivation to capture these wider dimensions of deprivation that are often ignored in studies of material poverty.
Second, some have questioned whether the capability approach can be adequately operationalised (e.g. Sugden Reference Sugden1993). A multidimensional framework such as the capability approach undoubtedly proves more challenging to operationalise than, say, an income-centric analytic approach. One aspect of this challenge relates to the difficulty of measuring people’s capabilities, with their distinction between choice and constraint, and, where desired, to the complexity of constructing an aggregate measure of each person’s overall capability. In this paper, we focus on a selection of functionings rather than capabilities (i.e. outcomes rather than real opportunities) and assume that, for the dimensions selected, people would avoid deprivation on these dimensions if they could (i.e. that deprivation on these dimensions reflects constraints and not merely choices). A second aspect of the challenge in applying the capability approach relates to the selection of dimensions and to the fact that the dimensions contained in secondary datasets typically fall short of the ideal list an analyst might wish to work with. However, this is a problem for all multidimensional analyses, capability-inspired or otherwise. Unless more limited approaches, such as those focusing on low income or material deprivation, act as good proxies for multidimensional poverty and deprivation, then some important information may be lost by the omission of wider dimensions.
The analysis presented in this paper is based on two measures of material poverty and seven dimensions of multiple deprivation. In terms of material poverty, we draw on the two most prominent measures of material poverty in European poverty analysis: low income and material deprivation. Of these two measures, the measure of material deprivation is perhaps of particular interest, as it asks not only whether respondents possess a set of items and participate in a set of activities but also – when they do not – whether this is because of a lack of resources or is by choice. There is something of a parallel between this attempt to distinguish between choice and constraint in these “enforced lack” measures of material deprivation and Sen’s distinction between functionings and capabilities (see Hick Reference Hick2012 for a discussion).
The concept of multiple deprivation is intended to focus in a broad way on the lives people are able to live, and not only on those aspects of life that are directly associated with monetary resources. To that end, it is intended to capture deprivation on what are typically considered to be non-material dimensions (although, as we see, many are indeed related to material poverty). The normative status of this conception is derived from our assumption that – despite their various preferences and commitments – people value more rather than fewer of the achievements concerned, and thus that they reflect differences in people’s capabilities rather than just their functionings. However, before presenting the results of the empirical analysis, we discuss some key findings from the existing literature.
Empirical literature on material poverty and multiple deprivation
The growing emphasis on conceptualising poverty in multidimensional terms has led to a corresponding growth in empirical literature seeking to reflect this multidimensionality (Coromaldi and Zoli Reference Coromaldi and Zoli2007; Tomlinson et al. Reference Tomlinson, Walker and Williams2008; Roelen et al. Reference Roelen, Gassmann and Neubourg2012, inter alia). In this section, we identify six key findings from the existing literature on material poverty and multiple deprivation, with a particular focus on British and European studies. The first finding is perhaps the most intuitive: being deprived on one dimension often leads to a greater risk of deprivation on others (e.g. Whelan et al. Reference Whelan, Nolan and Maître2007; Notten and Roelen Reference Notten and Roelen2010, 41; Rippin Reference Rippin2012). However, as we will see, the precise relationship will depend on the dimensions in question.
Second, low income has been found to correlate more strongly with material deprivation than with other dimensions of multiple deprivation. Drawing on 1993 and 1994 ECHP data for twelve European countries, Whelan et al. (Reference Whelan, Layte, Maître and Nolan2001) found that income has the strongest relationship with material deprivation (or what they call “basic” deprivation), followed by “secondary” deprivation (a set of consumer durables such as a car or microwave oven), with a weak, although statistically significant, relationship with housing facilities, housing deterioration and environmental problems. Similarly, Boarini and D’Ercole (Reference Boarini and D’Ercole2006, 28) found a stronger relationship between income and material deprivation than with housing deprivation or social support across the nations of the OECD. Similar findings have also been observed across European nations by Notten and Roelen (Reference Notten and Roelen2010) and Coromaldi and Zoli (Reference Coromaldi and Zoli2007).
Third, a number of studies have found that material deprivation may have a stronger relationship than low income with multiple forms of deprivation. Halleröd and Larsson (Reference Halleröd and Larsson2008, 23) found that respondents who were materially deprived were more likely to experience a range of other “welfare problems” (such as crime, health, unemployment, etc.) than those who experienced income poverty, concluding that “income poverty was one of the most peripheral of all welfare problems”. Nolan and Whelan (Reference Nolan and Whelan2011) observed a closer relationship between material deprivation and subjective financial stress than with low income across 26 European countries. This is of interest because it may not always be possible for an analysis to undertake multidimensional analysis; in such an instance, we might wish to know which of the two measures of material poverty offers the better proxy for multiple deprivation in terms of identifying individuals in poverty.
Fourth, previous research has found that extensive deprivation across many dimensions is relatively rare. Drawing on the 1997 data from the British Household Panel Survey, Burchardt et al. (Reference Burchardt, Le Grand and Piachaud2002) constructed the following four dimensions of deprivation: consumption (low income), production (not in employment, education or training or caring), political engagement and social interaction. They found that over half of the sample was not deprived on any dimension, with 2.3% deprived on three dimensions and just 0.1% on all four dimensions. In an earlier analysis, they had noted that between 1 and 2% of the population were deprived on four or more of five dimensions of deprivation in each year between 1991 and 1995 (Burchardt et al. Reference Burchardt, Le Grand and Piachaud1999, 236). This finding was also observed by Barnes (Reference Barnes2005), using British data, and by Notten and Roelen (Reference Notten and Roelen2010) and Tsakloglou and Papadopoulos (Reference Tsakloglou and Papadopoulos2002) using data from multiple European countries.
However, in analysing material poverty and multiple deprivation, we may wish to assess not only whether the various dimensions identify different individuals as being deprived, but also whether the groups at risk of multiple deprivation are the same as those who display an elevated risk of material poverty. As Whelan and Maître (Reference Whelan and Maître2012) note, one can either focus on the proportion of particular groups who experience poverty or deprivation (which we call an “absolute risk” perspective) or the probability of poverty or deprivation for these groups, once other characteristics have been controlled for using a statistical model (which we call an “underlying risk” perspective). Both perspectives may be of interest in assessing the additional insights – if any – provided by a multidimensional analysis.
Of course, and fifth, the particular risks faced by specific groups may be dependent on the specific dimensions considered. For example, research has shown that older people are shown to display substantially greater rates of material poverty when income measures rather than material deprivation measures are employed (McKay Reference McKay2004; Hick Reference Hick2013). Furthermore, in his study of multidimensional social exclusion in the United Kingdom (UK), Barnes notes that “age was related to an individual’s risk of experiencing disadvantage in different ways: young adults were at risk of economic and neighbourhood forms of disadvantage, while older adults were at risk of health and social related problems” (2005, 173). Drawing on UK data from the EU-SILC data, Notten and Roelen (Reference Notten and Roelen2010, 59–64) found that single parents face an elevated risk of income poverty and financial stress (compared with a two-adult household with children), but not of housing deprivation, neighbourhood problems or lacking access to services, after controlling for other variables. Similarly, they find low work intensity to be related to income poverty, financial stress and housing problems, but not to neighbourhood problems or access to services. This points towards one advantage of examining the risk of deprivation for different groups across various dimensions – namely, to identify the patterns of disadvantage across the dimensions of material poverty and multiple deprivation.
Sixth, and finally, although the pattern of underlying effects may vary from dimension to dimension, there may be a greater similarity between the groups at risk of material poverty and an aggregate measure of multiple deprivation. Notten and Roelen (Reference Notten and Roelen2010, 59–64) found that single parents, households with low work intensity and respondents in rented accommodations face raised rates of both income poverty and multiple deprivation when an aggregate measure of the latter was employed (comprising housing deprivation, neighbourhood problems, financial stress and access to services). This is an important finding, as it questions whether a multidimensional perspective does, in fact, point to distinctive groups as being at risk and whether there are novel findings that emerge from a multidimensional perspective.
Notwithstanding any conceptual merit, in practical terms, the effort involved in terms of data collection and the additional complexity of analysis require that the multidimensional perspective provide some new insight that is not achieved by a more straightforward analysis focusing only on material poverty. Such a contribution may come in a number of forms: in demonstrating that different dimensions of poverty and deprivation identify different individuals or households as being poor; that different groups are shown to be at risk; or that the multidimensional perspective demonstrates distinctive poverty trends over time (Hick forthcoming), for example. Alternatively, it may come from distinguishing between risk factors that are consistent across many dimensions of poverty and deprivation and those that are dimension-specific or limited to a small number of dimensions (Förster Reference Förster2005).
Furthermore, there is a challenge for analysts to demonstrate that multidimensional poverty analysis can provide robust findings given the greater number of decisions on the part of the analyst required by a multidimensional approach. Previous research has suggested that the selection of thresholds within any dimension and the selection of dimensions itself can have a substantial influence on the subsequent results (Notten and Roelen Reference Notten and Roelen2010, 47). Given these concerns, further work in assessing whether multidimensional poverty can provide robust results represents an important priority for poverty research.
Data
The empirical analysis presented in this paper is based on data from the 2006/2007 wave of the British Household Panel Survey (BHPS), a household survey that interviews adult members (aged 16 and over) living in sampled households on an annual basis. The BHPS has been selected as the relevant dataset because of the relative wealth of information it contains on multiple dimensions of deprivation, which are essential for the present analysis, as well as on low income and material deprivation. The findings are based on a completed case analysis of 4,718 respondents between 16 and 59 years of age, clustered within 2,507 households. Robust standard errors are computed to account for this clustering. Analysis is restricted to respondents under the age of 60, as it has previously been shown that indicators of material deprivation perform very differently for older respondents (e.g. McKay Reference McKay2004; Hick Reference Hick2013). This is an important area of study in itself, but we restrict attention to respondents under the age of 60 in an attempt to avoid this differential performance having an undue influence on the analysis undertaken here.
The individual is chosen as the unit of analysis because (i) there is a theoretical preference for a focus on individuals and not households (Atkinson et al. Reference Atkinson, Cantillon, Marlier and Nolan2002), and (ii) six of the seven deprivations analysed in the final section are collected at the individual level and we wish to make full use of this data. As income and material deprivation data were collected at the household level, this means that the ubiquitous, but problematic, assumption of equal income sharing/equal experience of material deprivation within households is made. The data are weighted using the cross-sectional individual weight supplied with the BHPS (with the exception for the analysis presented in Table 3, which is based on unweighted data).
The first of the measures of material poverty is a relative income measure, set at 60% of median income. This remains the most widely employed measure in European poverty analysis; it acts as one of the three measures used to frame poverty targets under the Europe 2020 strategy; and it is enshrined as one of the official child poverty measures under the UK Child Poverty Act 2010. This measure is based on equivalised net current (i.e. weekly) income (whhnetde2) and is a before housing costs (BHC) measure of income. This income variable employs a Modified OECD equivalence scale, which allocates a weight of 1 for the first adult, 0.5 for additional adults and 0.3 for each child, with values expressed in January 2008 prices (Levy and Jenkins Reference Levy and Jenkins2008). A binary measure is constructed based on a 60% median income poverty line (calculated using all cases for whom there were positive individual weights), which equates to equivalised £170.99 per week.
The material deprivation measure is based on a nine-item deprivation index, with the items relating to whether respondents can keep their home adequately warm; pay for a week’s annual holiday away from home; replace worn-out furniture; buy new, rather than second-hand, clothes; eat meat, chicken or fish at least every second day; have friends or family for a drink or meal at least once a month; have two pairs of all-weather shoes for each adult in the household; have enough money to keep their home in a decent state of decoration; and have insurance for household contents. We classify respondents as being materially deprived when they experience an enforced lack of one or more deprivation items (see also Nolan and Whelan Reference Nolan and Whelan1996).
Other applications of the capability approach have adopted a deliberative approach to selecting relevant capabilities (e.g. Burchardt and Vizard Reference Burchardt and Vizard2011; see also Burchi et al. Reference Burchi, De Muro and Kollar2013 for a discussion), or have selected indicators on the basis that they correspond to the capability list outlined by Martha Nussbaum (e.g. Anand et al. Reference Anand, Hunter, Carter, Dowding, Guala and van Hees2009; Rippin Reference Rippin2012). However, in this paper, we select dimensions (i) based on our definition of multiple deprivation as being the enforced experience of low living standards, understood to be a set of non-material capabilities for which we assume that people value more rather than fewer of the achievements concerned, whatever else they value, and (ii) that are contained within the BHPS dataset.
The seven dimensions of multiple deprivation available in the BHPS that we believe correspond to the concept of deprivation we have outlined are as follows: (i) general health, (ii) mental health, (iii) housing deprivation, (iv) autonomy, (v) life satisfaction, (vi) financial stress and (vii) unemployment. Unlike the indicators of material deprivation, in most cases, these indicators do not refer explicitly to constraints, and thus refer to functionings and not capabilities. Nonetheless, in each case, the dimensions represent deprivations that it seems reasonable to believe people would prefer to avoid if they could.
One dimension that we do not include as a dependent variable is education/knowledge; however, it is included as covariate in the models that follow. We do not include education as one of the dimensions of multiple deprivation, first, because, although each of the other dimensions are measured contemporaneously, the variable “education” contained in the BHPS captures past educational attainment and not present knowledge. This is problematic, as its inclusion would require us to define those with relatively low educational attainment as being educationally deprived irrespective of their subsequent economic or labour market position (adopting an “instrumental” perspective regarding the value of education) or actual knowledge or competence (adopting an “instrinsic” position). Second, identifying a single threshold that would capture deprivation in educational attainment for different generations of respondents is likely to be difficult because the need for formal educational qualifications has risen over time. For these reasons, we have chosen to use the education variable as an explanatory, rather than a dependent, variable.
In terms of the dimensions selected, for (i) general health, we focus on the respondent’s overall health status over the preceding 12 months. The response categories for this variable range from 1-“excellent” to 5-“very poor”. We have recoded this as a binary variable so that 4-“poor” and 5-“very poor” represent deprivation in this dimension.
For (ii) mental health, we draw on the 12 items in the General Health Questionnaire module within the BHPS. This survey module asks respondents how they have been feeling about a number of aspects of life, such as decision-making and concentration, whether they have been feeling unhappy or depressed and so forth. The response categories refer to whether a respondent is doing (i) better than usual, (ii) the same, (iii) worse than usual or (iv) much worse than usual. We adopted the GHS scoring approach (0-0-1-1) and set the threshold at 5/6 as representing mental ill-health.
The measure of (iii) housing deprivation draws on 11 indicators relating to whether the respondents accommodation has a shortage of space; noise from neighbours; street noise; not enough light; a lack of adequate heating; condensation; a leaky roof; damp walls, floors or other; rot in the windows or floors; environmental problems; and vandalism or crime in the area. Given that some of the items might not always be particularly severe in isolation (for example, street noise), we put forward that a score of three or more deprivations on this scale might be suggestive of housing deprivation.
For (iv) autonomy, we draw on a sub-scale of items from the CASP-19 survey module. The survey module focuses on the ability to do and plan to do things in life. Three indicators are drawn from this survey module relating to respondents’ (i) ability to plan for the future, (ii) ability to do the things one wants to do and (iii) being pleased with what one does. The response categories to these three questions are as follows: often; sometimes; not often; never. We coded these responses 0-0-1-2. The index is a summation of these values from the three items, and we impose a cut-off at 3 or above as representing a lack of autonomy. Although this three-item measure is considerably narrower than the measure of autonomy employed by Burchardt et al. (Reference Burchardt, Evans and Holder2010) or Ibrahim and Alkire (Reference Ibrahim and Alkire2007), there is some shared focus in terms of the emphasis on the extent of control over one’s life and ability to plan for the future.
For the measure of (v) life satisfaction, we draw on the global question “how satisfied are you with your life overall?”. The response categories ranged from 1-“completely satisfied” to 7-“not satisfied at all”, with 4 representing the mid-point “neither satisfied nor dissatisfied”. We have recoded responses 5–7 to represent deprivation in our primary measure in this domain. The sixth dimension is (vi) financial stress, for which we draw on one question relating to overall financial stress. The response categories for this question range from 1-“living comfortably” to 5-“finding it very difficult” to manage financially. We have recoded this as a binary variable, with 4-“finding it quite difficult” and 5-“finding it very difficult” reflecting financial stress. The final dimension of multiple deprivation is (vii) unemployment, for which we focus on respondents whose current economic activity is listed as “unemployed”.
In most of the analysis presented here, the data are aggregated within but not between dimensions, so that the relationship between material poverty and multiple deprivation can be explored for each of the deprivations concerned. Where multi-item measures are used within dimensions (i.e. for material deprivation, mental health, housing deprivation and autonomy), we choose to employ a counting approach to aggregating indicators, as opposed to using more complex data-driven procedures. This choice is made in recognition of the “tension between the power of sophisticated methods in summarising and analysing the range of indicators available and the transparency required to serve the needs of policymakers and inform public debate” (Nolan and Whelan Reference Nolan and Whelan2009, 25). In Tables 6 and 7, we extend the preceding analysis using aggregate measures of material poverty and multiple deprivation in order to examine whether the findings from disaggregated analysis continue to be observed when these aggregate measures are employed.
Analysis
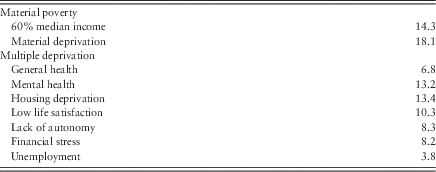
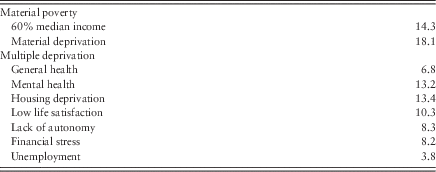
In Table 1, we present the proportion of respondents who were deprived on each of the nine dimensions of material poverty and multiple deprivation. One can see that a smaller proportion of the population is classified as deprived on each of the individual dimensions of multiple deprivation than on the low income or material deprivation measures (the rates of multiple deprivation are significantly lower than material deprivation in all cases and significantly different from income poverty in all cases barring mental health and housing deprivation). Although 14% of the population experiences income poverty and 18% experiences material deprivation, rates of other forms of deprivation range from – at the higher end – 13.4 and 13.2% for housing deprivation and mental health difficulties, respectively, to – at the lower end – 6.8 and 3.8% experiencing ill-health and unemployment.
The experience of material poverty and multiple deprivation (%)
Source: BHPS 2006/7, respondents under 60, weighted data.
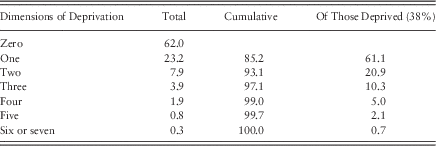
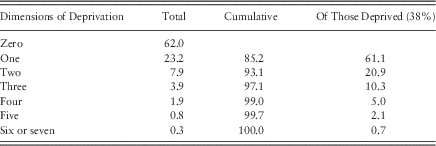
In Table 2, we examine the extent of deprivation across the dimensions of multiple deprivation (i.e. not considering the two dimensions of material poverty). The findings are striking: six in ten respondents (62%) experience no deprivation whatsoever and, of those who do, six in ten (61%) experience deprivation on only one dimension. Extensive deprivation is thus relatively rare, with less than 3% of the population experiencing deprivation on four or more of the seven dimensions considered here.
The extent of multiple deprivation (%)
Source: BHPS 2006/7, respondents under 60, weighted data.
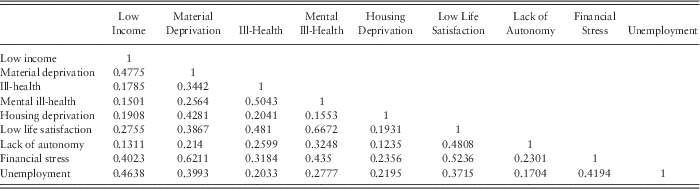
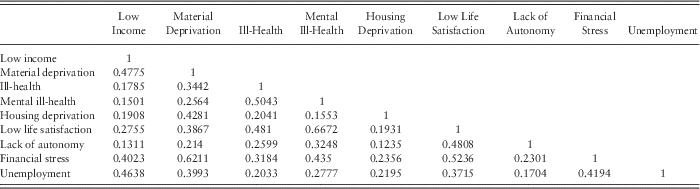
In addition to examining the extent to which individuals experience deprivation across multiple dimensions, we may wish to understand the relationship between the dimensions of deprivation themselves. In Table 3, we present a tetrachoric correlation matrix of the binary measures of income poverty, material deprivation and the seven dimensions of multiple deprivation. From this, we observe that material deprivation correlates more strongly than low income with all other forms of deprivation with the exception of unemployment (see also Halleröd and Larsson Reference Halleröd and Larsson2008; Hick Reference Hick2014). Indeed, the relationships between low income and many forms of deprivation are not particularly strong, with correlations between low income and general health, mental health, housing deprivation and autonomy all below 0.2. Low income correlates most strongly with material deprivation and unemployment, and to a lesser extent with financial stress.
Tetrachoric correlation between low income, material and dimensions of multiple deprivation
Source: BHPS 2006/7, respondents under 60, unweighted data.
Perhaps the most striking finding, however, is that a simple question asking respondents how they are “managing financially these days” (i.e. the measure of financial stress) correlates more strongly than low income with every other measure of multiple deprivation, barring unemployment. Given the efforts expended in compiling income data in surveys such as the BHPS, this is a surprising finding, and is one that is robust to the selection of low income and financial stress thresholds (not shown here).
The pattern of correlations between the deprivations themselves is also of some interest: general health, mental health, life satisfaction, financial stress and autonomy all correlate quite strongly with one another. On the other hand, material deprivation, financial stress and unemployment – and, to a lesser degree, life satisfaction – correlate most strongly with each other, although the values tend to be below 0.5, with the exception of the correlation between material deprivation and financial stress (0.62). Financial stress is the dimension of deprivation that appears to be most closely related to both groups and most closely associated with material deprivation (0.62), but also correlated with life satisfaction (0.52), mental health (0.44) and general health (0.32).
Thus, despite the “mismatch” between low income and material deprivation (e.g. Bradshaw and Finch Reference Bradshaw and Finch2003), these measures display a stronger association with each other than with most of the dimensions of multiple deprivation considered here. The reasons for this may include inter alia the fact that the dimensions of material poverty are collected at the household level, whereas six of the seven indicators are collected at the individual level, and the inclusion of both “objective” and “subjective” indicators of multiple deprivation and idiosyncrasies of particular indicators, such as the mental health indicator, which asks respondents to compare their current state to their usual situation. For some (including one reviewer), the fact that the income measure is relative, whereas the material deprivation and most multiple deprivation measures are “absolute”, may provide another explanation for the relatively weak association between low income and the dimensions of multiple deprivation. We would argue that, in a cross-sectional analysis of poverty in one country, the primary way in which this is likely to influence the analysis is in terms of the proportion of the population that experiences deprivation on each dimension (see Table 1).
Overall, then, the analysis we have presented suggests that extending the analytic focus beyond material dimensions of poverty does lead to the identification of a distinct set of individuals as being in poverty and deprivation.
Between-group differences in risks of material poverty and multiple deprivation
Having established that the measures of multiple deprivation identify substantially different individuals, of further interest is the extent to which they identify different groups as being at risk. The groups included in the analysis presented here are age, housing tenure, household composition, education, sex, sex of the household head, employment composition and region. These groups have been selected to reflect a range of social and economic characteristics typically associated with material poverty.
A focus on groups at risk of poverty and deprivation can adopt either an absolute risk or underlying risk perspective (see also Whelan and Maître Reference Whelan and Maître2012). We use absolute risk to refer to the percentage of a particular group that experiences poverty or deprivation, and we use underlying risk to refer to the probability or odds of deprivation once other characteristics have been accounted for in our logistic regression models.
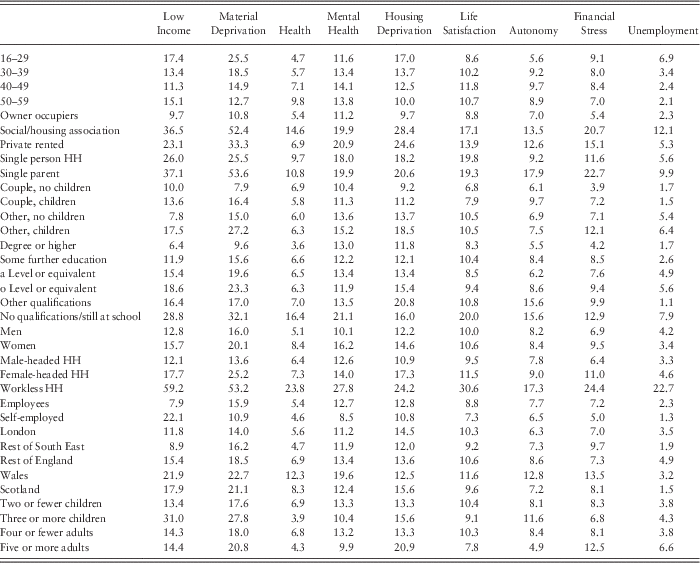
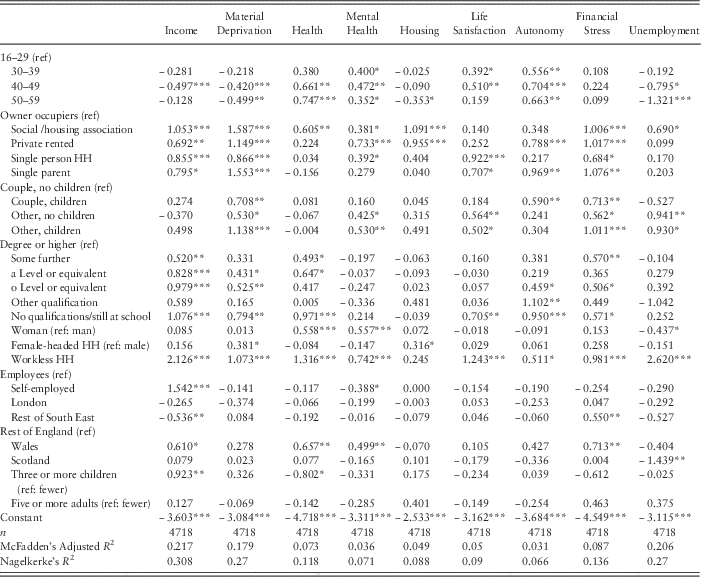
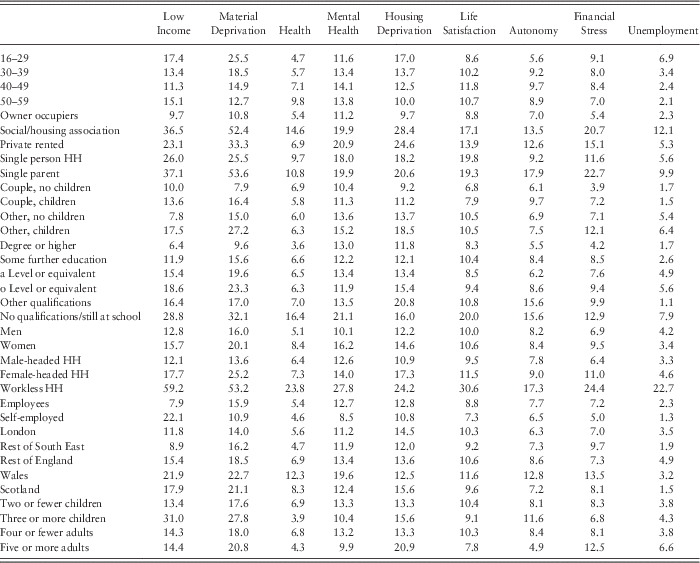
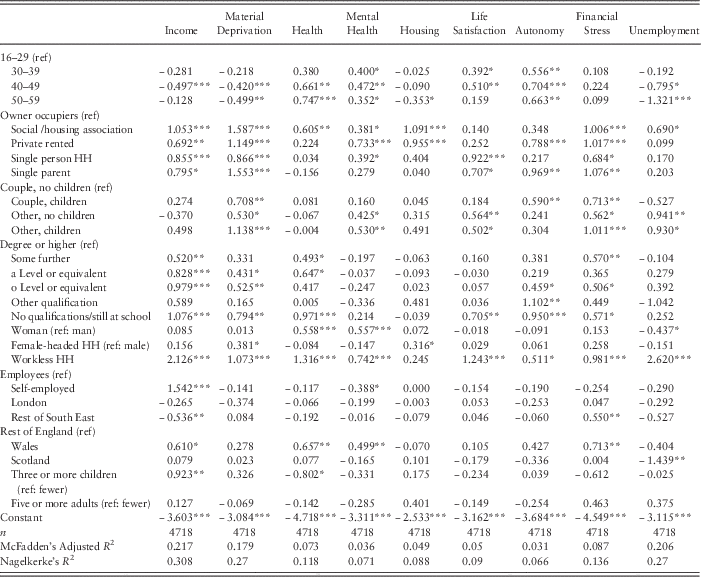
In Table 4, we present the percentage of each group experiencing income poverty, material deprivation and the seven dimensions of multiple deprivation considered here. Perhaps the primary finding is the distinctive age dimension of the experience of material poverty and multiple deprivation. The experience of material deprivation falls throughout the life course; this is also the pattern for rates of housing deprivation, financial stress and unemployment. In contrast, rates of poor health rise consistently among older age groups, as we might expect. These are the dimensions with clear and unidirectional rates of deprivation. On other dimensions, there is not a unidirectional trend among respondents of different ages. There is a spike in rates of low autonomy, low life satisfaction and mental ill-health for respondents between 40 and 49, which coincides with a reduced rate of income poverty for respondents of this age. These trends are generally confirmed by the underlying risk perspective (Table 5), although differences in financial stress are not significant across the life course.
Percentage of selected groups experiencing low income, material deprivation and dimensions of multiple deprivation
Source: BHPS 2006/7, respondents under 60, weighted data.
HH=household.
Logistic regression models estimating group-based differences in log odds of income poverty, material deprivation and multiple deprivation
Source: BHPS 2006/7, respondents under 60, weighted data.
HH=household.
*p<0.05, **p<0.01, ***p<0.001.
In contrast, the risk of material poverty and multiple deprivation for some groups is relatively consistent across dimensions. Comparing respondents with different housing tenures, one observes that, on every dimension except for mental health, a greater proportion of respondents in social housing experience material poverty and multiple deprivation than respondents in either of the other two tenure statuses, while owner occupiers uniformly display the lowest rates (Table 4). After controlling for other variables (Table 5), respondents in social housing display a significantly greater risk of deprivation than owner occupiers on all dimensions other than life satisfaction and autonomy. Tenants in the private rented sector are significantly more likely to experience poverty and deprivation than owner occupiers on most dimensions as well, but differences were not significant in terms of ill-health, low life satisfaction or unemployment.
Similarly, individuals living in workless households experience substantially raised rates of every form of deprivation – indeed more than half experience income poverty and material deprivation – and the rate of material poverty and multiple deprivation across all dimensions is typically at least double that of individuals living in households with at least one employed member. By contrast, individuals living in households with at least one self-employed member are three times more likely to experience income poverty than those in households where all members are employeed, but they are less likely to experience material deprivation as well as all other forms of deprivation. However, these differences are in most cases not significant, once controlling for other variables (the exception is for mental health). The underlying risk perspective (Table 5) also demonstrates that, although living in a workless household is associated with a particularly high risk of income poverty, it is also associated with a raised risk of deprivation on every dimension considered here other than housing deprivation, where the coefficient is positive but not significant.
Across the dimensions of material poverty and multiple deprivation, there is a relatively consistent gender effect, but this is found to manifest in different ways. In the absolute risk perspective, women are more likely to experience every one of the deprivations when compared with men with the exception of unemployment, which we might expect to understate women’s true unemployment rate, as women may be more likely to withdraw from the labour market when unable to find work. However, moving from an absolute to an underlying risk perspective provides additional information about the ways in which men and women experience poverty and deprivation differently. While for health and mental health it is being a woman that raises the risk of deprivation, for material deprivation and housing deprivation, it is living in a female-headed household that significantly increases the risk of deprivation – for both men and women in such households. Comparing the absolute and underlying risk perspectives in this way sheds additional light on the gendered experience of poverty and deprivation.
There are other groups for whom the picture is neither one of uniform consistency or inconsistency across dimensions. In terms of household composition, the data, from an absolute risk perspective (Table 4), show that single parents perform worst on all dimensions other than life satisfaction (where single person households fare worse). Indeed, so great is their vulnerability to material poverty that more than one-third of lone parents experience low income and more than half experience material deprivation. They also experience substantially greater rates of low autonomy, financial stress and unemployment than the next most deprived group.
And yet, turning to an underlying risk perspective, although the coefficients for some of the more “economic” dimensions are significant (income, material deprivation, financial stress) as they are for low life satisfaction and lack of autonomy, single parents are not significantly more likely than couples without children to experience ill-health, poor mental health or housing deprivation. The findings are not dissimilar for those living in single person households. These individuals are significantly more likely than couples without children to be deprived on the dimensions of material poverty, as well as on the dimensions of life satisfaction, mental health and financial stress (Table 5), but display no significant differences from couples without children in terms of experiencing ill-health, unemployment, a lack of autonomy or housing deprivation.
In the absolute risk perspective in Table 4, we see that couples and other families with children face greater rates of the economic deprivations (income poverty, material deprivation and financial stress) and, to a lesser extent, lack of autonomy, than their counterparts without children. Conversely, “other” families (families with three or more adults) – with or without children – display elevated rates of mental ill-health, housing deprivation, low life satisfaction and unemployment compared with couples (again, both with or without children). The underlying risk perspective (Table 5) bears this out, although not all of the between-group differences are statistically significant.
Respondents with lower educational attainment experience greater rates of deprivation for most of the dimensions considered here, but differences in terms of underlying risk (Table 5) are significant only for the economic dimensions (income poverty, material deprivation and financial stress), lack of autonomy and ill-health (as well as for the respondents with no qualifications in terms of low life satisfaction).
In terms of the regions of Great Britain considered, Wales performs worst on each dimension other than housing and unemployment (absolute risk perspective; Table 4). On the two measures of material poverty, London and the Rest of the South East are the two best-performing regions, and they perform well, albeit somewhat less consistently, on the dimensions of multiple deprivation considered here. Moving to an underlying risk perspective, many coefficients are not significant but, compared with respondents living in the Rest of England, Welsh respondents display a significant risk of income poverty, ill-health, poor mental health and financial stress.
The presence of additional children (defined as three or more children in the household) substantially increases the proportion experiencing income poverty and material deprivation, but the rates for other dimensions are either lower (health, mental health, life satisfaction financial stress) or only marginally greater (autonomy, unemployment, housing deprivation) than households with two or fewer children (absolute risk perspective; Table 4). The underlying risk perspective confirms that families with three or more children face a raised risk of income poverty, but do not experience a raised risk for any other dimension and, in fact, report better health. The dummy for households with five or more adults is not significant for any of the dimensions considered here.
The analysis presented in Tables 4 and 5 demonstrates that there is no uniform trend for significant risk factors for different groups to be either (i) consistent across all dimensions of material poverty and multiple deprivation or (ii) to be entirely dimension specific. Rather, the consistency of risk factors across dimensions was observed to vary depending on the group characteristics themselves. Respondents in social and private rented housing and living in workless households display elevated risks across the dimensions of material poverty and multiple deprivation. Meanwhile, for other group characteristics – namely educational differences, being a single parent and, to a lesser extent, families with children – respondents more broadly display underlying risks of income and material deprivation that are only partially observed for the other forms of multiple deprivation considered here. The most noticeable differences of all were observed for respondents of different ages, with the risk of material poverty and multiple deprivation across the life course varying substantially depending on the dimension in question.
Aggregate measures of material poverty and multiple deprivation
Thus far, we have analysed the dimensions of material poverty and multiple deprivation individually. However, as noted at the outset, there may also be a legitimate interest in whether the individuals and groups identified as being at risk of multiple deprivation are distinct from those at risk of material poverty when aggregate measures are employed. In this section, we present analyses using aggregate measures of material poverty and multiple deprivation, with the former defined as the experience of low income or material deprivation, and the latter defined as the experience of two or more of the seven dimensions of multiple deprivation considered in this paper.
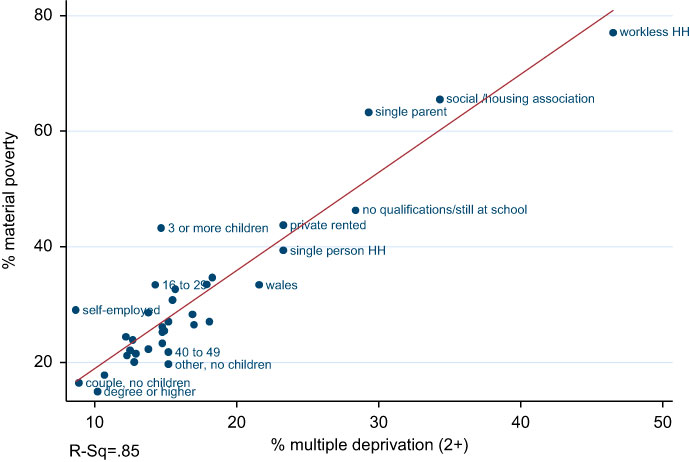
In Figure 1, we present a scatter plot of aggregate material poverty and multiple deprivation rates for the 35 sub-groups considered here. The correlation between these scores is extremely high: 0.92 (R 2 0.85). Groups that experience an elevated risk of material poverty also tend to be at risk of multiple deprivation when these aggregate measures are employed. Indeed, the correlation between these aggregate measures is greater than those between the seven disaggregated dimensions of multiple deprivation and the low income measure of material poverty (which range between 0.69 and 0.85) or most dimensions with the material deprivation measure (which range between 0.71 and 0.94) (not shown here).
Scatter plot of the experience of material poverty and multiple deprivation for 35 population sub-groups.

Thus, although we have seen previously that multiple dimensions identify different individuals as experiencing poverty and deprivation (Table 3), to a substantial extent they identify similar groups as being at risk when aggregate measures are employed. This suggests that the question of whether a multidimensional perspective provides distinctive empirical insights (i.e. the challenge identified by Nolan and Whelan Reference Nolan and Whelan2011, 19) depends in an important way on whether one is seeking to identify vulnerable individuals or vulnerable groups.
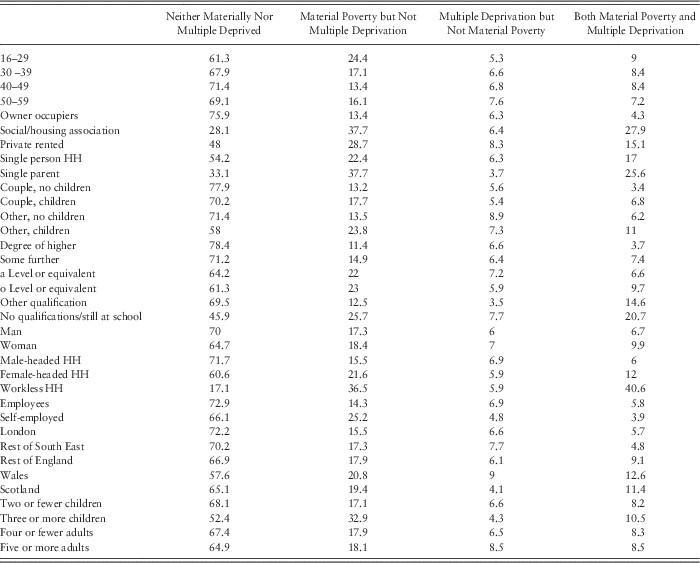
In order to explore the aggregate experience of material poverty and multiple deprivation for different individuals, we constructed a four-way typology, identifying individuals who (i) do not experience material poverty or multiple deprivation, (ii) experience material poverty but not multiple deprivation, (iii) experience multiple deprivation but not material poverty and (iv) experience both material poverty and multiple deprivation, respectively. As Table 6 demonstrates, although 26% of the population experiences material poverty, only one-third of these individuals also experience multiple deprivation (given the sizes of the two groups, the maximum overlap would be 57%); of those who experience multiple deprivation, 56% also experience material poverty.
Four-way material poverty and multiple deprivation classification, respondents under 60 (%)

Source: BHPS 2006/7, respondents under 60, weighted data.
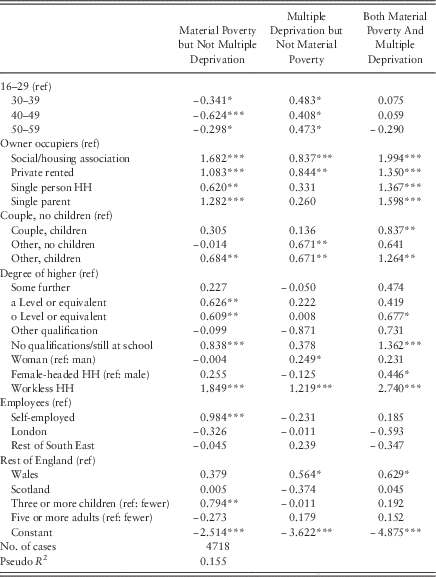
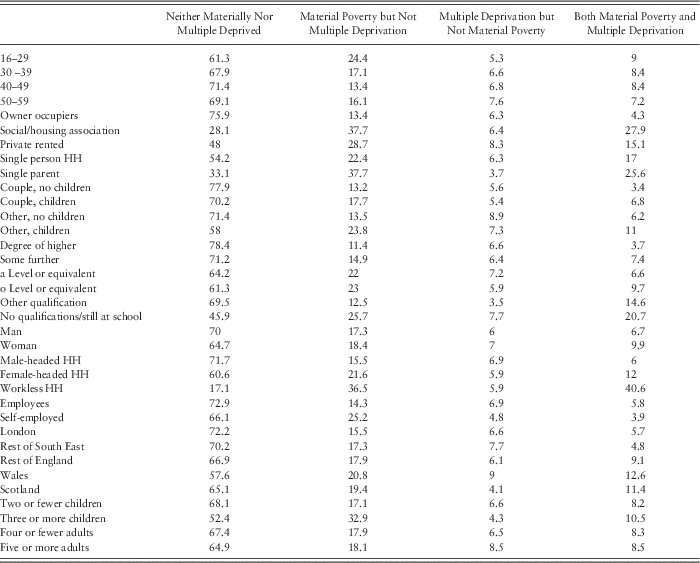
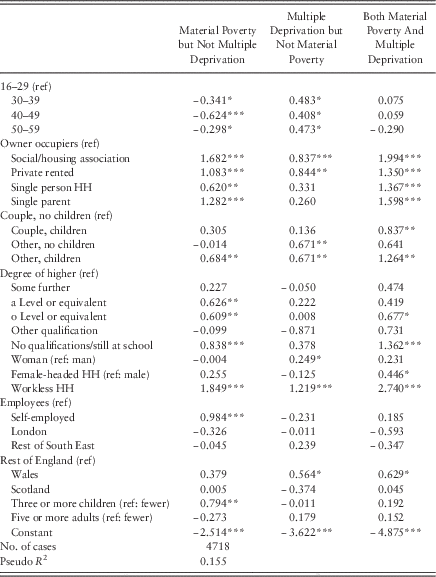
In this final analysis, we present the absolute and underlying risk of experiencing either or both material poverty and multiple deprivation (Tables 7 and 8, respectively). Table 7 presents the distribution of each sub-group according to our four-way material poverty and multiple deprivation classification. Table 8 presents the results of a multinomial logistic regression model that estimates the probability of experiencing material poverty, multiple deprivation or both, where the reference category is “neither material poverty nor multiple deprivation”.
Four-way classification of aggregate material poverty and multiple deprivation, percentage for selected groups
Source: BHPS 2006/7, respondents under 60, weighted data.
HH=household.
Multinomial logistic regression model estimating log odds of experiencing some material poverty or multiple deprivation
Source: BHPS 2006/7, respondents under 60, weighted data.
HH=household.
*p<0.05, **p<0.01, ***p<0.001.
In Table 7, we can see that, of the three categories with some experience of material poverty and multiple deprivation, the category “both material poverty and multiple deprivation” has the largest range in terms of its incidence among the groups considered here (3.4–40.6%). This is followed by the category “material poverty but not multiple deprivation”; the incidence of “multiple deprivation but not material poverty” is the most equally distributed of the four categories among the groups considered here (3.5–9%).
Turning to the underlying risk perspective presented in Table 8, we find that the coefficients for the category “material poverty but not multiple deprivation” to a significant extent mirror those of the individual dimensions of material poverty previously discussed. The probability of falling into this category is significantly associated with living in a workless household, social and private rented housing tenancy, living in a single parent or a single person household and having no qualifications, etc., as we would expect.
The groups with an elevated risk of experiencing “both material poverty and multiple deprivation” are in many cases the same as those at risk of material poverty; however, the coefficients are often greater – that is, the experience of “both material poverty and multiple deprivation” is more concentrated on the groups previously identified to be at risk of material poverty only. The key difference is for age, where there are no significant differences for the age categories considered here, which equalises the divergent relationships between age and material poverty and multiple deprivation, respectively.
The final category is for the group “multiple deprivation but not material poverty”. This is a smaller group than the other two categories considered here (see Table 6) and is more equally distributed between the different groups (Table 7); in Table 8, we show that the coefficients are typically weaker than those for the “material poverty but multiple deprivation category”, after controlling for other variables.
Overall, then, although the groups’ experience of multiple deprivation in aggregate form is predicted to a significant extent by their experience of material poverty, only one-third of those individuals who experience material poverty also experience multiple deprivation. We show that the incidence of “material poverty and multiple deprivation” is more concentrated in groups previously identified as being at risk of material poverty alone, with the experience of “multiple deprivation but not material poverty” both more residual and more equally distributed among the groups considered here. The preceding analysis demonstrates that (i) some of the distinctiveness of the multidimensional perspective is lost when aggregate measures are employed and that (ii) while multiple deprivation identifies different individuals, in many cases these measures identify the same groups as being at risk, at least when aggregate measures are employed.
Sensitivity analysis
Multidimensional poverty analyses rely on numerous decisions on the part of the analyst, including the selection of indicators and dimensions, their thresholds, approach to aggregation and so forth. This can be viewed as problematic if the choices made by the analyst influence the results in an important way. In recognition of this, substantial sensitivity analyses have been undertaken.
For Table 5, these include (a) varying the income or material deprivation thresholds; using annual instead of current income; and using McClements instead of OECD equivalence scale, (b) including possession indicators instead of “enforced lack” deprivation indicators, (c) varying the thresholds on each of the dimensions of multiple deprivation and (d) varying the number of dimensions on which one must be deprived in order to be classified as multiply deprived using the aggregate measure. Sensitivity analyses were also conducted using available, and not completed, cases. Sensitivity analyses have also been conducted that employ more difficult and easier thresholds for the disaggregated dimensions in Table 3 and the aggregated dimensions in Table 6 and Table 8.
We find that the substantive findings presented in this paper are relatively robust and are not overly dependent on the thresholds selected. At times, certain effects move from being significant (or sizeable) to insignificant (or trivial), or, indeed, in the opposite direction. However, in most cases, the primary findings relating to the relationship between dimensions and to groups at the risk of material poverty and multiple deprivation are upheld (the results are not presented here for reasons of brevity, but are available from the author upon request).
Conclusions
Poverty analysis is currently undergoing a multidimensional turn, increasingly focusing on the many ways in which human life can be impoverished rather than on material poverty alone. We have argued that one framework that can be used to support this multidimensional turn is the capability approach, and in this paper we have presented an analysis of material poverty and multiple deprivation in Britain that is inspired by that approach. The multidimensional turn within poverty analysis may be conceptually desirable, at least from a capability perspective, but it raises empirical challenges. In order to decide whether this more complex empirical approach can be justified, it must be demonstrated that the multidimensional perspective can deliver findings distinctive from those that emerge from more limited approaches focusing only on material poverty. This paper has sought to contribute to the growing literature on multidimensionality by exploring the relationship between material poverty and multiple deprivation in Great Britain, and by assessing whether these measures identify a distinct set of individuals and groups as being at risk of poverty and deprivation.
We find, as other authors have found previously (e.g. Burchardt et al. Reference Burchardt, Le Grand and Piachaud2002; Nolan and Whelan Reference Nolan and Whelan2011), that deprivation across many dimensions is relatively rare – just 1% of the population experiences deprivation on five or more of the seven dimensions considered here – and that the correlations between many of the dimensions are relatively low. This demonstrates that the dimensions of deprivation considered here identify different individuals as being in material poverty and multiple deprivation.
It cannot be proven that the findings presented here would be replicated if a wider set of dimensions were selected (Robeyns Reference Robeyns2005, 209). However, it is clear from the preceding analysis that there is little to suggest that low income acts as a valid proxy for multidimensional deprivation in aggregate terms with regards to the individuals who are identified as poor or deprived.
The multidimensional perspective can also shed some light on patterns of deprivation as they are experienced by different groups, and in the preceding analysis we have focused both on absolute and underlying risks of poverty and deprivation following Whelan and Maître (Reference Whelan and Maître2012). In our analysis of disaggregated dimensions, we find that some groups – living in a workless household; social housing and private rented sector tenants – experienced consistently raised risks across most dimensions of material poverty and multiple deprivation (irrespective of whether our focus was on absolute or underlying risk). Meanwhile, other groups displayed underlying risks for the dimension of material poverty that were only partially observed for the dimensions of multiple deprivation. And for respondents of different ages, the experience of poverty and deprivation varied substantially depending on the dimension of interest. Extending our focus from that of material poverty alone to also consider multiple deprivation provided distinctive results, irrespective of whether our focus was on vulnerable individuals or vulnerable groups, at least in the disaggregated analysis.
The findings also demonstrate the value of adopting absolute and underlying risk perspectives in exploring the gendered experience of poverty and deprivation. Women, and respondents in female-headed households, experience increased rates of all forms of deprivation, with the exception of unemployment (which as we note is likely to underestimate women’s “true” unemployment rate). However, an underlying risk perspective, adjusting for other characteristics, shows that for some dimensions (health and mental health and also the aggregate measure of multiple deprivation), the risk exists for women, whereas for material deprivation, housing deprivation and financial stress, the risk exists for living in a female-headed household, irrespective of whether the respondent is a man or a woman.
Nevertheless, when we turn to an aggregate measure of material poverty and multiple deprivation, the insights provided by a multidimensional perspective are more contingent on whether we are interested in identifying vulnerable individuals or vulnerable groups. In the former, the multidimensional perspective continues to identify distinctive individuals – just over one-half of those experiencing multiple deprivation also experienced material poverty. However, if our interests were in identifying vulnerable groups, then the distinctiveness of the multidimensional perspective is no longer clear – the correlation between the aggregate material poverty and multiple deprivation scores for the 35 sub-groups considered here is 0.92.
Constructing a four-way material poverty and multiple deprivation profile for each group, we found that the experience of “both material poverty and multiple deprivation” is more concentrated in groups previously identified as being at risk of material poverty alone, whereas the “multiple deprivation but not material poverty” category is smaller and more equally distributed between the groups considered here.
In evaluating the distinctiveness of the multidimensional perspective in empirical terms, our findings depend significantly on whether we are interested in identifying vulnerable individuals or vulnerable groups and whether we employ aggregate or disaggregated measures of material poverty and multiple deprivation. The measures of material poverty and multiple deprivation analysed here identify substantially different individuals as being poor and deprived, irrespective of whether disaggregated or aggregate measures are employed. There is greater consistency between these measures when our interest is in the groups identified as poor or deprived, although they remain distinctive when disaggregated measures of material poverty and multiple deprivation measures are employed. When analysing the aggregate experience of material poverty and multiple deprivation for the 35 sub-groups considered here, we found that there is remarkable consistency – a correlation of 0.92 between their material poverty and multiple deprivation scores.
The analysis presented in this paper shows that there are novel insights to be gained from the multidimensional perspective that cannot be obtained by relying on measures of material poverty alone. Adopting a multidimensional perspective does influence who we identify as being poor. However, the distinctiveness of the multidimensional perspective in empirical terms is not an all-or-nothing affair: it depends significantly on whether we analyse aggregate or disaggregate measures and on whether our interest lies in identifying a vulnerable individual or vulnerable groups – two distinct, but important, tasks for public policy.
Acknowledgement
The author thanks Tania Burchardt, David Piachaud, Tony Atkinson and Björn Halleröd, two anonymous reviewers and the Editor for their comments and suggestions. Any remaining errors are my own. This work was supported by the Economic and Social Research Council [grant number ES/G01808X/1].