




No CrossRef data available.
Article contents
From boys to men: Predicting adult adaptation from middle childhood sociometric status
Published online by Cambridge University Press: 01 June 2004
Abstract
This report examines the predictive validity of sociometric status at age 9–10 to young adult (age 23–24) antisocial behavior, work and school engagement, and arrests using Oregon Youth Study males (N = 206). A variety of analytic strategies included (a) multivariate analyses to examine the variation in adult adaptation as a function of sociometric classification at age 9–10, (b) regression analyses to evaluate the relative contribution of “liked most” and “liked least” peer nominations, and (c) structural equation modeling to predict the young adult outcome constructs from social preference at age 9–10. Contrary to expectation, when controlling for early antisocial behavior and academic skills, boys' social preference scores still predicted young adult outcomes. Longitudinal findings are discussed with respect to the salience of male peer rejection in middle childhood and the social developmental processes that may account for the predictive validity of peer rejection.This project was supported by a grant (MH 37940) from the National Institute of Mental Health (NIH) to Deborah Capaldi, PhD, Oregon Social Learning Center, and by grants (DA 05304 and DA 16110) from the National Institute on Drug Abuse (NIH) to the second author (T.J.D.). Thanks to Ann Simas for editing and graphics preparation on this manuscript.
Information
- Type
- Research Article
- Information
- Copyright
- © 2004 Cambridge University Press
One of the most compelling questions in social developmental research is what role peers play in social and emotional adaptation (Hartup, 1983; Piaget, 1954; Sullivan, 1953). The question can be divided into two, more specific inquiries. To what extent does acceptance by peers influence social development? To what extent do relationships with peers (i.e., friendships) shape individual social development trajectories?
Considerable research on the second question clearly suggests that relationships with peers, especially in adolescence, can influence the development of substance use, delinquency, and violence (Brendgen, Vitaro, & Bukowski, 2000; Dishion, Capaldi, Spracklen, & Li, 1995; Dishion, Eddy, Haas, Li, & Spracklen, 1997; Dishion, Spracklen, Andrews, & Patterson, 1996; Elliott, Huizinga, & Ageton, 1985; Giordano, Cernkovich, & Pugh, 1986; Kandel, 1978; Rowe & Osgood, 1984; Vitaro, Tremblay, Kerr, Pagani, & Bukowski, 1997). These initial findings are clearest for identifying the impact of the dark side of friendships on social development (Hartup, 1996). It appears that the manner in which friendships come together, and the common activities on which they are based, can reinforce and amplify deviant developmental trajectories.
Considering the first question, it remains unclear whether or not peer acceptance or rejection uniquely impacts children's social developmental trajectories. Early longitudinal work suggests that the lack of acceptance by peers predicted juvenile delinquency and other social developmental difficulties (Cowen, Pederson, Babigian, Izzo, & Trost, 1973; Roff & Sells, 1970). However, Hartup's (1983) extensive review of that early work showed that lack of peer acceptance could be interpreted just as easily as an epiphenomenon of children's early social adjustment problems and therefore might not be uniquely predictive of long-term outcomes.
About the same time, investigators began to study and articulate the processes of peer rejection (Coie, Dodge, & Coppotelli, 1982). Perhaps being rejected by peers was a punitive and structuring, early social experience that did undermine normal social development for these children. Rejection involved active dislike by peers, primarily within the school setting. The burgeoning interest and research in peer rejection revealed that aggression was a salient predictor of rejection (Coie & Kupersmidt, 1983; Dodge, 1983). Aggressive children often were rejected actively within an hour of contact in unfamiliar, contrived playgroups.
The salience of aggression in eliciting peer rejection stimulated rethinking of Hartup's (1983) original point that children's problem behavior actually may be what predicts long-term outcome adjustment and not the peer rejection, per se. Eron's (1987) work on the stability of aggression across the life span (from peer nominations of aggression at age 8 to criminal referrals at age 30) certainly demonstrated a strong relationship between early conduct problems and later life experience (see also Huesmann, Eron, Lefkowitz, & Walder, 1984). Although the evidence was clear that peer rejection was related to later social adjustment problems (Coie & Cillessen, 1993; Li, 1985), the data were not convincing that peer rejection had a unique effect. Parker and Asher (1987) examined this question carefully by conducting a meta-analysis of the prediction studies using sociometric status, aggression, and other indices of adjustment to predict adolescent adjustment. The general conclusion was that the most compelling evidence was for stability of problem behavior from childhood through adolescence and that peer rejection had a somewhat limited unique effect. Studies that have found an effect linked peer rejection to behavior problems in young adolescents (Kupersmidt & Coie, 1990).
One approach to studying the unique role of peer relations in socioemotional adjustment is to broadly define childhood traits that are prognostic of peer rejection, then to control for these traits when determining predictive validity. The most compelling evidence to date is the systematic set of studies reported recently by Dodge et al. (2003). In a set of four studies, these investigators found evidence for the unique role of peer rejection in the etiology of aggressive behavior. Peer rejection predicted aggression when controlling for relevant response patterns of the child, such as information processing (e.g., hostile attribution bias). Moreover, accumulative peer rejection (rejection by peers for more than 1 year) was more important than episodic dislike by peers. These tightly controlled analyses accounted for the role of peer rejection in middle childhood. Studies of the predictive validity of childhood sociometrics have yet to control for academic and antisocial behavior and tracked their subjects into adulthood. The current study does both.
In our own work with the Oregon Youth Study (OYS) boys, we assumed that peer relations were, in part, an outcome of the boys' difficult behavior and poor academic achievement. We argued that peer relation's effect on social development is achieved by structuring peer networks through early adolescence so that antisocial boys increasingly form into deviant peer groups.
A series of analyses on this sample, and the work of other investigators, provides some reason to be doubtful that peer relations uniquely will predict later outcomes for males. When using structural equation modeling (SEM) with multiagent, multimethod data, we found that antisocial behavior and academic skills combined to account for substantial variation in peer relations, as defined by sociometric ratings measured jointly by “liked least” and “liked most” nominations (Dishion, 1990). We later examined whether peer relations at age 9–10 predicted deviant peer involvement 2 years later at age 11–12. We found that peer relations, antisocial behavior, and academic skills combined to account for early involvement with deviant peers (Dishion, Patterson, Stoolmiller, & Skinner, 1991).
As we followed the youth into adolescence, however, the peer relations construct was not uniquely predictive of deviant peer involvement or substance use. By age 15, antisocial behavior at age 9–10 became the best predictor of deviant peer involvement, which in turn accounted for over 50% of the variation in early-onset substance use (Dishion, Capaldi, et al., 1995). The finding that sociometric status did not predict adolescent involvement with deviant peers or problem behavior was consistent with longitudinal findings from Fergusson, Woodward, and Horwood (1999) and the theoretical view proposed by Cairns, Cairns, Neckerman, Gest, and Gariépy (1988).
However, adolescence is a notoriously poor time to attempt to distinguish boys on a lifetime course of delinquency from more well-adapted boys. As Moffitt (1993) has clearly shown, problem behavior peaks at adolescence, both for boys who will have problems later in life and those who will adapt well throughout their lives. It may be that early peer relations have accounted for little unique variance in problem behavior because most longitudinal studies end at adolescence. In a study that extends into adulthood, early sociometric status may be a stronger predictor of adult adjustment than adolescent problems.
Current Study
In this study, we developed three constructs describing adult adjustment: antisocial behavior, adult arrests, and work–school engagement. We used the peer nominations of sociometric status in middle school (social preference and social impact) to predict these three adult outcomes, controlling for antisocial behavior and academic skills measured comprehensively in middle childhood and adolescence. Specifically, we hypothesized the following:
- Poor peer relations in middle childhood will predict both maladaptation and adaptation in adulthood, with peer Rejected Boys showing the poorest adaptation and highest levels of problem behavior.
- After controlling for academic competence and antisocial behavior in middle childhood and adolescence, poor peer relations will no longer predict adult adjustment, because of the continuity in the boys' antisocial behavior and academic competence from childhood through adulthood.
Method
Participants
This study used data from the OYS sample of boys, who were between the ages of 9 and 10 at the time data collection began (the 1983–1984 school year) and attended schools in a high-crime area of a medium-sized city in the Pacific Northwest. From all the fourth-grade classes invited to participate, 206 boys were recruited to the study (74.4% of invitees). Capaldi and Patterson (1987) found that the boys who were recruited did not differ significantly from those who did not participate on any of the clinical scales of the teacher version of the Child Behavior Checklist (CBCL; Edelbrock & Achenbach, 1984). Overall, the recruited families were of slightly lower socioeconomic status than average (according to national norms) and predominantly white. More than 20% of parents were unemployed and more than 20% were on some form of welfare or financial assistance in the first year of the study. Initially, 42% of the families had two biological parents, 32% were single-parent families, and 26% were stepparent families (Patterson, Reid, & Dishion, 1992). Data used in this article were collected between 1983 and 1998, when the boys were between ages of 9 and 24.
Data collection procedures
Boys were assessed yearly from age 9 to adulthood using parent and son interviews, questionnaires (completed by the child, parent, peers, and teachers), in-home assessments, school data, and court records. Both parents and teachers completed the CBCL each year. The child and parent interviews, which took place at the research center each year, gathered information about parenting, child behavior, and peer behavior.
Procedures for collecting peer nominations of most-liked and least-liked classmates were followed in the present study. All boys providing consent were involved in the peer nominations procedure. Boys were asked to nominate three other males in their classroom whom they liked “most as friends.” They were also asked to nominate the three boys whom they liked “least as friends.” Only boys in the classroom who provided consent to participate in OYS were used in the sociometric assessment (74% of all classroom boys).
For this study, we focused on peer sociometric assessment at initial recruitment (age 9–10); interviews, court records, and questionnaires during middle childhood (age 9–10) and adolescence (age 15–16); and young adult interviews, questionnaires, and court records collected at age 23–24. Table 1 contains a list of measures used at key waves and their reliabilities.
Constructs, measurement, and reliabilities (α)

Predictors: Indicators and constructs
Measures from the parent and youth interview and child, teacher, and parent questionnaires were used to operationalize our constructs using a multimethod approach. Indicators were first selected to represent constructs based on face validity, then retained or excluded based on reliability analyses and principal components analysis. Indicators (and the items that comprised them) were retained as measures of a construct if they demonstrated a Cronbach α above .60 and loaded at least .30 on a single-factor solution of a principal components analysis for at least two of the three waves (see Capaldi & Patterson, 1987, for a more detailed account of these procedures). Some exceptions were made in order to preserve the multiagent, multimethod nature of the constructs. Table 1 lists the constructs, data collection methods, and reliabilities. Each construct is described below.
Peer relations
Childhood measures of peer relationships included peer nominations of liked and disliked classmates obtained at Grade 4 (age 9–10). As in most measures of sociometric status, groupings were formed on two orthoganal dimensions of the sociometric nominations, namely, social preference and social impact (Coie et al., 1982; Peery, 1979). For descriptive purposes, and in accordance with the scoring and cut points delineated by Peery1
The social preference score is a subtraction of how many classmates nominate the child as disliked from how many nominate him as liked. As a result, the social preference score is a measure of positive and negative relationships. The social impact score, a measure of overall influence, is the sum of nominations received by the child, both positive and negative. The two scores are, by definition, orthogonal to each other.
Antisocial behavior
Antisocial behavior was measured similarly at Grade 4 (age 9–10) and Grade 10 (age 15–16). In all cases, parent, interviewer, and child reports were used to create a multiagent, multimethod construct.
At Grade 4, a set of 29 items from the child interview, 26 items from the parent version of the CBCL (P-CBCL; Achenbach & Edelbrock, 1981), and three items from the interviewer impressions were used to measure antisocial behavior. The child interview scale yielded an α of .91, the parent scale yielded an α of .90–.91 (mother–father correlation: r = .60), and the interviewer impressions yielded an α of .65. At Grade 10, the same parent and interviewer impression items were used, as well as the Elliott Child Behavior Checklist (Elliott et al., 1985), a measure of delinquency comprising the sum of 45 self-report items. Grade 10 αs ranged from .73 for the interviewer impressions to .92 to .93 for the parent scale (mother and father answers correlated .67). Reliability was not calculated for the Elliott self-reported delinquency measure because of the low base rate of many of these behaviors. The score reflects the simple sum of reported behaviors, shown to be valid in previous research (Elliott et al., 1985).
The three scales correlated only moderately at Grade 4, yielding a standardized α of .50. Because of the importance of using multiple respondents and methods to build constructs, all three scales were retained. At Grade 10, the three scales yielded a standardized α of .73.
The parent scales displayed a strong correlation between Grades 4 and 10, correlating at .62. The cross-grade correlation of .23 for the interviewer impression scales was more moderate. The 4th-grade child interview and 10th-grade Elliott items, which were not identical, still displayed a correlation of .23. Overall, the antisocial construct at Grade 4 correlated .41 with the Grade 10 construct (see Table 1 for a description of measures and their reliabilities at each wave).
Arrests
Arrests were measured using court-report data from juvenile and adult court. At Grade 4 (age 9–10), arrest data represented the number of times the child had been arrested, and at Grade 10 (age 15–16), the number of times the child had been arrested since age 12 (Grade 7). The arrest score specifically measured the number of referrals each boy received from juvenile court during the time in question. The measures of arrests at Grade 4 and Grade 10 only correlated .11, because of the low base rate of arrests at Grade 4. However, 60% of the boys who had no arrests by Grade 4 also had no arrests between Grades 7 and 10. Conversely, 85% of the boys who had been arrested by Grade 4 also were arrested between Grades 7 and 10.
Academics
Academics were measured at Grade 4 (age 9–10) using teacher report and at Grade 10 (age 15–16) using teacher report and grade point average (GPA). (GPA was not available for Grade 4.) Teacher report, which comprises four items about academic performance, yielded an α of .93 at Grade 4 and .95 at Grade 10. Fourth-grade teacher report correlated .33 with 10th-grade teacher report. At Grade 10, teacher report and GPA correlated .47. Overall, the academic constructs for the two grades correlated .40.
Young adult outcomes
Young adult (age 23–24) outcome measures included school and work engagement, antisocial behavior, and criminal record. Because this study investigated both positive and negative early peer experiences, we wanted to measure both adaptive and antisocial outcomes.
Antisocial behavior
Antisocial behavior in young adulthood was measured in an identical fashion to antisocial behavior at Grade 10 (age 15–16). As before, child, parent, and interviewer reports were used to create this multiagent, multimethod construct. Again, the Elliott Child Behavior Checklist, 24 items from the P–CBCL, and three items from the interviewer impressions were used.
The parent scale yielded an α of .91 (only one parent reported per child) and the interviewer impressions yielded an α of .70. The three scales correlated only moderately, yielding a standardized α of .46. Because of the importance of using multiple respondents and methods to build constructs, all three scales were retained. In order to address the low internal consistency, child and parent reports of antisocial behavior are reported separately for some analyses.
Work–school engagement
Work–school engagement was measured in young adulthood using three variables: two self-reports and one coder impression. The young men were asked how many of the past 12 months they had spent working, in school, both working and in school, or neither working nor in school. From these four questions, a single variable was created measuring how many months out of the last 12 the young men had spent either in school or working. During the interview, the young men also were asked several questions about their educational status. These questions were combined to form a school completion variable ranging from “no high school completion” to “college or graduate school graduate.” Coders of the peer task also were asked questions about how engaged each boy appeared to be in either work or school. These items were averaged for the target boy, yielding an α of .92. Again, all three measures, although they displayed only moderate correlations, were retained to preserve the multiagent, multimethod approach, but child and parent reports are reported separately for some analyses in order to address the low internal consistency.
Arrests
Once more, arrests in young adulthood were measured objectively using court records. Arrests between age 18 and 24 were combined to create the arrest score. The young men's scores represented the number of referrals they received from juvenile or adult court during that time; 32% of the sample had been arrested between age 18 and 24.
Analyses
We tested our hypothesis using three steps. First, we investigated the effect of sociometric groupings on antisocial behavior, arrests, and work–school engagement. We tested group differences in these behaviors using MANOVAs. Next, we tested the effect of sociometric status (measured continuously through social preference and social impact) on specific young-adult outcomes, controlling for those same outcomes in childhood and adolescence. Finally, we used a SEM approach to test the predictive validity of childhood social preference on antisocial and work–school young adult outcomes.
Modeling
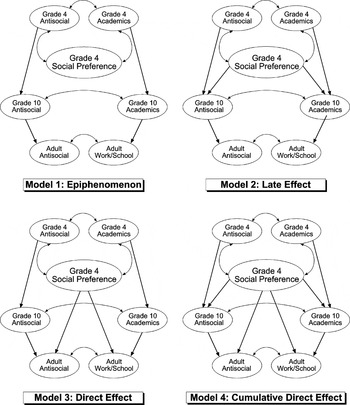
Four different SEMs were compared to test the predictive validity of social preference on young adult antisocial behavior and work–school engagement. In each model, paths were specified from childhood to adolescent to adult antisocial behavior and academics and these constructs were allowed to covary at each assessment. The first model (the indirect-effect model) included no direct paths from social preference to Grade 10 or adult antisocial behavior and work–school engagement. The second model (the late-effect model) included paths from social preference to Grade 10 behaviors, and the third model (the direct-effect model) included paths from social preference to adult outcomes. The fourth model (the cumulative-effect model) included paths from social preference to both Grade 10 and adult behaviors. The relation of social preference to arrests was not tested in these models because the distribution of arrest data was too skewed for this type of model.
Missing data
Retention across the course of the OYS was exceptionally high: 204 of the original 206 boys provided data for the age 23–24 assessment. For this reason, missing data required attention only in the SEMs run across outcomes and assessments. For these models, missing data were imputed using the statistical program, MPlus (Muthén & Muthén, 2001).
Results
Outcomes
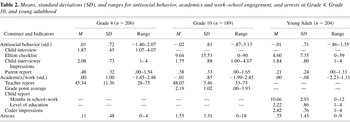
Antisocial behavior and work–school engagement were distributed fairly normally at all time points. Table 2 includes means and standard deviations for the variables comprising these standardized constructs at the three assessment points. The arrest data, as can be seen in Table 2, were not distributed normally and were dichotomized for logistic regression analyses and not used in the modeling analyses.
Means, standard deviations (SD), and ranges for antisocial behavior, academics and work–school engagement, and arrests at Grade 4, Grade 10, and young adulthood

Sociometric groups
MANOVA
The relation between childhood sociometric status and young adult antisocial behavior, work–school engagement, and arrests was first tested using a MANOVA. Because it is well known that antisocial behavior, academics, and arrests are not independent constructs (in this study, young adult antisocial behavior and work–school engagement were correlated .42, young adult antisocial behavior and arrests were correlated .37, and young adult work–school engagement and arrests were correlated −.30), this analysis was used to test which combination of these variablesbest distinguished between groups. Pillai's criterion was used to test for significance.
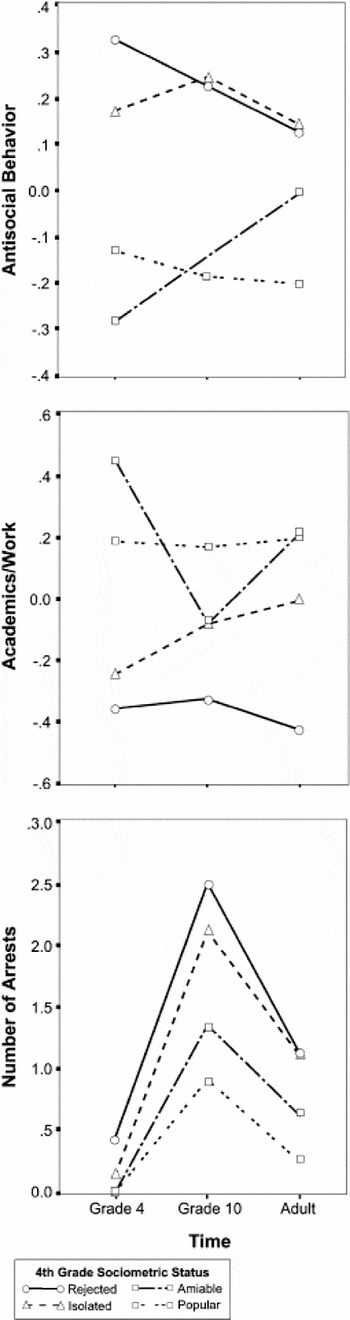
Childhood (age 9–10) sociometric group had a significant effect on the bundle of dependent variables measured in young adulthood (age 23–24). Specifically, Rejected Boys differed significantly from all others, V = .11, F (3, 198) = 8.12, p < .001, and that difference was due mostly to work–school engagement, which loaded most highly on the discriminant function (standardized discriminant function coefficient a = .95). Arrests also loaded moderately (a = −.28), but adult antisocial behavior did little to distinguish Rejected Boys from the others (a = .15). Rejected Boys had lower work–school engagement and a higher rate of arrest than the other boys.
Boys in the Isolated group differed significantly from Amiable and Popular Boys, V = .06, F (3, 198) = 4.02, p < .01. All three variables contributed to this difference and all loaded highly on the discriminant function: work–school engagement (a = .45), arrests (a = −.57), and antisocial behavior (a = −.33). Isolated Boys had higher antisocial behavior, lower work–school engagement, and a higher rate of arrest than Popular and Amiable Boys (their antisocial behavior and arrests were as high as that of Rejected Boys at this wave). Popular and Amiable Boys did not differ significantly from each other on any combination of the dependent variables at young adulthood.2
For comparison, these same analyses were run using the Coie sociometric groups (rejected, neglected, controversial, average, and popular). As with the Peery analyses, Rejected Boys differed from all other groups, with arrests and work–school engagement driving the effect. The other four groups were less distinct, but average and Popular Boys were less antisocial and had fewer arrests than the other groups, supporting the Peery results.
Multivariate analysis of covariance
When adolescent (age 15–16) antisocial behavior and academics were entered into this analysis as covariates, they were related significantly to the outcomes, V = .28, approximate F (9, 540) = 6.15, p < .001, but Rejected Boys continued to differ significantly from the others, controlling for the covariates, V = .07, F (3, 178) = 4.30, p < .01. This effect was due almost entirely to Rejected Boys' lower work–school engagement.
Social preference and social impact
The results above seem to indicate that, although Rejected and Isolated Boys differ significantly from Amiable and Popular Boys in young adult outcome, there is little difference between Isolated and Rejected Boys and little difference between Amiable and Popular Boys. Graphs of group effects over time reveal the same pattern (see Figure 1). Because these findings imply that social preference has greater predictive power than social impact, correlations between continuous measures of social preference and social impact and young adult outcome were investigated to address this implication.

Antisocial behavior, academics/work, and arrests as a function of Grade 4 sociometric status.
Correlations
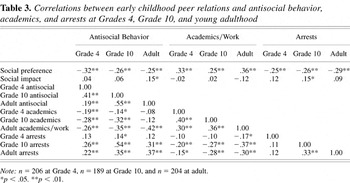
Correlations between these variables and the outcomes at each time point revealed that at Grade 4, Grade 10, and young adulthood, social preference correlated significantly with all three outcomes. At all time points, social preference was correlated positively with work/school engagement or academics and negatively correlated with arrests and antisocial behavior. Social impact correlated only weakly with arrests (see Table 3) at Grade 10 (age 15–16) and with antisocial behavior in young adulthood (age 23–24).
Correlations between early childhood peer relations and antisocial behavior, academics, and arrests at Grades 4, Grade 10, and young adulthood

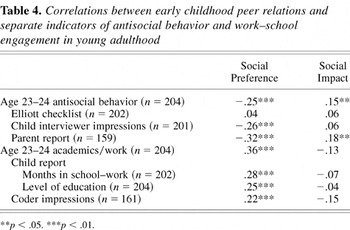
Because the antisocial and work-school engagement constructs possessed only moderate reliabilities in young adulthood, correlations between social preference, social impact, and the separate indicators of the two outcome constructs also were run. These correlations are displayed in Table 4. All indicators showed the same pattern of correlations as their constructs, except for self-reported antisocial behavior, which did not correlate with either fourth-grade social preference or fourth-grade social impact. Because none of the correlations ran counter to those between outcome constructs and peer nominations, the full constructs were used for the remaining analyses.
Correlations between early childhood peer relations and separate indicators of antisocial behavior and work–school engagement in young adulthood

Regression analyses
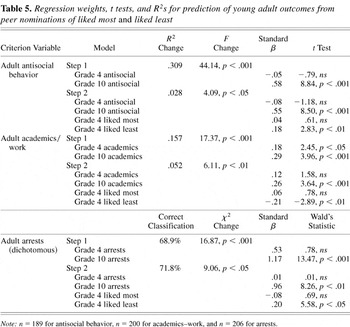
Hierarchical regressions were used to test the effect of the individual components of social preference on young-adult outcomes, controlling for the effect of the Grade 4 and Grade 10 levels of those same behaviors. For each construct (antisocial behavior, work–school involvement, and arrests), the young-adult outcome was used as the criterion variable, the Grade 4 and Grade 10 levels of that construct were entered into the model in the first step, and liked-most and liked-least nominations (as measured at Grade 4) were entered into the model at the second step.3
Additional interaction terms also were tested in the regression models: Grade 4 social preference by Grade 4 behavior (antisocial behavior, academics, or arrests, depending on model) and Grade 4 social impact by Grade 4 behavior. Social preference did not interact significantly with fourth-grade academics, arrests, or antisocial behavior. Social impact had marginally significant interactions with academics and arrests. Interpretation of the impact by academic interaction revealed that for boys who were low on Grade 4 academics, social impact contributed to their young adult work–school involvement; boys who had high social impact at Grade 4 were less involved in work or school in young adulthood than those who had low impact. No such effect was found for boys who had high academic scores at Grade 4. The arrest interaction involved the opposite pattern: Boys who were arrested by Wave 1 had a higher arrest rate in young adulthood if they were low impact at Wave 1. The young adult arrest rates of boys who were not arrested at Grade 4 were unaffected by social impact. Because the interaction effects were only marginal and social impact was not included in the final modeling, these interactions were left out of the final regressions.
Regression weights, t tests, and R2s for prediction of young adult outcomes from peer nominations of liked most and liked least

Predicting young adult antisocial behavior from Grade 4 and Grade 10 antisocial behavior accounted for 31% of the variance in antisocial outcome. When Grade 4 liked-most and liked-least nominations were added to the model, R2 increased to .34; liked-least nominations accounted for this change, with boys who were nominated as liked least being more likely to report antisocial behavior in adulthood.
Prediction to work–school engagement in young adulthood was less powerful. A model with Grade 4 and Grade 10 academics as predictors and young-adult work–school engagement as a criterion accounted for 16% of the variance in the outcome. When Grade 4 liked-most and liked-least nominations were added to the model, R2 increased to .21; liked-least nominations accounted for this change. Boys nominated as liked least were less likely to be engaged productively in school and work, even controlling for competencies as measured in childhood and adolescence.
Finally, arrests as an adult were predicted from earlier arrests and sociometric status. A logistic regression model with Grade 4 and Grade 10 arrests (dichotomized as 0 or 1) as predictors, and young adult arrests (also dichotomized) as the criterion, increased prediction significantly above chance, correctly classifying 68.9% of cases. When Grade 4 liked-most and liked-least nominations were added to the model, the accuracy of classification increased to 71.8%; liked-least nominations accounted for this change, positively predicting young adult arrests above and beyond Grade 4 and Grade 10 arrests.
Model testing
We used a model-testing approach to systematically test competing models relating early sociometric status to young-adult adjustment. SEM was used to test the hypothesis that peer relations at Grade 4 (age 9–10) had a direct effect on young adult outcome (age 23–24), not mediated by its correlations with childhood antisocial behavior and academics. Liked-most and liked-least nominations were used as indicators of the construct reflecting boys' social preference at age 9–10.
Confirmatory factor analyses (CFAs)
Before testing the full models, CFAs were conducted at each wave to ensure the validity of the measurement model for antisocial and work–school engagement constructs. At each time point, the CFAs produced nonsignificant model-fit χ2s and no minimum modification indices, indicating that our constructs were valid as specified. At Grades 7 and 10, antisocial behavior and academics were allowed to covary and did so negatively. To reduce problems of model estimation, the estimated covariance was constrained to −.65 in the young adult CFA, a correlation similar to those observed at Grades 7 and 10. If left unconstrained, the covariation between the engagement and antisocial constructs at this age was −.90.
Nested models
The effect of childhood peer relations on adjustment in young adulthood was tested by comparing four models with and without direct paths from Grade 4 social preference to Grade 10 and young adult outcomes (antisocial behavior and academics or work–school engagement). Social preference was measured using liked-most and liked-least nominations as separate indicators. Because disliked nominations were at least twice as predictive as liked nominations in all three regressions, they were fixed at twice the loading of like nominations in the SEMs.
Model 1 (the epiphenomenal model) included no direct paths from Grade 4 social preference to Grade 10 and young adult outcomes. Model 2 (the late-effect model) included direct paths from social preference to Grade 10 academics and antisocial behavior. Model 3 (the direct-effect model) included direct paths from social preference to young adult work–school engagement and antisocial behavior, but not Grade 10 academics or antisocial behavior. Model 4 (the cumulative-effect model) included direct paths from social preference to young adult work–school engagement and antisocial behavior, in addition to Grade 10 academics and antisocial behavior. All models included paths from Grade 4 antisocial behavior to Grade 10 antisocial behavior, Grade 10 antisocial behavior to young adult antisocial behavior, Grade 4 academics to Grade 10 academics, and Grade 10 academics to young adult work–school engagement. Social preference was allowed to correlate with Grade 4 antisocial behavior and academics in all models4
In order to increase the fit of these models, a few residuals were allowed to covary from age to age. Parent reports of antisocial behavior in childhood, adolescence, and young adulthood were allowed to covary with each other; the Elliot Behavior Checklist was allowed to covary from Grade 10 to young adulthood; and the Grade 10 measure of coder impressions of antisocial behavior was allowed to covary with the Elliot checklist at that grade. These specifications increased the fit of the model but did not change any of the patterns found within the model.

Structural equation models testing effect of social preference on academics and antisocial behavior.
Epiphenomenon model
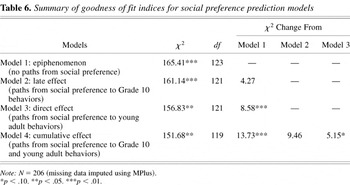
The first model, with no direct paths from social preference to adolescent or young adult outcome, had a model-fit χ2 (123) of 165.41 (p = .01).5
It is important to note that, although this is not a great fit, we are interested in the relative fit of the four models, not their absolute fit. The poor fit of these models is mainly due to the number of parameters and variables involved. The only additional regression paths specified by the modification indices were the direct paths from social preference to wave 15 (age 23–24) outcomes included in the third and fourth model. Fully saturated models with all paths specified (e.g., Grade 10 antisocial behavior on Grade 4 academics) also were tested but did not improve the fit greatly. For parsimony, these additional paths were not included in the final models.
Late-effect model
The second model, with direct paths specified from Grade 4 social preference to Grade 10 antisocial behavior and academics, had a model-fit χ2 (121) of 161.14 (p = .01). More relevantly, the χ2 (2) change between the second and first models was 4.27 (p = .12), indicating that the model with direct paths from social preference to Grade 10 adjustment did not fit significantly better than the model without those paths. All the paths specified in the first model (except that from Grade 4 to Grade 10 academics, which was significant only marginally) also were significant in the second model. Neither the path from social preference to Grade 10 antisocial behavior nor the path from social preference to Grade 10 academics was significant.
Direct-effect model
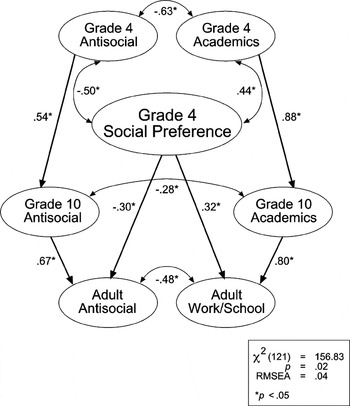
The third model, with direct paths specified from Grade 4 social preference to young adult antisocial behavior and work–school engagement, had a model-fit χ2 (121) of 156.83 (p = .02). In this case, the χ2 (2) change between the third and first model was 8.58 (p = .01), indicating that the model with direct paths from social preference to young adult outcomes fit significantly better than the model without those paths. All the paths specified in the first model also were significant in the third model. The path from social preference to young adult antisocial behavior was significant and the path from social preference to young adult work–school engagement also was significant.
Cumulative-effect model
The fourth model, with direct paths specified from Grade 4 social preference to Grade 10 antisocial behavior and academics and young adult antisocial behavior and work–school engagement, had a model-fit χ2 (119) of 151.68 (p = .02). In this case, the χ2 (4) change between the fourth and first models was 13.73 (p = .001), indicating that the model with direct paths from social preference to Grade 10 and young adulthood fit significantly better than the model without those paths. The χ2 (2) changes between the fourth model and the third model was 5.15 (p = .08), indicating that the cumulative-effect model was only marginally better than the direct-effect model. Again, all the paths specified in the first model (except that from Grade 4 to Grade 10 academics, which was only marginally significant) also were significant in the fourth model. The paths from social preference to Grade 10 antisocial behavior and academics were not significant, but the paths from social preference to young adult antisocial behavior and work–school engagement both were significant.
A comparison of all four models is detailed in Table 6. Based on these comparisons and the lack of correlation between social preference and 10th-grade behavior, Model 3 (the direct effect) seems the most parsimonious perspective (see Figure 3), namely, that boys' poor relationships with peers at age 9 (Grade 4) are uniquely predictive of young adult maladaptation.
Summary of goodness of fit indices for social preference prediction models


Model 3: direct-effect model-testing of the direct effect of social preference on young adult academics and antisocial behavior.
Discussion
Using three different quantitative strategies, the findings from this study consistently suggest an association between sociometric nominations obtained from peers in fourth grade and multiagent positive and negative adult outcomes. MANOVAs revealed that Rejected and Isolated Boys differed from Amiable and Popular Boys in antisocial behavior and work–school engagement at age 23–24, even when these behaviors at earlier time points are taken into account. Consistent with hypotheses introduced by Coie and colleagues (Coie et al., 1982; Dodge, 1983), hierarchical regressions found that peer nominations of being liked least were the most prognostic of young adult maladaptation. It is interesting to note, for example, that even the Isolated group of boys, who had few nominations, were more likely to have difficulties in young adulthood than Amiable and Popular Boys. The negative nature of the few nominations these Isolated Boys received suggests the salience of their marginal status within the public school context.
SEM comparisons demonstrated a direct effect of fourth-grade social preference on later life adjustment. Surprisingly, the effects of peer dislike were not mediated by earlier constructs of academic skills and antisocial behavior. Our conservative stance when undertaking these analyses was that problematic peer relations may have short-term effects in providing the conditions for deviant peer involvement (see Dishion, Patterson, & Griesler, 1994, for a discussion of the confluence model). We did not expect that these early peer experiences would have a long-term effect when controlling for adolescent problem behavior and academic skills, given the high levels of covariation between adolescent problem behavior and deviant peer involvement (Dishion, French, & Patterson, 1995).
Developmental issues
Our expectation that peer relations would not uniquely predict adult adjustment beyond direct measures of behavior was based on a preponderance of prediction data that stop at adolescence. If we had tracked our model only through 10th grade, we would have found the same lack of unique relationship: social preference was not predictive of adjustment in 10th grade. One possibility is that during middle adolescence, a large increase in problem behavior occurs, and youth who start acting out early and those who begin acting out in adolescence are difficult to differentiate statistically. Multicollinearity between constructs such as deviant peer involvement, antisocial behavior, and parent monitoring during this time period has been noted at or above the .75 level. Less evidence exists that academic problems increase in the same manner, but it is plausible that adolescents who have been good students may run into academic trouble at this age as they try to balance friends and other commitments and experiment with problem behavior. However, as time marches on, those who persist in problem behavior and continue to struggle academically may be different with respect to their social and emotional trajectories. The nature of the exhibited problem behavior may be a promising avenue of exploration in order to distinguish these trajectories. For example, research shows that co-offending with a violent peer during adolescence is more predictive of later delinquency than solo offenses (Conway & McCord, 2002). Early peer rejection may influence the type of adolescent problem behavior exhibited, with early peer rejection being a factor in the development of deviant friends and a focus of deviance (Dishion, Nelson, Winter, & Bullock, in press).
The fact that peer rejection predicts adult adaptation and maladaptation 15 years later, but it did not predict in adolescence, suggests the power of the longitudinal design and the deficiency in our current notions of developmental trajectories. Future work, both methodological and theoretical, needs to address the process and timing issues of relating early experiences to later adjustment, as well as the possibility that sleeper effects of earlier experiences are yet to be explained.
Interventions
Although more research is needed to expand these findings, the isolation of peer experiences in elementary school as a unique element in social development is helpful for model building. The hypothesis that peer acceptance or rejection in school contributes uniquely to children's long-term social development is at least plausible. We speculate that early negative peer experiences may be a seminal factor in the formation of deviant peer groups that amplify the characteristics that led to the original rejection. This suggests that prevention programs in elementary school should engineer environments that reduce peer rejection. The short-term outcome of such interventions would most likely be less antisocial behavior in the school and increased affiliations with and acceptance by prosocial peers. The long-term outcomes might reduce persistent problem behavior over the life course. Several prevention programs in progress have accepted this approach and presumed these outcomes (Fast Track Research Group, 2002; Stoolmiller, Eddy, & Reid, 2000).
From a predictions standpoint, it is important to reflect on the fact that an assessment that takes 10–20 min in classroom time can be so powerful in predicting long-term outcomes. Peer nominations often have been deemed the gold standard for personality assessment; however, 15-year predictions have been rare. We think that the predictive validity is a joint function of the reliability and validity of the measurement technique, as well as the power of the peer group in structuring later developmental opportunities or lack thereof.
Limitations and future directions
There are two major limitations to the present study. The first is that the sample consists primarily of European American males. These findings cannot easily be extrapolated to the experiences of children in other communities or other cultures. In fact, Kupersmidt and Patterson (1991) showed that peer relations are differentially predictive of negative outcomes for girls and boys.
The second limitation is that we have assessed only peer acceptance at one point in time. Repeated experiences with failing in the peer group would be expected to have an even more profound impact on social development. Kupersmidt, DeRosier, and Patterson (1995) found a link between chronicity of peer rejection over a 3-year time span and externalizing problems in the 4th year; however, there are methodological barriers to repeated assessments using sociometric ratings. The first is that such repeated assessments typically take place in 1 school year. Following children over time is challenging because of the tendency of children to spread across schools and classrooms. It becomes unmanageable to collect standard, reliable peer social preferences on individual children. This barrier turns out to be a limiting factor in building theory about the long-term impact of peer rejection and social development.
We hope that future research increases the measurement focus on children's experiences of peer rejection and stigmatization within the school setting. Improved measures that are linked to the peer nomination procedure will stimulate important research on the unique contribution of the peer environment to social and emotional development in children.
References
REFERENCES
Achenbach, T. M., &
Edelbrock, C. S.
(1981).
Behavioral problems and competencies reported by parents of normal and
disturbed children aged four through sixteen.
Monographs of the Society for Research in Child Development,
46,
82.CrossRefGoogle Scholar
Brendgen, M.,
Vitaro, F., &
Bukowski, W. M.
(2000).
Deviant friends and early adolescents' emotional and
behavioral adjustment.
Journal of Research on Adolescence
10,
173–189.CrossRefGoogle Scholar
Cairns, R. B.,
Cairns, B. D.,
Neckerman, H. J.,
Gest, S. D., &
Gariépy, J. L.
(1988).
Social networks and aggressive behavior: Peer support or peer
rejection.
Developmental Psychology
24,
815–823.CrossRefGoogle Scholar
Capaldi, D., &
Patterson, G. R.
(1987).
An approach to the problem of recruitment and retention rates for
longitudinal research.
Behavioral Assessment
9,
169–177.Google Scholar
Coie, J. D., &
Cillessen, A. H.
(1993).
Peer rejection: Origins and effects on children's development.
Current Directions in Psychological Science
2,
89–92.CrossRefGoogle Scholar
Coie, J. D., &
Dodge, K. A.
(1988).
Multiple sources of data on social behavior and social status in
the school: A cross-age comparison.
Child Development
59,
815–829.CrossRefGoogle Scholar
Coie, J. D.,
Dodge, K. A., &
Coppotelli, H.
(1982).
Dimensions and types of social status: A cross-age perspective.
Developmental Psychology
18,
557–570.CrossRefGoogle Scholar
Coie, J. D., &
Kupersmidt, J. B.
(1983).
A behavioral analysis of emerging social status in boys'
groups.
Child Development
54,
1400–1416.CrossRefGoogle Scholar
Conway, K. P., &
McCord, J.
(2002).
A longitudinal examination of the relation between co-offending
with violent accomplices and violent crime.
Aggressive Behavior
28,
97–108.CrossRefGoogle Scholar
Cowen, E. L.,
Pederson, A.,
Babigian, H.,
Izzo, L. D., &
Trost, M. A.
(1973).
Long-term follow-up of early detected vulnerable children.
Journal of Consulting and Clinical Psychology
41,
438–446.CrossRefGoogle Scholar
Dishion, T. J.
(1990).
The family ecology of boys' peer relations in middle
childhood.
Child Development
61,
874–892.CrossRefGoogle Scholar
Dishion, T. J.,
Capaldi, D. M.,
Spracklen, K. M., &
Li, F.
(1995).
Peer ecology of male adolescent drug use.
Development and Psychopathology
7,
803–824.CrossRefGoogle Scholar
Dishion, T. J.,
Eddy, J. M.,
Haas, E.,
Li, F., &
Spracklen, K.
(1997).
Friendships and violent behavior during adolescence.
Social Development
6,
207–223.Google Scholar
Dishion, T. J.,
French, D. C., &
Patterson, G. R.
(1995).
The development and ecology of antisocial behavior. In
D. Cicchetti &
D. J. Cohen (Eds.),
Developmental psychopathology: Vol. 2. Risk, disorder, and
adaptation (pp.
421–471).
New York:
Wiley.
Dishion, T. J.,
Nelson, S. E.,
Winter, C. E., &
Bullock, B. M.
(in press).
Friendship interactions in the development and course of antisocial
behavior: Entropy as a dynamic index of self-organized deviance.
Journal of Abnormal Psychology.
Dishion, T. J.,
Patterson, G. R., &
Griesler, P. C.
(1994).
Peer adaptations in the development of antisocial behavior: A
confluence model. In
L. R. Huesmann (Ed.),
Aggressive behavior: Current perspectives (pp.
61–95).
New York:
Plenum Press.
Dishion, T. J.,
Patterson, G. R.,
Stoolmiller, M., &
Skinner, M. S.
(1991).
Family, school, and behavioral antecedents to early adolescent
involvement with antisocial peers.
Developmental Psychology
27,
172–180.CrossRefGoogle Scholar
Dishion, T. J.,
Spracklen, K. M.,
Andrews, D. W., &
Patterson, G. R.
(1996).
Deviancy training in male adolescents friendships.
Behavior Therapy
27,
373–390.CrossRefGoogle Scholar
Dodge, K. A.
(1983).
Behavioral antecedents of peer social status.
Child Development
54,
1386–1399.CrossRefGoogle Scholar
Dodge, K. A.,
Lansford, J. E.,
Burks, V. S.,
Bates, J. E.,
Pettit, G. S.,
Fontaine, R., &
Price, J. M.
(2003).
Peer rejection and social-information processing factors in the
development of aggressive behavior problems in children.
Child Development,
374–393.CrossRefGoogle Scholar
Edelbrock, C. S., &
Achenbach, T. M.
(1984).
The teacher version of the Child Behavior Profile: I. Boys aged
6–11.
Journal of Consulting and Clinical Psychology
52,
207–217.CrossRefGoogle Scholar
Elliott, D. S.,
Huizinga, D., &
Ageton, S. S.
(1985).
Explaining delinquency and drug use.
Beverly Hills, CA:
Sage.
Eron, L. D.
(1987).
The development of aggressive behavior from the perspective of a
developing behaviorism.
American Psychologist
42,
435–442.CrossRefGoogle Scholar
Fast Track Research Group
(2002).
Evaluation of the first 3 years of the Fast Track prevention trial
with children at high risk for adolescent conduct problems.
Journal of Abnormal Child Psychology
30,
19–35.Google Scholar
Fergusson, D. M.,
Woodward, L. J., &
Horwood, L. J.
(1999).
Childhood peer relationship problems and young people's
involvement with deviant peers in adolescence.
Journal of Abnormal Child Psychology
27,
357–369.CrossRefGoogle Scholar
Giordano, P. C.,
Cernkovich, S. A., &
Pugh, M. D.
(1986).
Friendships and delinquency.
American Journal of Sociology
91,
1170–1202.CrossRefGoogle Scholar
Hartup, W. W.
(1983).
Peer relations. In
P. H. Mussen
(Series Ed.),
E. M. Hetherington
(Vol. Ed.),
Handbook of child psychology: Vol. 4. Socialization, personality
and social development (pp.
103–196).
New York:
Wiley.
Hartup, W. W.
(1996).
The company they keep: Friendships and their developmental
significance.
Child Development
67,
1–13.CrossRefGoogle Scholar
Huesmann, L. R.,
Eron, L. D.,
Lefkowitz, M. M., &
Walder, L. O.
(1984).
Stability of aggression over time and generations.
Developmental Psychology
20,
1120–1134.CrossRefGoogle Scholar
Kandel, D. B.
(1978).
Similarity in real-life adolescent friendship pairs.
Journal of Personality and Social Psychology
36,
306–312.CrossRefGoogle Scholar
Kupersmidt, J. B., &
Coie, J. D.
(1990).
Preadolescent peer status, aggression, and school adjustment as
predictors of externalizing problems in adolescence.
Child Development
61,
1350–1362.CrossRefGoogle Scholar
Kupersmidt, J. B.,
DeRosier, M. E., &
Patterson, C. P.
(1995).
Similarity as the basis for children's friendships: The roles
of sociometric status, aggressive and withdrawn behavior, academic
achievement and demographic characteristics.
Journal of Social and Personal Relationships
12,
439–452.CrossRefGoogle Scholar
Kupersmidt, J. B., &
Patterson, G. R.
(1991).
Childhood peer rejection, aggression, withdrawal, and perceived
competence as predictors of self-reported behavior problems in
preadolescence.
Journal of Abnormal Child Psychology
19,
427–449.CrossRefGoogle Scholar
Li, A. K.
(1985).
Early rejected status and later social adjustment: A 3-year
follow-up.
Journal of Abnormal Child Psychology
13,
567–577.CrossRefGoogle Scholar
Moffitt, T. E.
(1993).
Adolescence-limited and lifecourse-persistent anti-social behavior:
A developmental taxonomy.
Psychological Review
100,
674–701.Google Scholar
Muthén, B. O., &
Muthén, L.
(2001).
MPlus Users' Guide (Version 2.02) [Computer
software].
Los Angeles:
Muthén & Muthén.
Parker, J. G., &
Asher, S. R.
(1987).
Peer relations and later personal adjustment: Are low-accepted
children at risk?
Psychological Bulletin
102,
357–389.Google Scholar
Patterson, G. R.,
Reid, J. B., &
Dishion, T. J.
(1992).
A social learning approach: IV. Antisocial boys.
Eugene, OR:
Castalia.
Peery, C. J.
(1979).
Popular, amiable, isolated, rejected: A reconceptualization of
sociometric status in preschool children.
Child Development
50,
1231–1234.CrossRefGoogle Scholar
Roff, M., &
Sells, S. B.
(1970).
Juvenile delinquency in relation to peer acceptance–rejection
and socio-economic status.
Psychology in the Schools
5,
3–18.Google Scholar
Rowe, D. C., &
Osgood, D. W.
(1984).
Heredity and sociology theories of delinquency: A reconsideration.
American Sociological Review
49,
526–540.CrossRefGoogle Scholar
Stoolmiller, M.,
Eddy, J. M., &
Reid, J. B.
(2000).
Detecting and describing preventive intervention effects in a
universal school-based randomized trial targeting delinquent and
violent behavior.
Journal of Consulting and Clinical Psychology
68,
296–306.CrossRefGoogle Scholar
Sullivan, H. S.
(1953).
The interpersonal theory of psychiatry.
New York:
Norton.
Vitaro, F.,
Tremblay, R. E.,
Kerr, M.,
Pagani, L., &
Bukowski, W. M.
(1997).
Disruptiveness, friends' characteristics, and delinquency in
early adolescence: A test of two competing models of development.
Child Development
68,
676–689.CrossRefGoogle Scholar

Constructs, measurement, and reliabilities (α)
Means, standard deviations (SD), and ranges for antisocial behavior, academics and work–school engagement, and arrests at Grade 4, Grade 10, and young adulthood
Antisocial behavior, academics/work, and arrests as a function of Grade 4 sociometric status.
Correlations between early childhood peer relations and antisocial behavior, academics, and arrests at Grades 4, Grade 10, and young adulthood
Correlations between early childhood peer relations and separate indicators of antisocial behavior and work–school engagement in young adulthood
Regression weights, t tests, and R2s for prediction of young adult outcomes from peer nominations of liked most and liked least
Structural equation models testing effect of social preference on academics and antisocial behavior.
Summary of goodness of fit indices for social preference prediction models
Model 3: direct-effect model-testing of the direct effect of social preference on young adult academics and antisocial behavior.
 You have
Access
- 45
- Cited by