Somatic cell count (SCC) measures the content of different types of cells in milk, mainly represented by lymphocytes, macrophages, polymorphonuclear leukocytes (PMNL) and by epithelial cells. An increase in SCC is the consequence of an inflammatory process due to the presence of an intramammary infection or of non-pathological conditions due to physiological factors. In sheep milk SCC has non pathological peaks during the colostral period and at the end of lactation, and undergoes changes due to animal age, milk yield, flock management, season and stress (Raynal-Ljutovac et al. Reference Raynal-Ljutovac, Pirisi, de Crémpux and Gonzalo2007). Indigenous proteolytic enzymes in milk (i.e. plasmin-plasminogen system, elastase, and cathepsins) originate from blood plasma and leukocytes; their activities are related to physiological aspects or external influences and affect milk cheesemaking ability (Albenzio et al. Reference Albenzio, Santillo, Caroprese, d'Angelo, Marino and Sevi2009; Moatsou, Reference Moatsou2010). Several authors have described the effects of SCC on cheesemaking ability of ewe milk (Sevi et al. Reference Sevi, Albenzio, Taibi, Dantone, Massa and Annicchiarico1999; Albenzio et al. Reference Albenzio, Caroprese, Marino, Santillo, Taibi and Sevi2004; Raynal-Ljutovac et al. Reference Raynal-Ljutovac, Pirisi, de Crémpux and Gonzalo2007) and on cheese quality (Revilla et al. Reference Revilla, Rodríguez-Nogales and Vivar-Quintana2007).
SC limit established by the Food and Drug Administration for cows is 750 000 cells/ml and 1 000 000 cells/ml for goats and sheep. In the European Union (directive 92/46 ECC Council, 1992) the legal limit for cow milk is 400 000 cells/ml, but there is no legal limit for goat and sheep milk (Paape et al. Reference Paape, Wiggans, Bannerman, Thomas, Sanders, Contreras, Moroni and Miller2007). The systematic extrapolation of dairy cattle research findings to small ruminants leads to errors in the application of discriminatory standard for sheep milk quality (Raynal-Ljutovac et al. Reference Raynal-Ljutovac, Pirisi, de Crémpux and Gonzalo2007). Sevi et al. (Reference Sevi, Albenzio, Taibi, Dantone, Massa and Annicchiarico1999) suggested a threshold of 700 000 cells/ml for ewe bulk milk of high microbial quality and renneting ability. Rosati et al. (Reference Rosati, Militello, Boselli, Giangiolini, Amatiste, Brajon, Gazzoni, Casini, Scatassa, Bono, Cannas, Mugoni, Simula, Denti, Gradassi and Fagiolo2005) inferred from discriminating analysis a cut-off value of 265 000 cells/ml for SCC in ewe bulk milk to discriminate between infected and non-infected ewes. Research is still needed to study ewe milk quality parameters especially in terms of endogenous proteolytic enzymes, immunological features, and cheesemaking ability in relation to SCC. Somatic cell threshold would be useful to differentiate ewe milk on the basis of its overall quality and utilization.
This study was therefore undertaken to assess the effect of different levels of somatic cells in individual ewe milk on i) composition and hygienic traits; ii) plasmin, cathepsin and elastase activities; iii) leukocyte differential count; iv) renneting parameters.
Materials and Methods
Experimental design
The experiment was conducted in an intensively managed commercial dairy flock constituted of 500 Comisana ewes, located in Southern Italy. Ewes were homogeneous for age, stage of lactation, parity, time of lambing, number of lambs suckled, and mean body weight (55·45±1·78 kg). Ewes were housed on straw litter; they grazed and were supplemented with hay and concentrate. The ewes were milked twice daily in a parlour using a pipeline milking machine. Two hundred individual milk samples were collected for three consecutive days a week over a three week period from ewes randomly selected day by day (a total of 1800 milk samples were collected during the study period). Before entering the parlour the selected ewes had been carefully examined by veterinarians to detect the presence or confirm the absence of signs of clinical mastitis, such as fever, pain or gland swelling. Moreover, a small quantity of milk was checked visually for signs of mastitis before collecting samples to be used in the study. Individual milk samples were assigned to five classes on the basis of their SCC detected using a Fossomatic Minor (Foss Electric, Hillerød, Denmark) according to the International Dairy Federation standard (IDF, 1995). 540 milk samples were assigned to the SC300 class (<300 000 cells/ml); 324 samples to the SC500 class (from 301 000 to 500 000 cells/ml); 270 milk samples to the SC1000 class (from 501 000 to 1 000 000 cells/ml); 306 milk samples to the SC2000 class (from 1 001 000 to 2 000 000 cells/ml) and 360 milk samples were assigned to the SC>2000 class (>2 001 000 cells/ml).
Analytical methods
Individual milk samples were collected aseptically and transported under refrigeration (4°C) to the laboratory for analysis. Milk samples were analyzed for fat, total protein, lactose, casein, and free fatty acid (FFA) (Milko Scan 133B; Foss Electric, Hillerød, Denmark), and for pH (GLP 21 Crison, Spain). Non casein nitrogen (NCN) was determined by standard procedures using the Kjeldahl method (IDF, 1993). Milk renneting characteristics (clotting time, rate of clot formation, and clot firmness after 30 min) were measured using a Foss Electric Formagraph according to the method of Zannoni & Annibaldi (Reference Zannoni and Annibaldi1981). Mesophilic bacteria were determined on Plate Count Agar (Merck KGaA, Darmstadt, Germany) incubated at 30°C for 36 h; total and faecal coliforms on Violet Red Bile Lactose agar (Merck) after 24 h incubation at 37°C and 44°C, respectively; Staphylococci were detected after 48 h incubation on Baird Parker agar (Merck) supplemented with egg yolk tellurite emulsion at 37°C. Enterococci were determined on Slanetz Bartley medium (Merck) and pyogenic streptococci on modified Edwards' aesculin medium (Merck) at 37°C after 24–48 h incubation. Pseudomonas spp., were determined using Pseudomonas selective agar (Merck) after 72 h incubation at 37°C.
Plasmin (PL), elastase, and cathepsin D activities were determined according to the procedures described by Albenzio et al. (Reference Albenzio, Santillo, Caroprese, d'Angelo, Marino and Sevi2009).
Leukocyte differential count was performed according to Koess & Hamann (2008) with modifications (Albenzio & Caroprese, Reference Albenzio and Caroprese2011). Samples were acquired by flow cytometry (Cell Lab Quanta SC™, Beckman Coulter Inc., Fullerton,CA). Linear amplification of the forward scatter (FS) and side scatter (SS) light signals was set with logarithmic amplification of the fluorescence signals. The 488 nm excitation wavelength was used. Milk lymphocytes, macrophages and PMNs were selected for analysis by gating on the FS and SS dot plot. Samples were acquired by flow cytometry (Cell Lab Quanta SC™, Beckman Coulter Inc., Fullerton, CA) and fluorescence was measured at 617 nm (FC, Flow Cytometric method).
Statistical Analysis
All the variables were tested for normal distribution using the Shapiro-Wilk test (Shapiro & Wilk, Reference Shapiro and Wilk1965) and milk SCC and microbial cell loads were transformed into logarithmic form to normalize their frequency distribution before performing statistical analysis.
All the variables were then processed using ANOVA for repeated measures of SAS (1999).
The model was (eq. 1):

where μ is the overall mean; α is the effect of SCC level (i=1–5); and ε is the error.
Linear simple correlations (LSCs) were performed between leukocyte population and enzymes activities, and between enzyme activities and renneting parameters.
When significant effects were found (at P<0·05), the Student t-test was used to locate significant differences between means.
Results and Discussion
Ewe milk is almost totally destined to cheesemaking and changes in milk quality affect the ability of milk to be processed. Although it is well known that high SCC is associated with poor milk quality, little is known about the effects of SC levels on milk composition, microbial features, indigenous proteolityc enzymes and coagulating behaviour of ewe milk.
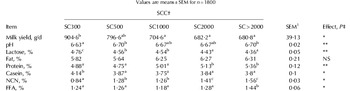
The principal ewe milk composition for the five classes of somatic cells is reported in Table 1. Milk yield was the highest in the SC300 class and declined significantly when SCC exceeded 500 000 cells/ml. Milk lactose content decreased progressively as the SCC increased. Auldist et al. (Reference Auldist, Roginski, Fuquay and Fox2003) suggested that lactose content can be considered as an indicator of the epithelial cells capacity of synthesis being implicated in the osmoregulation in milk. Irrespective of SC levels, pH values were within the range reported for ewe milk (Ramos & Juarez, Reference Ramos, Juarez, Roginski, Fuquay and Fox2003). Protein and NCN contents were the highest in milk with SCC over 1 000 000 cells/ml, whereas casein content was the highest in milk samples with less than 300 000 cells/ml. Higher protein found in milk samples with more than 1 000 000 cells/ml depends on higher NCN which is partly constituted by serum proteins from the blood and partly by fragments derived from CN hydrolysis. High SCC is generally accompanied by an enhanced influx of serum components from the extracellular fluid into the milk (Albenzio et al. Reference Albenzio, Caroprese, Santillo, Marino, Muscio and Sevi2005) which are not relevant to dairy industry (Rodríguez-Nogales et al. Reference Rodríguez-Nogales, Vivar-Quintana and Revilla2007). These results evidenced that starting from SC500 ewe milk displayed modification in the protein constituents suggesting that total protein content is not sufficient to monitor the efficiency of the mammary gland. Rodríguez-Nogales et al. (Reference Rodríguez-Nogales, Vivar-Quintana and Revilla2007) reported that, in the case of sheep milk, changes in CN concentration and not in total protein are essential to elucidate the effect of subclinical mastitis.
Least square mean±SEM of milk yield, pH, and chemical composition of individual ewe milk with different levels of SCC

† SC300 (<300 000 cells/ml); SC500 (from 301 000 to 500 000 cells/ml); SC1000 (from 501 000 to 1 000 000 cells/ml); SC2000 (from 1 001 000 to 2 000 000 cells/ml); SC>2000 (>2 001 000 cells/ml)
a–c Means within a row with different superscripts differ (P<0·05)
‡ NS not significant;
* P<0·05;
** P<0·01
1 SEM=standard error of the mean
Fat content was not affected by changes in SCC. Raynal-Ljutovac et al. (Reference Raynal-Ljutovac, Pirisi, de Crémpux and Gonzalo2007) reviewed the effects of SCC on fat content: several authors showed that SCC did not affect fat content of ewe milk, whereas other authors observed significant decrease of this parameter in milk of infected ewes. The highest percentage of FFA in ewe milk samples in group SC>2000 was ascribed to incomplete triglycerides synthesis and to increased post-secretory lipolysis as suggested by Auldist (Reference Auldist, Roginski, Fuquay and Fox2003).
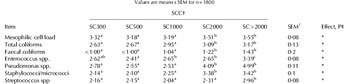
The cell load of the principal microbial groups in individual ewe milk grouped according to SCC is reported in Table 2. SC level affected microbial features in ewe milk with an increase of all the microbial groups in samples with more than over 1 000 000 cells/ml. However, in all SC classes, bacterial count at 30°C did not exceed the threshold reported in 94/71 EU directive for raw sheep and goat milk. The main microorganisms responsible for intramammary infections can be found among Staphylococci, Streptococci, Pseudomonadaceae and Enterococci: the mentioned microbial groups were highest in SC2000 and SC>2000 classes except for Steptococcus spp. which was higher only in the SC>2000 group. Sevi et al. (Reference Sevi, Albenzio, Taibi, Dantone, Massa and Annicchiarico1999) found that in ewe milk samples with more than 1 000 000 cells/ml mesophile bacterial load was consistently higher, Pseudomonas spp. was 3 to 5 fold higher and Staphylococcus spp., total and faecal coliforms were 4 to 10 times higher compared with milk samples with less than 1 000 000 cells/ml.
Least square mean±SEM of microbial cell load (log10 cfu/ml) of individual ewe milk with different levels of SCC

† For group classification see Table 1
a–c Means within a row with different superscripts differ (P<0·05)
‡ NS not significant;
* P<0·05
1 SEM=standard error of the mean
PL activity is under the control of a complex enzymatic system in which one of the plasminogen activators is associated with somatic cells (Politis et al. Reference Politis, Zhao, McBraid, Burton and Turner1991); also somatic cells contain lysosomes that release active proteloytic enzymes, i.e. elastase, cathepsin and collagenase (Kelly & McSweeney, Reference Kelly and McSweeney2002). These indigenous enzymes are of significance for milk processing quality through proteolytic disruption of intact casein. PL, elastase, and cathepsin D activities in individual milk samples grouped according to SC level were reported in Table 3. PL and elastase activities were the highest in SC2000 and SC>2000 classes, whereas PL had intermediate values in SC500 and SC1000 classes and the lowest in milk samples from SC300. Cathepsin D showed lower values in SC300 and SC1000 and higher in SC500 class. Silanikove et al. (Reference Silanikove, Merin and Leitner2006) reported that the down regulation of milk secretion is associated with a mild activation of PL with an increase between 10–40% of the enzyme activity. Under such conditions the response induced by the fragment β-CN f1-28, derived from PL activity on β-CN, affects specifically fluid secretion without affecting lactose concentration or fat and protein secretion and without affecting the integrity of tight junction and leukocyte level in the gland. On the other hand massive activation of the PL (>150%) is associated with extensive degradation of CN, disruption of tight junction, inflammatory response and reduction in lactose concentration. In this study, PL activity displayed an increase of about 30% passing from milk samples with less 300 000 cells/ml to milk samples up to 1 000 000 cells/ml, and of about 43% passing to milk samples with more than 1 000 000 cells/ml. The differences in PL activity observed among SC classes demonstrated a mild activation of PL passing from low to high level of SC.
Least square mean±SEM of PL, elastase, and cathepsin activities (U/ml) of individual ewe milk with different levels of SCC

† For group classification see Table 1
a–c Means within a row with different superscripts differ (P<0·05)
‡ NS not significant;
* P<0·05;
*** P<0·001
1 SEM=standard error of the mean
Leukocyte populations in milk samples grouped according to SC level are reported in Table 4. SCC affected the distribution of leukocyte populations with the highest percentage of lymphocytes being found in milk samples with less 1 000 000 cells/ml, whereas the highest levels of PMNL were found in milk samples with more than 1 000 000 cells/ml. It is worth noting that in SC2000 and SC>2000 classes PMNL was positively correlated with elastase (r=0·83; P<0·05) and PL (r=0·85; P<0·01) activities indicating that these two enzymes are associated with a response of the immune system of the mammary gland. The major exposure to microorganisms in SC2000 and SC>2000 classes could have induced a greater PMNL recruitment in the mammary gland, where this population reached a percentage slightly higher than 50%. In accordance, Albenzio & Caroprese (Reference Albenzio and Caroprese2011) found that PMNL was the predominant leukocyte cell type (57%) in milk samples with more than 1 000 000 cells/ml. In the present study, no differences were found for macrophages as SCC changes; this population showed a mean value of 4·5%. Previous studies demonstrated that in ewe milk macrophages minimally contribute to leukocyte population (Albenzio et al. Reference Albenzio, Caroprese, Marino, Santillo, Taibi and Sevi2004, Reference Albenzio, Santillo, Caroprese, d'Angelo, Marino and Sevi2009; Caroprese et al. Reference Caroprese, Marzano, Schena, Marino, Santillo and Albenzio2007; Albenzio & Caroprese, Reference Albenzio and Caroprese2011).
Least square mean±SEM of differential leukocyte percentage of individual ewe milk with different levels of SCC

† For group classification see Table 1
a–c Means within a row with different superscripts differ (P<0·05)
‡ NS not significant;
** P<0·01;
*** P<0·001
1 SEM=standard error of the mean
In milk samples with SCC ranging from 300 000 to 1 000 000 cells/ml the mild increase of PL activity was associated with the increase of NCN and the absence of differences in leukocyte populations could be the outcome of a major influx of blood component into the milk rather than the result of an active mechanism of immune defence of the udder. On the contrary, in samples with more than 1 000 000 cells/ml the further increase of PL activity together with higher microbial loads, elastase activity, and PMNL suggests a response of the immune system of the mammary gland.
Renneting parameters in milk samples grouped according to SC levels are reported in Table 5. Longer clotting time was found in samples from SC>2000 class, while impaired clot firmness was found in SC500 and SC>2000 classes. Clotting time was positively correlated with PL (r=0·74; P<0·001) and elastase activity (r=0·80; P<0·01), whereas cathepsin D was negatively correlated with clot firmness (r=−0·66; P<0·01). Coagulating index (CoI), which is considered an index of milk coagulation performance, had the highest value in milk samples with less than 300 000 cells/ml confirming that the better milk quality together with lower indigenous proteolytic enzymes activity played a role in cheesemaking features of ewe milk. In previous work Albenzio et al. (Reference Albenzio, Santillo, Caroprese, d'Angelo, Marino and Sevi2009) reported that the impairment of clot firmness is an outcome of casein breakdown brought about by cathepsin D especially on αs-CN which is a structural component of casein micelles. In the present research highest level of cathepsin D together with intermediate levels of PL were able to determine an impaired clotting time, clot firmness and coagulating index as a consequence. These findings confirmed that cathepsin D is able to play a role in the impairment of coagulating behaviour of ewe milk.
Least square mean±SEM of renneting parameters of individual ewe milk with different levels of SCC

† For group classification see Table 1
a–c Means within a row with different superscripts differ (P<0·05)
‡ NS not significant; *P<0·05; ***P<0·001
§ Calculated as the clot formness to clotting time + rate of clot formation ratio
1 SEM=standard error of the mean
Several authors have suggested that if ewe milk has an elevated SCC its cheesemaking properties will deteriorate, i.e. displayed a longer coagulation time and a weak coagulum leading to poor syneresis, lower cheese yield, increased moisture content and lower fat content in cheese (Albenzio et al. Reference Albenzio, Caroprese, Santillo, Marino, Muscio and Sevi2005; Revilla et al. Reference Revilla, Rodríguez-Nogales and Vivar-Quintana2007).
In conclusion, results on milk yield and compositional parameters showed an impairment of ewe udder efficiency starting from 300 000 cells/ml. Changes in composition and PL activity of ewe milk with 300 000 to 1 000 000 cells/ml suggest that such secretion could be regarded as a transition milk from normal to mastitic milk.
Data suggest that PL activity in milk can be considered as marker of the synthetic and secreting ability of the ewe mammary gland; furthermore PL and elastase activities in milk are consistent with the health status of the udder. Finally, cathepsin D played a role in the impairment of renneting properties of ewe milk.