


INTRODUCTION
Quantification and monitoring of landscape composition and structure have become important tasks in ecology and biogeography, providing insight into relationships between ecological processes and spatial patterns (Turner Reference Turner2005). These relationships are of great significance for the conservation and management of protected areas, since species often depend on specific habitats and are at greater risk of extinction when these habitats are degraded or lost (Fahrig Reference Fahrig2003; Norris & Harper Reference Norris and Harper2004). In order to understand and mitigate the negative impacts of habitat fragmentation on biodiversity, this assessment has to take place both in and around protected areas (Bengtsson et al. Reference Bengtsson, Angelstam, Elmqvist, Emanuelsson, Folke, Ihse, Moberg and Nyström2003; EEA [European Environment Agency] 2004; Jongman & Pungetti Reference Jongman and Pungetti2004).
The designation of the Natura 2000 European network of protected sites (http://ec.europa.eu/environment/nature/natura2000/) is an important step towards biodiversity protection, however, it may not by itself be adequate to ensure that current and upcoming conservation targets are achieved (Araújo et al. Reference Araújo, Cabeza, Thuiller, Hannah and Williams2004). One of the European Union's main targets is to halt loss of most the important habitats and species by 2020 (Commission of the EC [European Communities] 2010). This target should be implemented both within Natura 2000 sites but also in the wider countryside. The efficiency of conservation within Natura 2000 sites also depends on conservation in the surrounding landscape (Bengtsson et al. Reference Bengtsson, Angelstam, Elmqvist, Emanuelsson, Folke, Ihse, Moberg and Nyström2003). There is therefore, a need to monitor activities beyond the Natura 2000 boundaries since understanding the spatial pattern of habitat patches and the character of the intervening landscape matrix is of utmost importance for the ecological structure and function of protected areas (Forman Reference Forman1995). Ecological monitoring of Natura 2000 sites is part of the statutory obligations of every European Union (EU) member state. However, monitoring the processes in the area surrounding a Natura 2000 site is not required, and unlikely to take place or gain member states’ commitment, given time, resources and institutional restrictions (Papageorgiou & Vogiatzakis Reference Papageorgiou and Vogiatzakis2006). Therefore, there is a need to develop rapid assessment methods.
Traditionally, protected area management has focused on within-site management in order to ensure protection of the biota, however, evidence from ecological theory and practice suggest that the structure and quality of the surrounding landscape are as important as the protected area itself (Vandermeer & Carvajal Reference Vandermeer and Carvajal2001; Brotons et al. Reference Brotons, Mönkkönen and Martin2003; Ockinger et al. Reference Öckinger, Bergman, Franzén, Kadlec, Krauss, Kuussaari, Pöyry, Smith, Steffan-Dewenter and Bommarco2012 a, b). There are many habitats outside protected areas which are of high biodiversity value in Europe and the UK in particular (EEA 2004). Modifications of the landscape matrix may affect the spatial configuration of existing habitats and in turn their overall quality. High quality habitats between protected areas may act as important corridors, buffers or stepping stones for biodiversity (EEA 2004). Landscape configuration can be the most visible change around protected sites. However, changes in habitat quality are equally important at a smaller scale for species persistence. Habitat quality can be defined as the ability of the environment to provide conditions appropriate for individual and population persistence (McDermid et al. Reference McDermid, Franklin and LeDrew2005) and maintaining habitat quality is therefore critical to nature conservation policy. Assessing habitat quality can entail expensive species-level surveys and monitoring, and, for that reason, generic habitat quality indices have been used as a surrogate for rapid species monitoring (Luque & Vainikainen Reference Luque, Vainikainen, Lafortezza, Sanesi, Chen and Crow2008).
Habitats are recognizable entities that can be identified, mapped and managed. In the absence of detailed current or historical habitat maps, ecological studies have relied on land cover as a surrogate for habitat mapping or to define broad habitat classes (see Bunce et al. Reference Bunce, Metzger, Jongman, Brandt, de Blust, Elena-Rossello, Groom, Halada, Hofer, Howard, Kovář, Mücher, Padoa-Schioppa, Paelinx, Palo, Perez-Soba, Ramos, Roche, Skånes and Wrbka2008). This has been facilitated by the availability and low cost of medium to high resolution satellite imagery or aerial photographs (Alexander & Millington Reference Alexander and Millington2000). In this paper, we use the term land-cover quality to refer to the (potential) ability of a particular land-cover type as habitat for supporting diversity of a particular taxonomic group as evaluated by experts. High quality equates to land-cover types/habitats able to support high species richness/diversity (irrespective of individual identity).
Landscape composition affects habitat quality directly or indirectly through its influence on the resource base, population subdivision, human influence and disturbance regimes (Kupfer et al. Reference Kupfer, Malanson and Franklin2006). Landscapes are intrinsically multi-functional as they integrate ecology, agriculture and settlement patterns. As such, in addition to supporting biodiversity conservation targets (namely habitats and species), they should also serve the needs of sustainable agriculture, the rural economy and recreation. Managing land for biodiversity can, therefore, lead to conflicts with other land management purposes. However, some land uses are more favourable to biodiversity than others, and improved spatial planning can support biodiversity at the landscape level (Lee & Thompson Reference Lee and Thompson2005; Lindborg et al. Reference Lindborg, Bengtsson, Berg, Cousins, Eriksson, Gustafsson, Hasund, Lenoir, Pihlgren, Sjödin and Stenseke2008; Griffiths et al. Reference Griffiths, Vogiatzakis, Porter and Burrows2011). In Europe, the rapid landscape changes seen in the past 50 years have occurred against the background of a long and varied history of settlement and landscape evolution. Agricultural industrialization has resulted in a change from small-grained and heterogeneous to more homogeneous and mono-functional agricultural landscapes (Brandt & Vejre Reference Brandt and Vejre2003). The changes in the quantity, quality and spatial configuration of different land uses can directly or indirectly impact biodiversity (see review by Haines-Young Reference Haines-Young2009) while emerging synergies between land use and other forms of environmental change may also affect it (Rounsevell et al. Reference Rounsevell, Berry and Harrison2006 a). Whereas land-use changes are a principal driver of biodiversity loss at present (MEA [Millenium Ecosystem Assessment] 2005; UK NEA [National Ecosystem Assessment] Reference NEA2011), recent studies have also highlighted the significance of historical landscape setting for biodiversity which is only evident after a time lag (Cousins Reference Cousins2009; Kuussaari et al. Reference Kuussaari, Bommarco, Heikkinen, Helm, Krauss, Lindborg, Öckinger, Pärtel, Pino, Roda, Stefanescu, Teder, Zobel and Steffan-Dewenter2009; Krauss et al. Reference Krauss, Bommarco, Guardiola, Heikkinen, Helm, Kuussaari, Lindborg, Öckinger, Pärtel, Pino, Pöyry, Raatikainen, Sang, Stefanescu, Teder, Zobel and Steffan-Dewenter2010). Defining habitat/land-cover quality on the basis of high species presence is common practice (see for example Haddad & Tewksbury Reference Haddad and Tewksbury2005), however, standardized data for estimating species richness in given land-cover classes (habitats) are scarce, while the ability to assess historic change is limited. In addition, with emerging environmental changes there is a need to evaluate the potential for biodiversity of future land-cover patterns in order to provide rapid assessment tools for policy making.
We examined a selected set of landscapes adjacent to UK Natura 2000 sites, and aimed to: (1) evaluate historic habitat quality changes (composition, structure) and predict future changes; and (2) assess the effects of past and future habitat quality changes on four important components of biodiversity, namely plants, birds, bees and butterflies. To this effect, we developed a habitat quality estimate that was linked to different land-cover classes, based on the opinion of experts for these four taxonomic groups. The nature of past land-use/land-cover changes in the study sites were previously discussed (Köhler et al. Reference Köhler, Olschofsky and Gerard2006; summary in Appendix 1, Table S1, see supplementary material at Journals.cambridge.org/ENC). Therefore, we only present land-use/land-cover changes resulting from the application of the land-use scenarios we used in this paper.
METHODS
Land-cover is defined as the observed physical cover on the Earth's surface, whereas land use involves the management and modification of natural environment by humans (Haines-Young Reference Haines-Young2009). Due to the interdependence of these terms, we use the term land use and land cover (LULC) throughout the text to refer to the relevant datasets used and changes recorded.
Study sites and historical land-use land-cover (LULC) data
We compiled data from seven UK areas, each hosting a Natura 2000 site (Fig 1; Appendix 1, Table S1, see supplementary material at Journals.cambridge.org/ENC). Four of those areas were in southern England (site codes: UK1, UK2, UK5 and UK6), one in northern England (site code: UK3) and two in Scotland (site codes: UK8 and UK9). They contain a mixture of upland and lowland sites with a wide range of habitats from Caledonian pine forests to lowland heathlands and sand dune formations (Appendix 1, Table S1, see supplementary material at Journals.cambridge.org/ENC). We selected the areas based on the availability of historical and current LULC data, provided by the BIOPRESS project (Thomson et al. Reference Thomson, Manchester, Swetnam, Smith, Wadsworth, Petit and Gerard2007) covering the years 1950, 1990 and 2000. The size of each area, or transect, was set at 2 km × 15 km and was interpreted at a minimum mapping unit of 0.5 ha (Gerard et al. Reference Gerard, Petit, Smith, Thomson, Brown, Manchester, Wadsworth, Bugar, Halada, Beza´k, Boltiziar, De Badts, Halabuk, Mojses, Petrovic, Gregor, Hazeu, Mücher, Wachowicz, Huitu, Tuominen, Köhler, Olschofsky, Ziese, Kolar, Sustera, Luque, Pino, Pons, Roda, Roscher and Feranec2010) (Fig. 1).
Location of the seven United Kingdom transects used in this study and an example of land-cover quality changes for bees in transect UK5. Area maps correspond to mean land-cover quality (evaluated on a scale of 0–5) for bees (QUALBEES) for the time slices 1950, 1990 and 2000, calculated from expert evaluation of CORINE level 3 land-cover classes.

Future land-use land–cover (LULC) data
We projected LULC changes for 2030 for three alternative scenarios, in order to explore a range of plausible futures. Scenarios are neither a forecast nor a prediction, but a useful tool for exploring possible future outcomes using internally consistent narrative storylines (Rounsevell & Metzger Reference Rounsevell and Metzger2010). Our LULC change projections follow three scenarios (Reginster et al. Reference Reginster, Rounsevell, Butler, Dendoncker, Settele, Penev, Georgiev, Grabaum, Grobelnik, Hammen, Klotz, Kotarac and Kühn2010; Spangenberg et al. Reference Spangenberg, Carter, Fronzek, Jaeger, Jylhä, Kühn, Omann, Paul, Reginster, Rounsevell, Schweiger, Stocker, Sykes and Settele2012) that are based on the approach described by Rounsevell et al. (Reference Rounsevell, Reginster, Araujo, Carter, Dendoncker, Ewert, House, Kankaanpaa, Leemans, Metzger, Schmit, Smith and Tuck2006 b) to estimate and spatially allocate aggregate quantities of land-use change for the major land-use classes (such as urban or cropland) across Europe at a 10 arcmin resolution (c. 16 km × 16 km). We modelled the data using three differing future scenarios. (1) The growth applied strategy (GRAS) scenario, oriented towards economic growth and driven by a (neo)liberal policy pattern, where current protected areas are preserved but the NATURA 2000 network is not enforced. (2) The business-as-might-be-usual (BAMBU) scenario, namely a continuation of currently known socioeconomic and policy strategies, including foreseeable modifications, where current protected areas are preserved and the NATURA 2000 network is enforced. (3) The sustainable European development goal (SEDG) normative scenario, focused on the achievement of environmentally, socially and economically sustainable development, where current protected areas are preserved and the NATURA 2000 network is enforced.
The allocation of projected LULC change from the pan-European scenarios to the highest level of thematic resolution provided by the Coordination of Information on the Environment (CORINE) land-cover (CLC) map (namely CLC level 3) (European Commission 1994) consisted of three steps, and is described in detail in Rickebusch et al. (Reference Rickebusch, Metzger, Xu, Vogiatzakis, Potts, Stirpe and Rounsevell2011). Firstly, we derived the relative change in four aggregated land-use change categories (urban, cropland, grassland and forest) from the pan-European scenarios and converted this into an absolute increase or decrease in 1-ha grid cells using the transect data. Secondly, we thematically disaggregated these changes to the detailed CLC categories, including three new bioenergy categories, namely ‘woody crops’ (such as short-rotation coppicing/willow), ‘non-woody crops’ (for example Miscanthus) and ‘liquid biofuels’ (derived from traditional crops such as maize, wheat or oil-seed rape). This provides information about the number of 1-ha grid cells by which each land-cover category will increase or decrease under each scenario. Finally, we allocated these changes in the transect using a combination of scenario-specific rules, regional information and expert judgement. The order of precedence for the LULC change allocation was: (1) protected areas, (2) urban areas, (3) agricultural land, (4) forest and (5) abandoned land (former cropland or pastures).
Measuring land-cover quality
We developed a land-cover quality model based on expert opinion to assess changes in land-cover and overall landscape quality. For each transect we calculated a quality index (QI) for 1950, 1990, 2000 and for each of the three 2030 scenarios. We calculated this index according to:
 \begin{equation*}
QI\; = \;\sum\limits_{i = 1}^n {\left( {Q_i \times p_i } \right)_{i } }
\end{equation*}
where Qi is the quality score of each CORINE land-cover parcel i, pi is the proportion of this parcel's area with respect to the overall transect area and n is the number of parcels in the transect.
Land-cover quality scores (Qi ) were based on the opinion of at least 10 UK experts for each taxonomic group. The experts were identified on the basis of their research experience, demonstrated by their publication record or their long-term practical experience in land management for the respective taxa. Experts were given the full descriptions of all land-cover classes according to CORINE (European Commission 1994) and were asked to rate them from 0 to 5 (where 0 was the lowest and 5 the highest value). Quality was defined here as a broad measure of the overall value of the land-cover type for general biodiversity for every taxonomic group, and therefore was not related primarily to rare species. Judgment was made on the basis of which land-cover types could potentially support the greatest diversity of plants, birds, bees and butterflies. Responses for every land-cover category and for every taxon were averaged and mapped into the GIS for each year as a basis for assessing changes in land-cover quality over time (Fig. 1). We mapped the average quality and its variation according to the experts’ responses together with the QI (Fig. 2; Appendix 1, Table S2, see supplementary material at Journals.cambridge.org/ENC). We calculated the rate of land-cover quality change for the five periods. Based on this potential maximum, and in order to examine whether changes in quality are proportionate in magnitude to changes in land-cover we set three rates of change/thresholds (1%, 2% and 5% per decade), against which we compared changes in quality over the five periods examined. These three thresholds represent a range of likely rates of change of individual land-cover classes, around the average rate of 4% reported by Gerrard et al. (Reference Gerard, Petit, Smith, Thomson, Brown, Manchester, Wadsworth, Bugar, Halada, Beza´k, Boltiziar, De Badts, Halabuk, Mojses, Petrovic, Gregor, Hazeu, Mücher, Wachowicz, Huitu, Tuominen, Köhler, Olschofsky, Ziese, Kolar, Sustera, Luque, Pino, Pons, Roda, Roscher and Feranec2010).
Average land-cover quality (QUALBUT) including standard error (StandError) for butterflies in UK1 in 1950. Mean values and standard error were calculated from experts’ evaluation of CORINE level 3 land-cover classes.

We identified land parcels with high quality for all taxonomic groups by summing up the values of all the evaluations (derived from experts’ opinions) for all time slices (Fig. 3). Given that the range of quality was 0 to 5, we chose the median value of each taxonomic group and then summed across taxonomic groups. Any land parcel with an overall value greater than 12, out of a maximum possible value of 20, was classed as high quality. For the high quality patches within each transect, we calculated the total area, mean patch size and adjacency to other high quality patches using the VLate extension (Lang & Tiede Reference Lang and Tiede2003) within ArcGIS and percentage changes between time slices. The three metrics were selected since they represent the major components of fragmentation (Fahrig Reference Fahrig2003). In addition, we used Shannon's diversity and evenness indices as applied to landscapes (see MacGarigal Reference MacGarigal2013) to calculate diversity of high quality patches in every transect.
High quality areas (shown in lighter shading) for UK6 for both present (2000) and future (2030) scenarios (BAMBU, GRAS and SEDG). High quality land parcels for all taxonomic groups were identified by summing the values of all evaluations (experts’ opinions) for all time slices.

The Wilcoxon signed rank test was used to test the null hypothesis that there were no changes in land-cover quality for the four taxonomic groups between the periods. 1950–1990, 1990–2000, 2000–2030 (BAMBU), 2000–2030 (GRAS), and 2000–2030 (SEDG).
RESULTS
All future scenarios show small to medium increases in urban areas, mostly at the expense of agricultural land. Agricultural land, especially pasture, decreases considerably in all scenarios. The GRAS scenario shows the largest loss of agricultural land, most of which is abandoned, with some conversion to bioenergy crops. The SEDG scenario has the smallest decrease in agricultural land, and most of this is converted to bioenergy crops, with little or no abandonment. Forested areas show only small increases or decreases depending on area and scenario. Lost forest is generally converted to woody bioenergy crops. The BAMBU scenario generally represents the middle ground between the other two scenarios, though it is marginally closer to the GRAS scenario.
Quality evaluation
For most semi-natural classes there was a general agreement on the quality value of the four taxonomic groups (Appendix 1, Table S2, see supplementary material at Journals.cambridge.org/ENC). The classes that received the most varied response were urban and wetland. More specifically, for birds, the classes that showed the greatest variation in responses were industrial units, construction sites, roads and rail networks. For plants, it was the artificial classes, particularly continuous urban fabric and construction sites, but also wetland classes such as salines and intertidal flats. For bees and butterflies, construction sites, burnt areas and water-related classes showed the greatest variation between experts’ opinions.
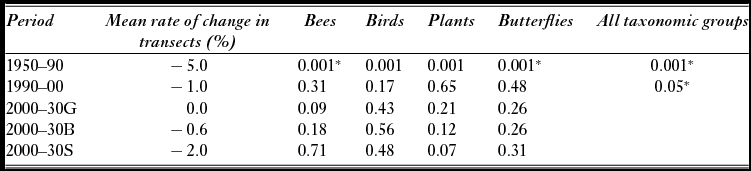
The rates of quality change, averaged across sites, were –5% for the period 1950–1990 and –1% for 1990–2000 (Table 2). For the 30-year projection scenarios, GRAS gave 0% of change, BAMBU –0.6% and SEDG –2%. For the 1% threshold of change, there was high loss of land-cover quality for the majority of sites and taxonomic groups for the period 1950–1990, while during 1990–2000 and in the GRAS and BAMBU scenarios, there was moderate loss overall but also some gains (Table 2). SEDG shows high losses compared to the other two scenarios. For the 2% threshold, there were high losses in land-cover quality for the period 1950–1990 and the SEDG scenario. All the other time slices/scenarios gave moderate losses of land-cover quality with some gains overall. For the 5% threshold, all periods showed moderate losses (particularly for GRAS and BAMBU), with a few high losses (for the period 1950–1990 and the SEDG scenario) and limited gains only for Hackpen Hill (site code UK2). For 1950–1990 and 1990–2000, all sites showed quality loss for all taxa, particularly at the 1% and 2% thresholds. Butterflies did particularly well under the GRAS scenario for all levels, while birds seemed to be the worst affected taxonomic group in terms of land-use quality under the SEDG scenario for the 1% and 2% thresholds (Table 2).
There were significant changes in land-cover quality for all sites and taxonomic groups for the period 1950–1990, however, during 1990–2000 there were no statistically significant changes to reverse or extend this trend (Table 1). The GRAS and BAMBU scenarios showed no significant changes either for sites or for taxonomic groups, however, the SEDG scenario showed further deterioration of land-cover quality with the exception of the Sands of Forvie transect (UK8), although this was not statistically significant. All three scenarios seem to have overall negative effects on land-cover quality in the Kennet Valley transect (UK1). When all the taxonomic groups were pooled together, we identified significant changes for the periods 1950–1990 and 1990–2000, but did not detect significant changes for any of the projected scenarios (Table 1).
Rate of land-cover quality change and Wilcoxon signed rank test significance level (*) for the four taxonomic groups examined.
Land-cover quality changes from 1950–2030. Negative values indicate loss in quality and positive values indicate gain in quality. For every threshold examined, ** indicates high loss (greater than the threshold), *indicates moderate loss (greater than 0 but less than the threshold) and no asterisks indicate gain in quality (positive values) (see text for details). GRAS = growth-applied strategy scenario, BAMBU = business-as-might-be-usual scenario, and SEDG = sustainable European development goal scenario. Butter = butterflies. Results for 5% threshold are provided in Appendix 1 (Table S3, see supplementary material at Journals.cambridge.org/ENC).

High quality patches
From 1950 to 1990, high quality patches increased in area in all but two transects. The transects showed mixed responses in terms of mean patch size, while adjacency decreased (Table 3). During the period 1990–2000, the total area of high quality patches within each transect was relatively stable or increased slightly, while the mean patch size decreased slightly and adjacency, with two exceptions: Kennet Valley (UK1) and Moor House Alston (UK3) remained stable. The scenarios showed a significant increase in area and mean patch size for the GRAS and BAMBU scenarios, with the exception of Rannoch Moor (UK9), while for SEDG scenario, half the sites showed an increase and the other half a decrease for these metrics (Table 3). For most transects the future scenarios retained or increased diversity of high quality patches in the landscape (Table 3).
Percentage change in area, mean patch size (MP) adjacency (Adj) and Shannon diversity (ShD) for the high quality parcels during the time periods 1950–1990, 1990–2000 and modelled using the three differing scenarios for 2000–2030. GRAS = growth-applied strategy scenario, BAMBU = business-as-might-be-usual scenario, and SEDG = sustainable European development goal scenario.

DISCUSSION
Land-use land-cover (LULC) change
The results suggest that, despite differences in past LULC changes (Appendix 1, Table S1, see supplementary material at Journals.cambridge.org/ENC), future changes in the sites are quite similar with no significant differences between upland and lowland sites. Urban expansion remains relatively low in all sites, while all sites would suffer moderate to large loss of grasslands
Although the quantities of new urban areas within a given transect are similar for the three scenarios, their location varies considerably, in accordance with the scenario storylines (from which the allocation rules derive). The SEDG scenario shows compact urban development around existing centres, whereas the GRAS scenario shows urban sprawl and new settlements. For agricultural land, the scenarios differ not only in the quantity of land lost, but also in its quality and what becomes of it. In the GRAS scenario the decline mostly affects extensive agricultural land. This is for a large part abandoned, with some conversion to bioenergy crops or urban land uses. Conversely, the SEDG scenario, does not show this intensification trend; there is significantly less abandonment, but substantial conversion to bioenergy crops.
Uncertainty is inherent in these scenario exercises, and includes different world-views in developing narrative storylines, or model input parameter assumptions, which cannot be described probabilistically (for a detailed discussion see Rounsevell & Metzger Reference Rounsevell and Metzger2010).
Downscaling of LULC change projections using statistical methods (Verburg et al. Reference Verburg, Schulp, Witte and Veldkamp2006, Reference Verburg, Eickhout and van Meijl2008) is often limited in spatial (grid cell size) and thematic (number of land-use categories) resolution, making it unsuitable for many ecological studies. The downscaling method used here has the advantage of allowing a fine spatial (100 m) and thematic (CLC level 3) resolution. The final allocation of LULC change, combining rules and expert judgement, simulates actual decision-making processes more closely than statistical downscaling. The main constraint of this method is that it is time-consuming and would be difficult to apply to areas larger than a few thousand grid cells (Rickebusch et al. Reference Rickebusch, Metzger, Xu, Vogiatzakis, Potts, Stirpe and Rounsevell2011).
Quality change
The rate of land-use quality change from 1950 to 1990 (5%) was, on average, 1% per decade, which is similar to the 1990–2000 rate. This indicates that the rate of quality loss has remained roughly constant across sites through time. The significant quality changes that took place for all transects during 1950–1990 are direct results of associated major LULC changes. These include, for example, urban expansion in Kennet Valley, Butser Hill and the Cotswold Beechwoods (UK1, UK5 and UK6, respectively), intensification of arable land and loss of pasture in Kennet Valley, Hackpen Hill and Butser Hill (UK1, UK2, UK5) (Köhler et al. Reference Köhler, Olschofsky and Gerard2006). In the scenarios, the GRAS results show stabilization, with the BAMBU results close to stabilization. The SEDG results show a further loss of quality, though this is lower than expected in view of the past rate (c. 1% loss per decade). In other words, without the change in policy towards biofuels, 3% loss is expected between 2000 and 2030.
The sites responded quite differently in terms of overall quality for the various taxonomic groups through time. The quality of some sites, such as Sands of Forvie (UK8), has been improving continuously since the 1950s for the majority of taxonomic groups, while others, such as Moor House Alston (UK3), have been improving in quality since the 1990s. Some sites are affected more than others by a particular scenario, such as Kennet Valley (UK1), Cotswold Beechwoods (UK6) and Rannoch Moor (UK9), which show great losses in quality under the SEDG scenario.
Changes in high quality patches, in terms of area, do not follow the overall land-cover quality changes in the transects. From 1950 to 1990, the major change observed was the loss of connectivity between high quality parcels. From 1990 to 2000, the major change was the reduction in the mean patch size of high quality patches. For the BAMBU and GRAS scenarios, the main shift in quality was an increase in the area of high quality patches. SEDG was the only scenario that showed mixed effects. Although SEDG was the most ‘environmentally friendly’ of our three model scenarios, it also imposed a high demand for bioenergy crops, which limits agricultural land abandonment and therefore biodiversity support; however, this will greatly depend on production methods and, under the SEDG scenario, more environmentally-friendly production methods may be developed and implemented. In addition, abandoned land in the GRAS and BAMBU scenarios was assumed to follow the path of natural succession; however, land could also be subject to alternative uses that may be less favourable to biodiversity.
Some transects have become more fragmented than others in the past (for example Hackpen Hill [UK2] from 1950 to 1990, and Moorhouse Alston [UK3] from 1950 to 1990), however, there was no evidence that one scenario was more likely to accelerate fragmentation as a whole, although individual scenarios appeared to promote patch loss, reduction or lack of connectivity (Fahrig Reference Fahrig2003), depending on the site. For most transects, the scenarios we applied retained or increased landscape diversity of high quality patches in the future. This is an important finding, since landscape diversity and heterogeneity is conducive to biodiversity richness (Tscharntke et al. Reference Tscharntke, Klein, Kruess, Steffan-Dewenter and Thies2005) and population stability (Oliver et al. Reference Oliver, Roy, Hill, Brereton and Thomas2010).
A major issue here is whether land-cover quality can be used as a surrogate for biodiversity in the absence of detailed habitat mapping. Using surrogates to measure habitat quality has been criticized as lacking reliability (Johnson Reference Johnson2007). Some European land-cover monitoring schemes include qualitative aspects (Hill et al. Reference Hill, Roy, Mountford and Bunce2000), but this is not the case at the pan-European level, and was not so for historical land-cover data (for example in the 1950s). Therefore, this approach provides an easy, rapid and pragmatic overview of land-cover quality for biodiversity support. The difficulties in defining quality have been well documented (McDermid et al. Reference McDermid, Franklin and LeDrew2005; Johnson Reference Johnson2007), and were also flagged by expert respondents during the survey. However, the results suggest that the experts in the present study generally agreed about what constituted a ‘favourable’ or ‘non-favourable’ land cover for biodiversity support in the four taxonomic groups. Recorded variation in experts’ responses can be directly related to the broad description of land-cover classes as a result of the mapping employed. The accuracy of land-cover mapping is a function of the thematic resolution, cartographic standards and interpretation (see Herold et al. Reference Herold, Woodcock, Di Gregorio, Mayaux, Latham and Schmullius2006), and CORINE is no exception.
A further assumption is that the relative quality of a land-cover type has remained constant over time. Management practices have changed since the 1950s, and therefore the quality of a land-cover class might vary over the years. However, when a land-cover class is compared to adjacent land-cover classes in a certain area at a point in time, the overall qualitative assessment has the same significance. In other words, low quality in the 1950s means the same as low quality in the 1990s, even if an absolute qualitative comparison between them might not be possible. In essence, this is a relative comparison of quality that first takes place between different land-cover classes at any given point in time and then between points in time for all land-cover classes examined.
Policy implications
With the European Landscape Convention in place (Council of Europe 2000) the protection, management and planning of landscapes is for the first time coming to the forefront of European policy. The Convention promotes multi-functional landscapes through the integration of landscapes into sectoral policies. Although by definition the GRAS scenario has weak planning policy and may, in theory, favour monofunctionality, when applied here it showed a stabilization of quality change with some support of high quality patches for biodiversity. The BAMBU and SEDG scenarios were more conducive to the creation of multifunctional landscapes by definition (Rickebusch et al. Reference Rickebusch, Metzger, Xu, Vogiatzakis, Potts, Stirpe and Rounsevell2011), but while BAMBU effects were consistent with the narrative, SEDG data suggested continuing loss of overall quality within transects and weaker support of high-quality parcels.
The highest loss of land-cover quality for most of the taxonomic groups, irrespective of the threshold selected, occurred 1950–1990. This might be particularly alarming for conservation efforts in an area where biodiversity responses have considerable time lags (Lindborg & Eriksson Reference Lindborg and Eriksson2004; Cousins Reference Cousins2009). Changes were less marked for the period 1990–2000, which is as expected, since it is shorter compared to the other four periods examined. Projected models for 2030 showed that, despite the overall deterioration in land-cover quality, there were still high-quality corridors present within most of the transects around the Natura 2000 sites, which might enhance biodiversity conservation. With the declared objective to halt biodiversity loss by 2020, the emphasis has been placed on maintaining the coherence of the Natura 2000 network, which is under increasing pressure from land-use change and landscape fragmentation (Commission of the EC 2010). Increasing connectivity is important for the functioning of protected areas and has been applied as a policy instrument to counteract fragmentation (see Parkhurst et al. Reference Parkhurst, Shogren, Bastian, Kivi, Donner and Smith2002). For the transects situated in multifunctional landscapes (four out of the seven used in this study), the presence of corridors with high quality patches is encouraging for biodiversity.
Even when an area is designated for protection, the successful conservation of species is not guaranteed. Protected areas are subject to both natural (such as drought and flooding) and human (such as forest clearing) threats, and benefit from the creation of further similar sites to reduce extinction risk. Changes within a transect might reflect the pressures from external factors, including Common Agricultural Policy reform, and biofuel and other national policies. Nevertheless, our results highlight that there is a need to monitor activities beyond the Natura 2000 boundaries, since understanding the spatial pattern of land parcels and the character of the intervening matrix is of utmost importance for the ecological structure and function of protected areas.
Following the Convention on Biological Diversity (www.cbd.int), the European Union initially followed an ambitious target of reducing biodiversity loss by 2010, but the deadline for achieving this has shifted to 2020 (Commission of the EC 2010). As the evidence for the links between land use and biodiversity is increasing, a key issue for policy makers remains the robustness of the evidence base to inform policy action (Haines-Young 2010). In support of policy, the focus of the scientific community has been on how to assess progress towards these set targets. In the absence of systematic species data collection, monitoring may need to increasingly rely on quick and reliable rapid assessment tools. The ability to provide timely and reliable information on LULC changes has been recognized at the European level, which has led to initiatives such as Copernicus (which provides land monitoring service to support a wide range of European policies on environmental issues, www.copernicus.eu). The evaluation of land-cover quality, in particular by means of future scenarios, can be used to design multifunctional landscapes and provide guidance for biodiversity planning around Natura 2000 sites. The scenarios used here result in landscapes that provide corridors and stepping stones for overall biodiversity or for specific taxonomic groups. Although this is a UK-based exercise, it may be repeated for individual species of interest and, once the scenario data is provided, can easily be repeated by practitioners and used for communication to policy makers. At the European level, this would involve the consultation of a wide range of experts from different countries to develop an EU-wide interpretation of land-cover quality that would account for variations within CLC classes between countries. The results of this and other relevant studies may inform and support policy intervention to mitigate the potential risks related to land-use changes and landscape fragmentation around protected areas.
ACKNOWLEDGEMENTS
This research was funded by EU FP6 project COCONUT (SSPI-CT-2006–044343), with additional support from SCALES (EC FP7 grant 226852) and STEP (EC FP 7 grant 244090). We thank Dr France Gerard (Centre for Ecology and Hydrology) for providing the BIOPRESS dataset, Dr Geoffrey H. Griffiths (University of Reading) for proofreading, and three anonymous reviewers for their constructive comments. We are grateful to the following experts (in alphabetical order), who took time to participate in the assessment exercise: M. Albertini, G. Allen, K. Biesmeijer, N. Bourn, N. Bowles, M. Burgess, S. Butler, E. Chambers, K. Coleman, G. Collins, W. Creswell, H. Devlin, J. Dover, S. Falk, F. Gilbert, J. Gill, D. Goulson, R. Green, G. Griffiths, N. Jones, R. Kenward, K. Kirby, P. Kirkland, M. Kuhlmann, W. Kunin, M. Macdonald, D. McCracken, J. Mitchley, S. Mortimer, M. Nicholl, K. Norris, M. Oates, R. Pakeman, S. Potts, S. Roberts, D. Smith, M. Warren, M. Webb, D.Westbury, M. Whittingham, A. Wilby, P. Williams and M. Young.
Supplementary material
To view supplementary material for this article, please visit Journals.cambridge.org/ENC



