1. Introduction
The Rayleigh–Taylor (RT) instability is one of the most prominent fluid instabilities. This instability, for a fluid in a gravitational field, was first observed by Rayleigh (Reference Rayleigh1900) and later implemented to the configuration of accelerated fluids by Taylor (Reference Taylor1950). Since then numerous experiments and numerical simulations have been conducted in order to advance understanding at a fundamental level and study its role in applications pertaining to various scientific disciplines. For a hydrodynamic (HD) fluid under gravity, detailed theoretical work has been done by Chandrasekhar (Reference Chandrasekhar1981). Many research studies have been pursued and published on this topic so far (Youngs Reference Youngs1984; Waddell, Niederhaus & Jacobs Reference Waddell, Niederhaus and Jacobs2001; Livescu Reference Livescu2004; Piriz et al. Reference Piriz, Cela, Cortazar, Tahir and Hoffmann2005; Guo & Tice Reference Guo and Tice2010; Nilson et al. Reference Nilson, Gao, Igumenshchev, Fiksel, Yan, Davies, Martinez, Smalyuk, Haines and Blackman2014; Baldwin, Scase & Hill Reference Baldwin, Scase and Hill2015; Lyubimova, Vorobev & Prokopev Reference Lyubimova, Vorobev and Prokopev2019). Furthermore, in the context of plasma medium, the charged species respond to electromagnetic forces, and various scenarios arise where an inverse stratification against a force (and/or a pseudo force due to the choice of the frame) leads to this instability (Hoshoudy Reference Hoshoudy2009; Liberatore et al. Reference Liberatore, Jaouen, Tabakhoff and Canaud2009). Studies for different types of plasmas under various conditions have been carried out (Dickinson et al. Reference Dickinson, Bostick, DiMarco and Koslov1962; Ariel & Bhatia Reference Ariel and Bhatia1970; Nayyar & Trehan Reference Nayyar and Trehan1970; Takabe et al. Reference Takabe, Mima, Montierth and Morse1985; Mikhailenko, Mikhailenko & Weiland Reference Mikhailenko, Mikhailenko and Weiland2002; Ma et al. Reference Ma, Chen, Gan and Yu2006; Sen, Fukuyama & Honary Reference Sen, Fukuyama and Honary2010; Haines et al. Reference Haines, Vold, Molvig, Rauenzahn and Aldrich2014; Hoshoudy Reference Hoshoudy2014; Kessler, Dahlburg & Ganguli Reference Kessler, Dahlburg and Ganguli2014; Weber et al. Reference Weber, Clark, Cook, Busby and Robey2014; Khiar et al. Reference Khiar, Revet, Ciardi, Burdonov, Filippov, Béard, Cerchez, Chen, Gangolf and Makarov2019; Garai, Ghose-Choudhury & Guha Reference Garai, Ghose-Choudhury and Guha2020). This instability has been observed in diverse situations such as a supernova explosion (Norman et al. Reference Norman, Smarr, Smith and Wilson1981; Arnett et al. Reference Arnett, Bahcall, Kirshner and Woosley1989), geophysics (Plag & Jüttner Reference Plag and Jüttner1995), astrophysics (Allen & Hughes Reference Allen and Hughes1984; Zingale et al. Reference Zingale, Woosley, Rendleman, Day and Bell2005), atmospheric physics (Keskinen et al. Reference Keskinen, Szuszczewicz, Ossakow and Holmes1981), liquid atomization (Beale & Reitz Reference Beale and Reitz1999; Kong, Senecal & Reitz Reference Kong, Senecal and Reitz1999), fusion physics (Chertkov Reference Chertkov2003; Kadau et al. Reference Kadau, Germann, Hadjiconstantinou, Lomdahl, Dimonte, Holian and Alder2004; Hoshoudy Reference Hoshoudy2011; Srinivasan & Tang Reference Srinivasan and Tang2013), oceanography (Debnath Reference Debnath1994), turbulent mixing (Abarzhi Reference Abarzhi2010, Reference Abarzhi2008; Abarzhi & Rosner Reference Abarzhi and Rosner2010), etc. The basics and a comprehensive survey of research on RT instability has been provided by Zhou (Reference Zhou2017a,b). Another form of RT instability is the buoyancy-driven (BD) instability. The BD instability decides whether an object will float (if the density of an object is less than the background fluid) or sink (if the density of an object is greater than the background fluid) in fluid based on the direction of the buoyant force. A buoyant force acts in the direction opposite to gravity for low-density regions, and along with gravity for high-density regions. The floating of boats and ships while sinking small objects such as rocks in the water, or the pouring cream (heavy fluid) into coffee (light fluid), extraction of oils from petroleum wells, are some examples where buoyant force plays a major role.
Our objective here is to understand how strong coupling of a dusty plasma medium influences the growth of gravity-driven (GD) instabilities such as RT and BD. The inspiration features that convince us to choose dusty plasma as a medium of study are the following. The micron-size dust grains immersed in a plasma acquire high negative charge because the lighter plasma electrons stick to their surfaces. The high charge of the dust species ensures that the Coulomb coupling parameter of their interaction (viz. the ratio of interparticle Coulomb energy to the thermal kinetic energy) is pretty high for them to be in the strong coupling regime even at normal temperature and densities (Ikezi Reference Ikezi1986). Also, since the dust grains are pretty massive, the gravitational attraction of the Earth has a significant role in their dynamics. Thus, the strongly coupled dusty plasma (SCDP) can be an ideal test bed for understanding the role of strong coupling on the growth of GD instabilities. The SCDP medium has often been represented by a viscoelastic (VE) medium modelled by a generalized hydrodynamics (GHD) fluid description (Frenkel Reference Frenkel1955; Kaw & Sen Reference Kaw and Sen1998; Kaw Reference Kaw2001; Das & Kaw Reference Das and Kaw2014; Avinash & Sen Reference Avinash and Sen2015). Such a model supports both incompressible transverse shear (TS) and compressible longitudinal modes. We study the effect of the transverse modes on GD instabilities here. To avoid the possible coupling with the usual longitudinal mode, we consider the incompressible limit of the GHD equations. The RT instability for the VE fluids has also been observed within the framework of the Oldroyd-B model by Guido et al. (Reference Guido, Mazzino, Musacchio and Vozella2010). We wish to point out here that for low particle number density, the graininess of the medium would be important and fluid descriptions like GHD would be inapplicable. The fluid model focuses on a situation where the spatial scales in dusty plasmas are expected to be typically an order of magnitude larger than the interparticle distance.
In the present study, the conditions for RT instability have been introduced by considering two kinds of inhomogeneous density profiles. In the first configuration, we consider a sharp interface between two densities where the heavier fluid is placed above the lighter one. For the second, a choice of gradually increasing density against the gravity is chosen. The RT instability in the context of dusty plasma medium has been studied theoretically by many authors (d'Angelo Reference d'Angelo1993; Veeresha, Das & Sen Reference Veeresha, Das and Sen2005; Das & Kaw Reference Das and Kaw2014; Avinash & Sen Reference Avinash and Sen2015; Garai et al. Reference Garai, Banerjee, Janaki and Chakrabarti2015; Garai Reference Garai2016; Dolai & Prajapati Reference Dolai and Prajapati2018). The numerical work on this was reported by our group (Das, Dharodi & Tiwari Reference Das, Dharodi and Tiwari2014) and the experimental work by Pacha et al. (Reference Pacha, Heinrich, Kim and Merlino2012) and Pacha & Merlino (Reference Pacha and Merlino2020). The bubbles and droplets of BD configuration have attracted considerable interest. A recent numerical investigation on the formation and motion of bubbles or droplets in quiescent flows has been published by Zhang, Wu & Lin (Reference Zhang, Wu and Lin2020). In the present paper, the BD condition is incorporated by including a localized low-density region as a bubble, and a localized high-density region as a droplet rather than the background fluid density. Both the bubble and droplet have symmetry in their spatial distribution. We observe the process of a falling droplet is equivalent to a rising bubble. For both the RT and BD instabilities, the simulations show a gradual suppression of these instabilities with increasing coupling strength, which is consistent with the linear theory. To develop a better physical insight into the dynamics of each phenomenon, the inviscid limit of HD fluids is also shown for each case.
The paper has been organized as follows. Section 2 contains the governing equations of the GHD model for the VE medium in the presence of gravity. In §§ 2.1 and 2.2, we drive the analytical dispersion relations for the gradually and sharply increasing density gradients against gravitational force, respectively. These dispersion relations suggest the suppression of GD instability with increasing coupling strength. In § 3, we describe the results and observations. In order to carry out the numerical simulations, first, the model momentum equation has been reduced into coupled continuity equations. Then, we simulate these reduced equations for the RT and BD instabilities with different values of coupling parameters. Section 4 contains the discussion and conclusion.
2. Analytical description
The GHD fluid model is a phenomenological model that is used to study the SCDP system (Kaw & Sen Reference Kaw and Sen1998; Kaw Reference Kaw2001; Tiwari et al. Reference Tiwari, Das, Angom, Patel and Kaw2012; Dharodi, Tiwari & Das Reference Dharodi, Tiwari and Das2014; Tiwari et al. Reference Tiwari, Dharodi, Das, Patel and Kaw2014; Dharodi et al. Reference Dharodi, Das, Patel and Kaw2016). This model supports both the incompressible TS and compressible longitudinal modes (Kaw & Sen Reference Kaw and Sen1998; Kaw Reference Kaw2001). Here, we consider only the incompressible limit of the GHD and term it the i-GHD fluid model for which the set of equations is obtained. In the simplest formulation, the Poisson equation has been replaced by the quasi-neutrality condition. The charge on the dust grains is assumed to be constant. The coupled set of continuity, momentum and quasi-neutrality equations for the dust fluid under the acceleration due to gravity, $\boldsymbol {g}$ , can be written as


respectively, and the incompressible condition is given as

The number densities for dust, ions and electrons ${n}_s$ (s = e, i, d) are normalized by their respective equilibrium values $n_{s0}$
 . Here ${\rho _d}= {n_d}{m_d}$
 is the mass density of the dust fluid, $m_d$
 is the mass of the dust grain. The scalar potential $\phi _d$
 in the dusty plasma system is normalized by ${{K_B}{T_i}}/{e}$
 . The parameters $e$
 , $T_i$
 and $K_B$
 are the electronic charge, ion temperature and Boltzmann constant, respectively. The dust charge density is given by ${\rho _c}= {n_d}{Z_d}e$
 , where $Z_d$
 denotes the number of electronic charges residing on each dust grain. The charge fluctuation over each dust grain has been ignored. The time and length are normalized by the inverse of dust plasma frequency, $\omega ^{-1}_{pd}=({4{\rm \pi} (Z_de)^{2}n_{d0}}/{m_{d0}})^{-1/2}$
 and plasma Debye length $\lambda _{d}=({K_B T_i}/{4{{\rm \pi} } {Z_d}{n_{d0}}{e^2}})^{1/2}$
 , respectively. The dust fluid velocity $\boldsymbol {v}_d$
 is normalized by ${\lambda _d}{\omega _{pd}}$
 . Here ${\sigma _{ie}} = T_i/T_e$
 is the ratio of ion to electron temperature, ${\mu _e} = n_{e0}/{{Z_d}{{n_{d0}}}}$
 and ${\mu _i} = n_{i0}/{{Z_d}{n_{d0}}}$
 . Lastly $\eta$
 is the shear viscosity.
It should be noted that the momentum equations in the GHD description have a parameter $\tau _m$ which is the Maxwell relaxation parameter, denoting the memory effect of elastic fluids. For time scales which satisfy $\omega \tau _m\ll 1$
 the momentum (2.2) reduces to the standard fluid equation, ignoring ${\tau _m}({\partial }/{\partial {t}}+{\boldsymbol {v}_d}\boldsymbol {\cdot } \boldsymbol {\nabla })$
 in comparison to unity,

The dispersion relation with the implementation of above assumptions becomes

This denotes the usual viscous damping effect of any fluid system. For shorter time scales of $\omega \tau _m\gg 1$ , the strong coupling elastic effects dominate. Thus, higher value of $\tau _m$
 denotes that the system remains strongly coupled over long time scales. This can be observed as follows. Clearly, for GHD fluid the correlation between dust grains is introduced through the prefactor $[1+{\tau _m}({\partial }/{\partial {t}}+{\boldsymbol {v}_d}\boldsymbol {\cdot } \boldsymbol {\nabla })]$
 in momentum (2.2). In the strongly coupled limit, i.e. ${\tau _m}{\partial /{\partial {t}}}\gg 1$
 , if we take the curl of (2.2) and keep the linearized terms only, for constant dust density ($\rho _d=\rho _{d0}$
 ) and $g=0$
 , we get the following dispersion relation:

Here, angular frequency $\omega ={{k}}{v_p}$ and ${k}$
 is the wavenumber. This dispersion relation suggests that viscosity $\eta$
 in such a medium favours the TS wave for which the phase speed ${v_p}$
 is provided by $\sqrt {\eta /\tau _m}$
 . Thus, in the strongly coupled limit, viscosity behaves like a wave source or an energy storing parameter instead of dissipating mean. A medium with higher coupling strength (ratio $\eta /{\tau _m}$
 ) favours the faster TS waves (Dharodi et al. Reference Dharodi, Tiwari and Das2014, Reference Dharodi, Das, Patel and Kaw2016). For a given SCDP which has the fixed ratio $\eta /{\tau _m}$
 , $\tau _{m}$
 reduces the energy storing effect of viscosity.
2.1. Gradual density gradient
Here, we consider a two-dimensional (2-D) ($x$ –$y$
 plane) incompressible system where density and potential gradients are gradually increasing along the y-direction while a constant gravitational force acts in the opposite direction. We have assumed that the charge density of dusty plasma remains constant, i.e. ${\rho _c}={\rho _{c0}}$
 . In the laboratory dusty plasma experiments, the external electric field is used to levitate/equilibrate dust grains at a particular height against the gravitational pull of the earth. Mathematically, we obtain such a static equilibrium situation, with some assumptions such as $\boldsymbol v_{d0} =0$
 , i.e. no initial flow and ${\partial }/{\partial {t}} =0$
 , from the above (2.1), (2.2) and (2.4),

A small perturbation in the various fields, e.g. density, scalar potential and dust velocity, can be written as


respectively. Retaining only linear terms in the perturbed fields in (2.1), (2.2) and (2.4) we obtain the following equations for the linearized instability analysis:

${y}$ component

${x}$ component


Since equilibrium fields vary along ${y}$ , the above set of equations can only be Fourier analysed in time and spatial coordinate $x$
 . However, we assume the perturbations to be of much smaller scale compared with the equilibrium variation along $y$
 . So, here, we invoke the local approximation and proceed with the Fourier decomposition along y also along with $x$
 . For this decomposition, the perturbed quantities are considered proportional to $\exp (\textrm {i}{k_x}x+\textrm {i}{k_y}y-\textrm {i}{\omega }{t})$
 . This gives relations ${\partial }/{\partial {t}}={-\textrm {i}{\omega }}$
 , ${\partial }/{\partial {x}}= {\textrm {i}{k}_x}$
 and ${\partial }/{\partial {y}}={\textrm {i}{k}_y}$
 . Now, replacing the time and spatial derivatives of the perturbed quantities in (2.12), (2.13), (2.14) and (2.15) with the these relations, we get


Here, ${k}=({k_x}, {k_y})$ is the wavenumber associated with the perturbed quantities. Obtaining $\phi _{d1}$
 , using above relation and (2.16) (2.17) (2.18) and (2.19), we get

and using the above relation (2.20) in (2.18), we get the dispersion relation as

where kinematic viscosity $\eta ^*={\eta }/{\rho _{d0}}$ , the ratio of absolute viscosity ${\eta }$
 to density ${\rho _{d0}}$
 . A similar equation for the electron ion plasma in the context of inertial fusion has been predicted by Das & Kaw (Reference Das and Kaw2014). In the weak coupling limit, ${\omega }{\tau _m}\ll 1$
 , the instability growth rate shows a viscous damping due to the dust–dust collisions. In the strongly coupled limit, i.e. ${\omega }{\tau _m}\gg 1$
 , the above dispersion (2.21) becomes

Here, it should be noted that the analytical dispersion relation for dusty plasma medium has also been obtained by Avinash & Sen (Reference Avinash and Sen2015). However, we had presented this result earlier in 2014 in a conference (Dharodi & Das Reference Dharodi and Das2014).
2.2. Sharp interface
For a sharp density interface, the dispersion relation is obtained by replacing the gravity driven term $-({g/{\rho _{d0}}})({\partial {\rho _{d0}}}/{\partial {y}})({{{k^2_x}}/{{{k}}^2}})$ in (2.22) by $-g{{k}}{{A_T}}$
 (Avinash & Sen Reference Avinash and Sen2015),

where ${{A_T}}={(\rho _{d02}-\rho _{d01})}/{(\rho _{d01}+\rho _{d02})}$ is the Atwood number that represents the non-dimensional density difference between two adjacent fluids with a common interface. Here $\rho _{d02}$
 ($\rho _{d01}$
 ) is the density of the heavier (lighter) fluid.
In the right-hand side of (2.22) and (2.23), the second term assists the growth of GD instabilities which grow at the maximum rate in the inviscid limit ($\eta =0$ ) of the medium while the first shear wave term suppresses it. As our interest is in a condition for which a medium favours the GD instabilities, then for all the numerical simulations we have chosen the parametric values of all variables in such a way that the second term dominates over the first term, with a constant value of gravitational acceleration $g(= 10)$
 . While this condition is ensured, one has the freedom to choose different values of parameters, including the value of $g$
 , since the phenomenon of GD instability will take place but may be at different rates. Equations (2.22) and (2.23) with the assumption $g=0$
 become (2.7), which tell us that for the fixed ratio of ${\eta }/{\tau _m}$
 , the phase velocity of TS waves is inversely proportional to the square root of the density of the medium. Recently, Dharodi (Reference Dharodi2020) has shown numerically that in a two-fluid medium, TS waves travel slower in the denser side than in the lighter side. This difference in speeds induced a net flow of the medium towards the lighter side. In § 3.2, this numerical result will help us to understand the role of TS waves in initiating the RT instability for VE fluids.
3. Simulation results and discussion
We express the generalized momentum (2.2) in two coupled equations of the convective forms to apply the well known numerical technique for the convective equations.
3.1. Simulation methodology
For the purpose of numerical simulation the generalized momentum (2.2) has been expressed as the following set of two coupled convective equations:


For 2-D studies all the variables are functions of $x$ and $y$
 only, i.e. ${\boldsymbol {\psi }}(x,y)$
 , ${\boldsymbol v_d}(x,y)$
 , ${\rho _d}(x,y)$
 and $\boldsymbol {g}(y)$
 . From (3.1) it is clear that the quantity ${\boldsymbol {\psi }}(x,y)$
 is the strain created in the elastic medium by the time-varying velocity fields. We rewrite (3.1) using the equilibrium condition (2.8) in terms of the perturbed density relation (2.9):

Taking the curl of (3.3) and using the Boussinesq approximation, we get

Here, ${\xi _{z}}(x,y)=[{\boldsymbol {\nabla }} \times {\boldsymbol v_d}(x,y) ]_z$ is the $z$
 (and the only finite) component of vorticity for the 2-D case considered here. It is normalized by the dust plasma frequency. The acceleration $\boldsymbol g$
 is applied opposite to the fluid density gradient $-g\hat {y}$
 . The coupled set of model equations for numerical simulations are the following:


For the numerical simulations, we have used the LCPFCT method (Boris et al. Reference Boris, Landsberg, Oran and Gardner1993) to evolve the coupled set of (3.5), (3.6) and (3.7). This method is based on a finite difference scheme associated with the flux-corrected algorithm. The velocity at each time step is updated by using Poisson's equation ${{\nabla }^2}{\boldsymbol {v}_d}=-{{\boldsymbol {\nabla }}}\times {\boldsymbol {\xi }}$ , which has been solved using the FISPACK package (Swarztrauber, Sweet & Adams Reference Swarztrauber, Sweet and Adams1999). Here, it should be noted that the equations for simulations have been derived under the Boussinesq approximation, which was not assumed in the above analytical derived dispersion relations ((2.22) and (2.23)). So, our numerical simulations are used to show the same trend of GD instabilities growth as expected analytically instead of quantitative matching. Throughout simulation studies, boundary conditions are periodic in the horizontal direction ($x$
 -axis) while non-periodic along the vertical ($y$
 -axis) direction where the effects of perturbed quantities die out before hitting the boundary of the simulation box. Moreover, we have stopped all simulations for both directions before hitting the boundaries. In each case, the grid convergence study has been carried out first to make sure of grid independence of the numerical results and to avoid the simulation resolution issue.
In the interest of observing the pure viscous damping effect on the growth of instabilities, we have also simulated the cases of pure viscous HD fluids with the value of $\tau _m=0$ . For such cases (3.6) has a singularity. To avoid such a singularity, we put ${\tau _m}=0$
 into the generalized momentum (2.2) and we obtain the standard HD equation (2.5). Take the curl of (2.5), under the same above considered conditions and assumptions, we get the HD vorticity equation,

Thus, numerically, for pure HD cases ($\tau _m=0$ ) we solve the set of (3.5) and (3.8) where dust fluid velocity at each time step is updated by using ${{\nabla }^2}{\boldsymbol {v}_d}=-{{\boldsymbol {\nabla }}}\times {\boldsymbol {\xi }}$
 . Since we have simulated the normalized equations, so in all figures the numbers in colour bars correspond to the normalized value of that plotted physical quantity.
3.2. RT instability
We consider two types of inhomogeneous density profiles, namely case A with a sharp interface between two different densities where heavier fluid $\rho _{d02}$ (upper) is supported by lighter one $\rho _{d01}$
 (lower) as shown in figure 1(a), and case B with gradually increasing density gradient along the $y$
 -axis is given by (3.10) that is shown in figure 1(b). For both profiles, numerical simulations are performed with $512\times 512$
 grid points in both the $x$
 and $y$
 directions on a simulation region in the $x$
 –$y$
 plane defined by $-{{\rm \pi} } < x < {{\rm \pi} }$
 , $-{{\rm \pi} } < y < {{\rm \pi} }$
 . Thus, we have a system of the length of $lx=ly=2{{\rm \pi} }$
 units. The mathematical formalism of the initial equilibrium condition can be understood through the relation (2.8), a sufficient electric field has been applied against the gravity to levitate the dust grains.
Initial density profiles at $t=0$ to study the RT instability. The patches along the $x$
 direction at the centre of vertical axis represent the imposed sinusoidal perturbation which is given by (3.9) to hasten the instability. (a) Sharp density interface profile and (b) gradually increasing density gradient along the $y$
 direction, or say against the gravity; where $\boldsymbol {H}$
 stands for heavy density and $\boldsymbol {L}$
 for the lighter one.

3.3. Sharp interface
For case A (figure 1a), we consider a system which consists of two incompressible fluids of constant densities $\rho _{d01}=1$ for $-{{\rm \pi} }\leq y \leq 0$
 (lower half) and $\rho _{d02}=2$
 for $0=y \leq {{\rm \pi} }$
 (upper half), i.e. the denser fluid of density $\rho _{d02}$
 is positioned above the lighter fluid $\rho _{d01}$
 . This is a very commonly used density profile to study RT instability; a few references are Waddell et al. (Reference Waddell, Niederhaus and Jacobs2001), Bell et al. (Reference Bell, Day, Rendleman, Woosley and Zingale2004), Avinash & Sen (Reference Avinash and Sen2015), Hosseini et al. (Reference Hosseini, Turek, Möller and Palmes2017) and Liang et al. (Reference Liang, Hu, Huang and Xu2019). In the absence of gravity, this system will remain stable. To hasten the evolution of our stable system under gravity, we impose a small amplitude ${\bar {\rho }_{d1}}$
 sinusoidal perturbation (Tiwari et al. Reference Tiwari, Das, Angom, Patel and Kaw2012) on the density profile at the interface ($y=0$
 ), i.e.

Here, the Gaussian function $\exp (-y^2/{\sigma ^2})$ controls the width of perturbation at the interface $y=0$
 along the $y$
 -axis through the parameter $\sigma$
 , the larger the value of $\sigma$
 the greater the width of the perturbation; $\sigma$
 is supposed to be ${\ll }l_y/2$
 , half of the box size. We have chosen $\sigma =0.1$
 , the maximum amplitude of perturbation ${\bar {\rho }_{d1}}=0.01$
 , and the longest possible single mode ${{k}}_x=1$
 along the $x$
 direction (${{k}}_x=N({2{\rm \pi} }/{lx})$
 , the positive integer $N$
 represents the number of the modes, here, $N=1$
 ). The total density is $\rho _d=\rho _{d0s}+\rho _{d1}$
 , where the suffix $s$
 corresponds to $1$
 and $2$
 , which are labelled for the low and high density dust fluid, respectively.
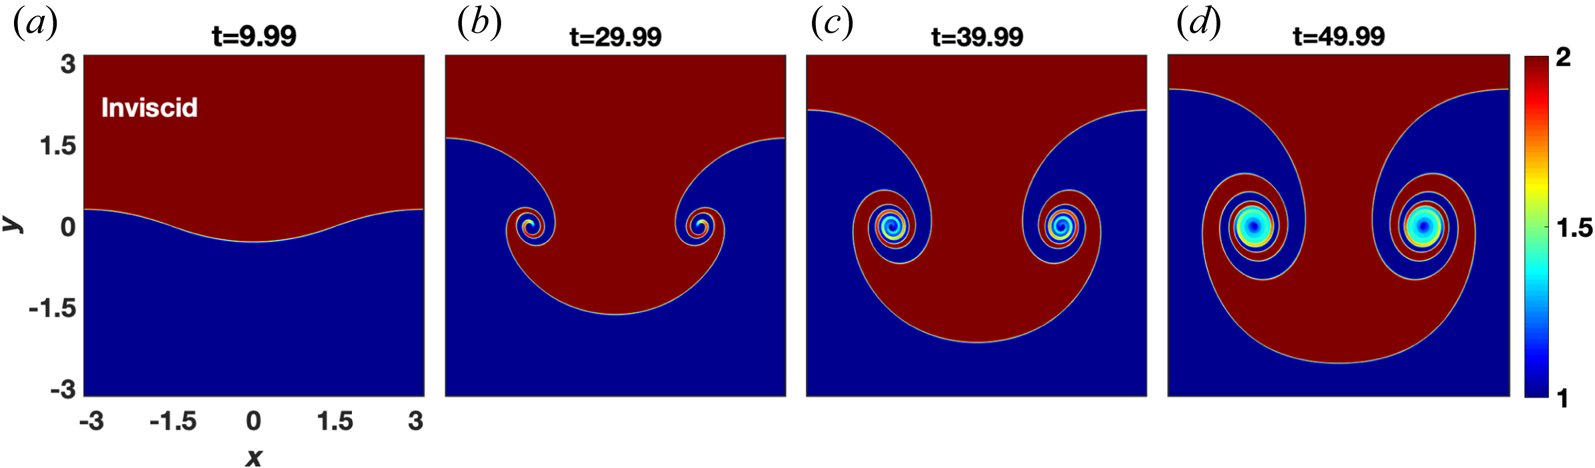
The evolution of the RT instability is reproduced for the inviscid HD fluid from our code (see figure 2). The initial perturbation was given at ${{k}}_x=1$ , which is observed. The heavy fluid is observed to penetrate into the lighter fluid and the lighter fluid rises above into the domain of the heavy fluid. Subsequently, the falling heavy fluid develops rolls at the edges acquiring a mushroom-like profile. These rolls grow up with time as the heavy fluid keeps falling with time. Such an evolution of RT instability is a well known result of HD fluid (Hosseini et al. Reference Hosseini, Turek, Möller and Palmes2017; Talat et al. Reference Talat, Mavrič, Hatić, Bajt and Šarler2018), thereby substantiating our numerical simulation.
Time evolution of RT instability for inviscid HD fluid at the sharp interface of two different densities. The heavy fluid (upper half) penetrates into the lighter fluid (lower half) and the lighter fluid rises above into the domain of heavy fluid. Subsequently, the relative flow of two adjacent fluids starts rolling which causes the formation of vortex-like structures at the interface. The final structure acquires a mushroom-like profile.

In order to notice the pure viscous damping effect of viscosity on the growth of the RT instability, we have also simulated a pure viscous HD fluid (see the density evolution in figure 3 for $\eta = 0.1$ , $\tau _m=0$
 ) by using (3.5) and (3.8). In the viscous fluid (figure 3) the penetration of heavy fluid into the lighter fluid is much slower than with inviscid fluid (figure 2) that results in no rolls at the interface even at almost double the time step of the inviscid case. Next, this viscous fluid (figure 3) has been compared with a VE fluid, shown in figure 4(a–d), which has the same viscosity $\eta =0.1$
 but a finite value of $\tau _m =20$
 . We have discussed that in VE fluids $\eta$
 in the presence of $\tau _m$
 assists the TS waves which travel slower in the denser fluid than in the lighter. In our two fluid case, the lighter fluid is on the lower side while the denser fluid is on the upper, which means the difference in speeds of these waves should favour the net flow of fluid in the downward direction. This observation can be clearly seen from the comparison of two mediums where the piercing of heavy fluid into the lighter fluid is faster in a VE fluid (figure 4a–d) than a pure viscous fluid (figure 3). Hence, in the present scenario, the RT instability grows faster in a VE fluid in comparison with a viscous fluid. Moreover, this comparison shows that the instability grows phenomenologically similar in both fluids as observed in the dusty plasma experiment by Pacha et al. (Reference Pacha, Heinrich, Kim and Merlino2012).
Time evolution of RT instability for pure viscous HD fluid ($\eta = 0.1$ ; $\tau _m=0$
 ) at the sharp interface of two different densities. Here, due to the viscous damping force, the RT instability grows at a considerably slower pace compared with the inviscid HD fluid (see figure 2). Numerically, the set of (3.5) and (3.8) has been solved to avoid the singularity in generalized momentum (2.2) due to ${\tau _m}=0$
 .

The growth of RT instability at the sharp interface of two VE fluids of different densities: (a–d) $\eta =0.1$ , $\tau _m=20$
 ; (e–h) $\eta =0.1$
 , $\tau _m=5$
 . The RT instability gets weaker with increasing ratio ${\eta }/{\tau _m}$
 as expected analytically from (2.23). This can be noticed by the comparison of panels (a–d) and (e–h), enlargement in width of the neck region (as indicated by double sided arrow) and reduction in fluid flow in the downward direction at each time step.

Contour plots in figure 4 show that the growth rate of RT instability get suppressed with increasing coupling strength (ratio $\eta$ /$\tau _m$
 ) of the medium. The evolution of RT instability or the downward fluid flow under an applied gravitational force causes the appearance of free energy in the medium. This free energy release in the form of TS waves which travel with velocity $\sqrt {\eta /\tau _m}$
 in the perpendicular direction to the evolution of the instability that, in turn, slow down the fluid flow. These transverse effects get stronger with an increase of the ratio $\eta /\tau _m$
 that can be noticed by the comparison of figures 4(a–d) and 4(e–h), enlargement in width of the neck region (as indicated by double sided arrow) and reduction in fluid flow in the downward direction at each time step. Furthermore, the comparative evolution of density in figures 3, 4(a–d) and 4(e–h) shows that the appearance of $\tau _m$
 speed up the growth of RT instability ($\eta =0.1$
 is same for all the three cases). Both the above observations favour the analytical expected result from (2.23).
3.4. Gradual variation of density profile
Next, the density of the dust fluid is stratified against gravity and has a gradually changing profile as shown in figure 1(b). We assume that the density has an exponential shape in $y$ (such a profile has been discussed in chapter 19 in Goldston (Reference Goldston2020)), i.e.

Here, $\rho _{d0}$ is constant background density and ${\bar {\rho }_{d0}}$
 is the amplitude of inhomogeneity. The parameter $\epsilon$
 decides the ramp of inhomogeneity in background density. The values of parameters taken for the present case are $\rho _{d0}=5$
 , ${\bar {\rho }_{d0}}=0.1$
 and $\epsilon =0.025$
 . The sinusoidal perturbation $\rho _{d1}$
 (see (3.9) with ${{\bar {\rho }_{d1}}}=0.01$
 , $\sigma =0.1$
 and ${{k}}_x=1$
 ) is imposed at $y = 0$
 , which can be clearly seen in figure 1(b).
In figure 5, we have compared two different VE fluids with the same $\eta$ , (${\eta }=0.1, {\tau _m}=20, {\eta }/{\tau _m}=0.005$
 for figure 5a–d; ${\eta }=0.1, {\tau _m}=5, {\eta }/{\tau _m}=0.02$
 for figure 5e–h). From the comparison of figure 5(a–d) and figure 5(e–h), it is clear that at each time step, the growth of RT instability gets weaker with increasing coupling strength, while ${\tau _m}$
 speeds up it as suggested by (2.22); similar observations have been made for the sharp density gradient profiles.
The time evolution of RT instability for two VE fluids having gradually increasing densities against the gravity. (a–d) The VE fluid with $\eta =0.1$ , $\tau _m=20$
 and (e–h) VE fluid with $\eta =0.1$
 , $\tau _m=5$
 . The RT instability gets weaker with increasing coupling strength, i.e. ${\eta }/{\tau _m}$
 as analytically suggested by (2.22).

3.5. BD evolution
We consider the two types of density inhomogeneity profiles, namely case A an initially static and circular bubble whose density is less than that of the surrounding quiescent HD/VE fluid as shown in figure 6(a), and case B initially static and a circular droplet whose density is higher than that of the surrounding medium as shown in figure 6(b). In order to avoid the confusion between the evolution of density and evolution of vorticity, we have discussed density evolution in terms of blob/blobs while vorticity evolution in terms of lobe/lobes. For both cases, we have considered a system of length $lx=ly=12{{\rm \pi} }$ units with $512\times 512$
 grid points in both the $x$
 and $y$
 directions. The total density is $\rho _d=\rho _{d0}+\rho _{d1}$
 , where ${\rho _{d0}}$
 is the background density and the inhomogeneous Gaussian density $\rho _{d1}$
 of rising bubble or falling droplet centred at $({x_{c}},{y_{c}})$
 , with radius ${a_{c}}$
 is

Here $a_c$ is equal for both blobs. The parameter ${\bar {\rho }_{d1}}$
 has a negative value for the bubble while a positive value of equal magnitude for droplet. Thus, in both cases the variation in density is symmetric about an axis that is perpendicular to the simulation plane.
Initial densities’ profiles at time $t=0$ . (a) Bubble of less density inside the heavier fluid and (b) droplet of high density inside the lighter fluid. In the colour bar, letter $\boldsymbol {{H}}$
 is the heavy density region and $\boldsymbol {L}$
 stands for the lighter density region.

Before running codes and reporting simulation results merely based on the interpretations of contour plots, let us discuss the equations of the model to develop some simple qualitative understanding of simulations results. For an inviscid flow, the vorticity (3.4), (3.7), (3.8) in HD limit, becomes

This equation tells that as the simulation begins, the influence of gravity induces a dipolar vorticity. The dipolar vorticity, $-{({g}/{\rho _{d0}})}{({\partial {\rho _{d1}}}/{\partial x})}={({2g}/{\rho _{d0}})}{(x-x_{c})}{\rho _{d1}}$ , acts as a buoyant force on droplet, while dipolar vorticity, $-{({g}/{\rho _{d0}})}{({\partial {\rho _{d1}}}/{\partial x})}=-{({2g}/{\rho _{d0}})}{(x-x_{c})}{\rho _{d1}}$
 acts as a buoyant force on bubble. Both these are oppositely propagating dipolar vorticities and each have a pair of counter-rotating lobes (or a pair of unlike-sign lobes). The resultant of a counter-rotating lobe pair related to the bubble causes vertical upward motion, and vertical downward motion for the droplet (Horstmann et al. Reference Horstmann, Henningsson, Thomas and Bomphrey2014). It can be visualized through the schematic diagram of vorticity in figure 7, corresponding to the bubble/droplet density in figure 6. The curved solid arrows over the lobes represent the direction of rotation of lobes, while the net propagation is indicated by vertical dotted arrows.
Schematic vorticity diagram (a pair of counter-rotating lobes, the rotational direction of each lobe is shown by a curved arrow) corresponding to figure 6. (a) Dipolar vorticity due to the buoyant force on a bubble (figure 6a). The net rotation causes the motion in the vertical upward direction, indicated by the vertical upward dotted arrow. Similarly, vorticity in panel (b) with respect to figure 6(b) causes the net downward flow for the droplet.

The right-hand side of vorticity (3.4), (3.7) for VE fluids in addition to the gravity term includes ${\boldsymbol {\nabla }}\times {({\boldsymbol {\psi }}/{\rho _d})}$ . This term incorporates the TS waves. In our previous work (Dharodi et al. Reference Dharodi, Tiwari and Das2014, Reference Dharodi, Das, Patel and Kaw2016), in absence of a gravity term, we observed such waves emerging from the rotating vorticity lobes into the medium.
3.6. Rising bubble
In order to simulate the case of a rising bubble, the numerical simulations have been carried out for ${a_c}=2.0$ , ${\bar {\rho }_{d1}}=-0.5$
 , ${x_{c}}=0$
 and ${y_{c}}=-4{\rm \pi}$
 in (3.11). The homogeneous background density ${\rho _{d0}}=5$
 . Figure 8 displays the time evolution of the bubble density profile of an inviscid fluid. Initially, at time $t=0$
 , the bubble is axisymmetric (see figure 6a) and as the system evolves the bubble simply rises without any significant change in shape for a short period of time. At a later stage, the initially circular profile assumes a crescent shape, as evident from the first panel. Further, as time progresses, a mushroom-like structure that is characteristic of RT instability begins to appear along with rolling and mixing at the edge of the bubble. This mushroom-like structure then breaks into two distinct elliptical blobs as evident from the figure. These blobs propagate forward as a single entity leaving behind the wake-like structure in background fluid.
Time evolution of bubble density (see figure 11 for the respective vorticity) profile for inviscid HD fluid.

Next, with the understanding of bubble evolution for inviscid fluids, the time evolution of bubble for VE fluids has been performed. To envisage the effect of coupling strength, we compare one VE fluid (figure 9a–d) having ${\eta }=2.5, {\tau _m}=20$ , i.e. $\eta /\tau _m=0.125$
 with another VE fluid (figure 9e–h) having higher coupling strength, i.e. ${\eta }=5$
 , ${\tau _m}=10$
 , $\eta /\tau _m=0.5$
 . We observe a decrease in the vertical upward motion of the bubble and larger separation between elliptical blobs in the horizontal direction earlier in figure 9(e–h) than in figure 9(a–d). At the same time, the rolling rate of blobs increases causing the expansion of blobs and the disappearance of the dragging tail. Thus, we conclude that similar to the RT instability, the growth of the bubble (vertical upward motion) gets reduced with increasing coupling strength. The cause of this reducing effect can be easily understood through the respective vorticity evolution given in figure 10. In figure 10, the vorticity plots in panels (a–d) and (e–h) correspond to the density profiles shown in figures 9(a–d) and 9(e–h), respectively.
Evolution of bubble density profile (see figure 10 for the respective vorticity evolution) in time for two VE fluids: (a–d) $\eta =2.5$ , $\tau _m=20$
 (see supplemental material, https://doi.org/10.1017/S0022377821000349) and (e–h) $\eta =5$
 , $\tau _m=10$
 . The growth of the bubble (vertical upward motion) gets reduced with increasing coupling strength.

Time evolution of bubble vorticity profile (see figure 9 for the respective density evolution) for two VE fluids: (a–d) $\eta =2.5$ , $\tau _m=20$
 (see supplemental material) and (e–h) $\eta =5$
 , $\tau _m=10$
 . There is emission of a TS wave surrounding the vorticity lobes whose phase velocity is proportional to the coupling strength. It is clear that the increase of phase velocity of TS waves with coupling strength suppresses the BD instability (i.e. reduction in vertical upward motion of lobes).

It is evident from figure 10 that there is emission of TS waves surrounding the vorticity lobes for VE fluids. The emission of waves from either lobe pushes the other lobe in the direction perpendicular to the direction of propagation of the entire structure and as a result the lobes get well separated with time and proportional to the coupling strength (a detailed discussion on the evolution of such dipolar vorticity structures in VE fluids is given by Dharodi et al. (Reference Dharodi, Das, Patel and Kaw2016)). Besides this lobe separation, the emission of TS waves notably reduced the strength of the dipole thereby delaying the dipole propagation and this reduction in dipole propagation is also proportional to the coupling strength. The relative observations of figure 10(a–d) and figure 10(e–h) clearly reflect it through the TS enclosure which is larger for the $\eta =5$ , $\tau _m=10$
 than $\eta =2.5$
 , $\tau _m=20$
 . This reduction in vertical propagation direction and enhancement in horizontal separation between lobes/blobs with increasing coupling strength means the suppression of the buoyant nature of a bubble is proportional to the coupling strength of the medium. There is no such TS waves surrounding the vorticity for inviscid HD fluid (figure 11).
Evolution of bubble vorticity profile in time for inviscid HD fluid (see figure 8 for the respective density).

To substantiate our observations made so far, four snapshots of density and vorticity evolution of bubble at the same time step $({\approx }20)$ for four different combinations of $\eta$
 and $\tau _m$
 are shown in figures 12 and figure 13, respectively. From figure 12, it is clear that the BD instability gets weaker with increasing $\eta$
 (in the vertical direction with a fixed value of $\tau _m$
 ), while $\tau _m$
 speed up the instability (along the horizontal direction with a fixed value of $\eta$
 ). Snapshots also show that the instability evolution is similar for the same ratio ${\eta /\tau _m}$
 . The role of TS waves can be visualized from the vorticity snapshots given in figure 13.
Plots of $\eta$ versus $\tau _m$
 . The snapshots of bubble density profiles at a particular time step (see figure 13 for the respective vorticity). The BD instability gets weaker with increasing $\eta$
 (in the vertical direction with a fixed value of $\tau _m$
 ) and $\tau _m$
 speeds up the instability (along the horizontal direction with a fixed value of $\eta$
 ).

Plots of $\eta$ vs $\tau _m$
 . The snapshots of bubble vorticity profiles at a particular time step (see figure 12 for the respective density). The BD instability gets weaker with increasing viscosity (in the vertical direction with a fixed value of $\tau _m$
 ) and $\tau _m$
 speeds up the instability (along the horizontal direction with a fixed value of $\eta$
 ).

3.7. Falling droplet
For simulating the falling droplet, i.e. case B (figure 6b), the values of parameters in (3.11) for the droplet density profile are ${a_c}=2.0$ , ${\bar {\rho }_{d1}}=0.5$
 , ${x_{c}}=0$
 , ${y_{c}}=4{\rm \pi}$
 and ${\rho _{d0}}=5$
 . The total density is $\rho _d=\rho _{d0}+\rho _{d1}$
 . Figure 14 shows the dynamics of a falling droplet in tranquil inviscid HD fluid. As the simulation begins, under the influence of gravity, the suspended drop starts to fall. As time passes, the drop breaks up forming first a semicircular structure then two blobs similar to the case of bubble. Figure 15 reveals the different stages of droplet for VE fluids. As done for the rising bubble, we shall now compare figure 15(a–d) having ${\eta }=2.5, {\tau _m}=20$
 , i.e. $\eta /\tau _m=0.35$
 with figure 15(e–h) having ${\eta }=5, {\tau _m}=10$
 , i.e. $\eta /\tau _m=0.5$
 . For a higher coupling strength shown in figure 15(e–h), the downward motion is slower. The transverse dimension is even larger, and the dragging tail does not seem to appear at all. Again, similar to the case of bubbles, the vorticity plots are provided for observing a clear role of TS waves, i.e. pushing the two lobes apart, as seen in figure 16. For the inviscid HD fluid, the corresponding vorticity subplots (figure 17) to the mentioned density profile (figure 14), no such wave are observed which could constraint the vertical downward motion. Thus, we conclude that the increasing ratio $\eta /\tau _{m}$
 suppresses the buoyant nature of a droplet.
Time evolution of droplet density (see figure 17 for the respective vorticity evolution) profile for inviscid HD fluid.

Evolution of droplet density profile (see figure 16 for the respective vorticity evolution) in time for two VE fluids: (a–d) $\eta =2.5$ , $\tau _m=20$
 (see supplemental material) and (e–h) $\eta =5$
 , $\tau _m=10$
 . The growth of the droplet (vertical downward motion) gets reduced with increasing coupling strength.

Time evolution of droplet vorticity profile (see figure 15 for the respective density evolution) for two VE fluids: (a–d) $\eta =2.5$ , $\tau _m=20$
 (see supplemental material) and (e–h) $\eta =5$
 , $\tau _m=10$
 . There is emission of a TS wave surrounding the vorticity lobes whose phase velocity is proportional to the coupling strength. It is clear that the increase of phase velocity of TS waves with coupling strength suppresses the BD instability (i.e. reduction in vertical downward motion of lobes).

Time evolution of droplet vorticity (see figure 14 for the respective density evolution) profile for inviscid HD fluid.

In the same way as the bubble evolution, figures 18 and figure 19 show the snapshots of droplet density and vorticity evolution at a time step=$({\approx }20)$ , respectively. Here, also, from figure 18, it is clear that the BD instability gets weaker with increasing $\eta$
 , while $\tau _m$
 speed up the instability. Snapshots, also, show that the instability evolution is similar for the same ratio ${\eta /\tau _m}$
 . The role of TS waves can be visualized from the vorticity snapshots given in figure 19.
Plots of $\eta$ vs $\tau _m$
 . The snapshots of droplet density profiles at a particular time step (see figure 19 for the respective vorticity). The BD instability gets weaker with increasing viscosity (in the vertical direction with a fixed value of $\tau _m$
 ) and $\tau _m$
 speeds up the instability (along the horizontal direction with a fixed value of $\eta$
 ).

Plots of $\eta$ vs $\tau _m$
 . The snapshots of droplet vorticity profiles at a particular time step (see figure 18 for the respective density). The BD instability gets weaker with increasing viscosity (in the vertical direction with a fixed value of $\tau _m$
 ) and $\tau _m$
 speeds up the instability (along the horizontal direction with a fixed value of $\eta$
 ).

4. Observations and conclusion
We present a detailed discussion on the evolution of RT and BD instabilities in 2-D SCDPs in the presence of gravity. Below the crystallization limit, an SCDP behaves like a VE fluid which favours both the incompressible TS and compressible longitudinal modes. To study the effect transverse modes on the growth of these instabilities and to avoid the possible coupling with the longitudinal mode, we consider the incompressible limit of the SCDP in the framework of GHD fluid model. The RT instability is explored through the gradually and sharply increasing density gradients against the gravitational force. For the BD evolution, we consider a spatially localized high/low (droplet/bubble) density region placed in a constant background density medium. Some main observations are as follows.
(i) The RT instability in the dust fluid is phenomenologically similar to the HD case as observed in the dusty plasma experiment by Pacha et al. (Reference Pacha, Heinrich, Kim and Merlino2012).
(ii) The spatiotemporal evolution of vortices/instabilities depends on ratio $\eta /{\tau _m}$
 .
(iii) Since both the bubble and the droplet have symmetric variation in density, so the falling droplet process is found equivalent to the rising bubble.
(iv) Our studies, analytical as well as numerical simulations, show that both the instabilities get suppressed with increasing coupling strength of the medium.

With the understanding of individual evolution of a bubble and a droplet, Part 2 of this paper is designated to extend the present study to their combined evolution in order to understand the interactions between them. Understanding the dynamic interaction between the bubbles and droplets is important for a wide range of applications, including oil recovery (Zhao et al. Reference Zhao, Boufadel, King, Robinson, Gao, Socolofsky and Lee2017), printing and deinking, emulsion stability (Xie et al. Reference Xie, Shi, Cui and Zeng2017), foodstuffs such as ice cream and mousse (Van Aken Reference Van Aken2001) and in mineral flotation (Liu et al. Reference Liu, Mak, Zhou and Xu2002; Niewiadomski et al. Reference Niewiadomski, Nguyen, Hupka, Nalaskowski and Miller2007), among many other applications.
Supplementary material and movies
Supplementary material and movies are available at https://doi.org/10.1017/S0022377821000349 for a visualization that accompanies the static images shown in few figures.
Acknowledgements
This research received no specific grant from any funding agency, commercial or not-for-profit sectors.
Editor E. Thomas, Jr. thanks the referees for their advice in evaluating this article.
Declaration of interests
The authors report no conflict of interest.