1 Introduction
The Rayleigh–Taylor instability (RTI) (Rayleigh Reference Rayleigh1882; Taylor Reference Taylor1950; Chandrasekhar Reference Chandrasekhar1961), an important hydrodynamic instability, occurs at the unstable interface when a high density fluid is supported by a lower density fluid under the influence of gravity, or when the interface between two fluids with different densities is accelerated. This instability is ubiquitous in nature and plays an important role in diverse areas of science and technology, including inertial confinement fusion (ICF) (Tabak, Munro & Lindl Reference Tabak, Munro and Lindl1990; Betti et al. Reference Betti, Goncharov, McCrory and Verdon1998; Remington, Drake & Ryutov Reference Remington, Drake and Ryutov2006; Stone & Gardiner Reference Stone and Gardiner2007; Srinivasan & Tang Reference Srinivasan and Tang2012; Srinivasan, Dimonte & Tang Reference Srinivasan, Dimonte and Tang2012; Srinivasan & Tang Reference Srinivasan and Tang2014b,Reference Srinivasan and Tanga; Srinivasan et al. Reference Srinivasan, Cagas, Masti, Rathod and Song2017; Wang et al. Reference Wang, Ye, He, Wu, Fan, Xue, Guo, Miao, Yuan and Dong2017; Srinivasan et al. Reference Srinivasan, Cagas, Masti, Rathod, Shetty and Song2019; Zhou et al. Reference Zhou, Clark, Clark, Gail Glendinning, Aaron Skinner, Huntington, Hurricane, Dimits and Remington2019), astrophysics (Gamezo et al. Reference Gamezo, Khokhlov, Oran, Chtchelkanova and Rosenberg2003; Kifonidis et al. Reference Kifonidis, Plewa, Janka and Müller2003; Hwang et al. Reference Hwang, Laming, Badenes, Berendse, Blondin, Cioffi, DeLaney, Dewey, Fesen and Flanagan2004; Hester Reference Hester2008; Loll et al. Reference Loll, Desch, Scowen and Foy2013), geophysics (Kaus & Becker Reference Kaus and Becker2007) and engineering processes (Lyubimova, Vorobev & Prokopev Reference Lyubimova, Vorobev and Prokopev2019). For instance, the RTI is known to act as an inhibitor in achieving an ignition grade hot spot in ICF targets (Srinivasan & Tang Reference Srinivasan and Tang2012; Srinivasan et al. Reference Srinivasan, Dimonte and Tang2012, Reference Srinivasan, Cagas, Masti, Rathod, Shetty and Song2019; Srinivasan & Tang Reference Srinivasan and Tang2014b, Reference Srinivasan and Tanga; Zhou Reference Zhou2017a, Reference Zhoub). RTI occurs in ICF targets during both the acceleration and deceleration phases of the implosion, leading to undesirable mixing of hot and cold plasmas. The RTI is also observed in various astrophysical phenomena such as supernova explosions and their remnants (Crab Nebula) (Gamezo et al. Reference Gamezo, Khokhlov, Oran, Chtchelkanova and Rosenberg2003; Kifonidis et al. Reference Kifonidis, Plewa, Janka and Müller2003; Hwang et al. Reference Hwang, Laming, Badenes, Berendse, Blondin, Cioffi, DeLaney, Dewey, Fesen and Flanagan2004; Hester Reference Hester2008; Loll et al. Reference Loll, Desch, Scowen and Foy2013). Therefore, a detailed understanding of such instabilities in high-energy-density (HED) plasmas has implications for ignition-grade hot spots, understanding supernova explosions and revealing mega-Gauss-scale magnetic field generation and its turbulence in astrophysical settings. The RTI and their mitigation mechanism in HED plasmas has been thoroughly studied by several authors experimentally as well as theoretically and numerically (Atzeni & Meyer-ter Vehn Reference Atzeni and Meyer-ter Vehn2004; Remington et al. Reference Remington, Drake and Ryutov2006; Srinivasan & Tang Reference Srinivasan and Tang2012; Srinivasan et al. Reference Srinivasan, Dimonte and Tang2012, Reference Srinivasan, Cagas, Masti, Rathod, Shetty and Song2019; Srinivasan & Tang Reference Srinivasan and Tang2014b, Reference Srinivasan and Tanga; Sun, Gou & Wang Reference Sun, Gou and Wang2021; Silveira & Orlandi Reference Silveira and Orlandi2017). However, there exists a substantial disagreement between computer simulation results and HED laboratory experiments and astrophysical observations of the RTI (Kuranz et al. Reference Kuranz, Drake, Grosskopf, Fryxell, Budde, Hansen, Miles, Plewa, Hearn and Knauer2010; Modica, Plewa & Zhiglo Reference Modica, Plewa and Zhiglo2013). Most of the experiments and astrophysical observations have noted an unusual morphological structure of RTI which is significantly different from the computer simulation results, exhibiting strongly suppressed growth of small-scale structures and mass extensions of RT spikes. This is due to the fact that many theoretical and numerical studies use the conventional hydrodynamic and magnetohydrodynamic (MHD) depiction where either the self-consistent effects of magnetic fields, viscosity and resistivity have been ignored or they have been considered in isolation. First observations of magneto-RTI evolution in the presence of magnetic and viscous effects have been made in recent experiments (Adams, Moser & Hsu Reference Adams, Moser and Hsu2015). The impact of magnetic fields on RTI in the presence of a self-consistent viscosity and resistivity for experimentally and observationally relevant parameter regimes in HED plasmas remains an open area of research.
The primary purpose of this paper is, therefore, to understand the role of the viscous and resistive effects on RTI in magnetized HED plasmas applicable to astrophysical plasmas as well as ICF-based laboratory experiments. Specifically, this work aims to understand how RTI dynamics is impacted by varying plasma beta (ratio of thermal energy to magnetic energy) and magnetic Prandtl number (ratio of magnetic Reynolds number to Reynolds number). This study focuses on a high Atwood number and high-$\beta$ regime, where the energy density in the magnetic field is small compared with the thermal energy in the fluid. The Atwood number ($A_t$
 ) is a dimensionless number defined as, $A_t = (\rho _H -\rho _L)/(\rho _H + \rho _L)$
 ; where $\rho _H$
 and $\rho _L$
 represent the mass density of the heavy and light fluid, respectively. This distinguishes the current work from previous works that have examined the role of viscosity and resistivity in isolation for ICF applications (Srinivasan & Tang Reference Srinivasan and Tang2014a; Song & Srinivasan Reference Song and Srinivasan2020). In addition, this work also presents the evolution of RTI considering fully varying self-consistent viscosity and resistivity profiles. To study the RTI dynamics in HED plasmas, the MHD equations with the inclusion of viscosity and resistivity are solved in this work. These visco-resistive MHD equations are solved in conservation form in two dimensions using the fluid modelling tool PHORCE (Package of High ORder simulations of Convection diffusion Equations) based on the unstructured discontinuous Galerkin finite element method (Hesthaven & Warburton Reference Hesthaven and Warburton2007; Song Reference Song2020; Song & Srinivasan Reference Song and Srinivasan2021). Under this configuration, simulations have been performed over a wide range of magnetic Prandtl numbers with the presence of a longitudinal external magnetic field to reveal the effect of viscosity and resistivity on the evolution of RTI and magneto-RTI in HED plasmas. It is observed that the inclusion of viscosity and resistivity dramatically changes the growth as well as the structures/morphology of the instability on different length scales. It is seen here that the presence of viscosity stabilizes the growth of the RTI and modifies the morphology of the tip of RTI fingers, inhibiting the traditional mushroom cap structures. On the other hand, the morphology of the RTI spikes is found to be independent of resistivity. The presence of resistivity assists in the development of small-scale structures by reducing the magnetic field stabilization. When considering spatially varying viscosity and resistivity with highly disparate profiles, there is a significant impact on the RTI evolution in the high Atwood number regime studied in this work. In this paper, the numerical growth rates of RTI obtained from the simulations are compared with their corresponding analytical values obtained from linear theory. Furthermore, it is also seen here that the dynamics of magnetic field is independent of viscosity and likewise the resistivity does not affect the dynamics of enstrophy and kinetic energy. In addition, this work presents the power law scaling of enstrophy, kinetic energy and magnetic field energy in both the injection range and the inertial sub-range of power spectra for different viscosity and resistivity cases, which could be useful for understanding the RTI induced turbulent mixing in HED plasmas.
The manuscript has been organized as follows. In § 2, a brief description of the governing equations is presented to study the RTI process in magnetized HED plasmas. Section 3 discusses the simulation techniques and problem set-up for the study. Section 4 presents the simulation results, comparison with theory and discussion. Section 5 presents the summary and conclusion.
2 Governing equations
In this section, the basic governing equations are presented for the study of RTI in magnetized HED plasmas in the presence of an applied horizontal magnetic field, viscosity and resistivity. Thermal conduction is neglected in this study to focus on the impact of viscosity, resistivity and magnetic fields. The generalized Lagrange multiplier-MHD (GLM-MHD) equations (Munz, Omnes & Schneider Reference Munz, Omnes, Schneider and Toro2001; Dedner et al. Reference Dedner, Kemm, Kröner, Munz, Schnitzer and Wesenberg2002) with the inclusion of viscosity and resistivity are solved. The compressible MHD equations are given by


where $\rho$ , $\boldsymbol {u}$
 , $p$
 , $\boldsymbol {g}$
 and $\boldsymbol {B}$
 represent the mass density, fluid velocity, pressure, gravitational field and magnitude of the magnetic field, respectively. Here, $\epsilon = p/(\gamma -1) +\rho u^{2} /2 + B^{2}/2\mu _0$
 defines the total energy; where $\gamma$
 is the ratio of specific heats, and is normally taken as $5/3$
 for monatomic gases assuming an ideal gas law. Also, $p$
 is the pressure. For the equation of state, an ideal gas law $p= (Z_i+1)\rho k_B T_i/m_i$
 is assumed; where $Z_i$
 , $m_i$
 , $k_b$
 and $T_i$
 represent the charge state of ion, mass of the ion, Boltzmann constant and temperature of the ion, respectively. Here, $\psi$
 , $C_h$
 and $C_p$
 represent the divergence cleaning potential, hyperbolic cleaning speed and parabolic cleaning speed, respectively. A user-specified parameter $C_r = C_p^{2}/C_h^{2}$
 is defined to determine the ratio between hyperbolic and parabolic divergence cleaning. If $C_r$
 is very large, the divergence error will only be transported through the hyperbolic term; $C_h$
 is calculated based on the grid sizes and Courant–Friedrichs–Lewy (CFL) number (Dedner et al. Reference Dedner, Kemm, Kröner, Munz, Schnitzer and Wesenberg2002). In the simulations presented here, $C_r =99\,999$
 is set to be very large so that only hyperbolic cleaning dominates. In the above equations $\boldsymbol {{\rm \pi} }$
 and $\eta$
 represent the viscous stress tensor and electrical resistivity coefficient, respectively. In this study, the Braginskii formulation (Braginskii Reference Braginskii1965) for calculating the viscosity and resistivity coefficients is used, $\mu = 0.96n_i k_B T_i \tau _i$
 and $\eta =m_e/1.96n_e q_e^{2} \tau _e$
 , where $\tau _e$
 and $\tau _i$
 are the collision times for electrons and ions, and ni and me are the ion number density and electron mass, respectively. Note that the viscosity and resistivity can also be presented in terms of the Reynolds ($Re$
 ) and magnetic Reynolds number ($Re_m$
 ) defined as, $Re=\rho VL/\mu$
 and $Re_m=\mu _0 VL/\eta$
 ; where $V$
 and $L$
 represent some reference velocity and length, respectively.
3 Numerical simulation and problem set-up
This section presents the simulation techniques and problem set-up used for studying the role of viscosity and resistivity in RTI in magnetized HED plasmas. The simulations presented here are in planar geometry and in two dimensions. A significant amount of insight can be gained from two-dimensional (2-D) studies, particularly where observations may be dominated by the 2-D evolution of perturbation growth. In other words, this is true when the wavelength of the perturbation for RTI growth in the considered directions is much smaller than the wavelength of the perturbation in the third direction. This approximation would be particularly well suited for cases where magnetic fields influence RTI growth, leading to regimes where the perturbation growth are more ‘two-dimensional like’. Most of the past literature on 2-D MHD turbulence, not specific to RTI, has focused on incompressible MHD models (Orszag & Tang Reference Orszag and Tang1979; Biskamp & Schwarz Reference Biskamp and Schwarz2001) whereas this work uses a compressible MHD model with a focus on the evolution of the RTI. However, a fully 3-D RTI turbulence study would be important to understand the RTI induced turbulence accounting for 3-D perturbations and this would constitute future studies. In this paper, the code PHORCE (Song Reference Song2020; Song & Srinivasan Reference Song and Srinivasan2021) developed at Virginia Tech is used for the 2-D RTI study. PHORCE is based on the nodal unstructured discontinuous Galerkin method (Hesthaven & Warburton Reference Hesthaven and Warburton2007) and solves fluid equations (2.1)–(2.5) in conservation form. To advance the simulation in time, an explicit fourth-order five-stage strong stability-preserving Runge–Kutta (Song Reference Song2020) scheme has been implemented. Several limiters and filters are applied in PHORCE to preserve the positivity of density and pressure and to diffuse the numerical oscillations that typically occur due to strong discontinuities. The code uses an affine reconstructed discontinuous Galerkin scheme (Song Reference Song2020; Song & Srinivasan Reference Song and Srinivasan2021) to solve the diffusion terms and to self-consistently capture the effect of spatially varying Reynolds numbers (viscous effects) and magnetic Reynolds numbers (resistive effects).
The RTI simulations have been performed in a rectangular domain with $x\in [-L_x/2, L_x/2]$ , $y \in [-L_y/2, L_y/2]$
 ; where $L_x$
 and $L_y$
 represent the width and height of the simulation domain, respectively. The simulations are performed with $2000 \times 1000$
 cells. The gravitational field $\boldsymbol {g}=-g\hat {y}$
 . The simulations are performed using ‘conducting wall’ boundary conditions along the $y$
 -direction and ‘periodic’ boundary condition along the $x$
 -direction. In equilibrium, the simulation is initialized using the standard hyperbolic tangent density profile given by

In the above equation, $\alpha$ defines the width of the hyperbolic tangent function. In the simulations presented here $\alpha$
 is taken to be $0.01$
 in order to provide a sharp gradient at the interface. The pressure profile is initialized as

where $p_0$ represents the background pressure of the system. To excite the multimode RTI in the simulation, the $y$
 -component of velocity at the interface ($y=0$
 plane) is perturbed as $v= \varSigma _{m=1}^{40} 0.01 R(m) \cos (2 {\rm \pi}(m x/Lx + R(m)))\exp (-\xi y^{2})$
 at $t=0$
 ; where $R(m)$
 and $\xi$
 represent the random number generator function of $m$
 random numbers and the spatial width along the $y$
 direction over which the perturbation falls at the interface, with $\xi =1000$
 .
In this work, all the simulation results are presented in normalized units. The following normalization factors have been used: $x \rightarrow {x}/{L_x}$ , $y \rightarrow {y}/{L_x}$
 , $t \rightarrow t\gamma _{{\rm RT}}$
 , $\rho \rightarrow {\rho }/{\rho _L}$
 , $g \rightarrow {g}/{\gamma _{{\rm RT}}^{2} L_x}$
 and $k_x \rightarrow k_x L_x$
 . Here, $\gamma _{{\rm RT}} =\sqrt {A_t g k}$
 , represents the growth rate of the RTI associated with the wavenumber $k=2 {\rm \pi}/\lambda$
 ; where $\lambda$
 is the wavelength of the mode (Chandrasekhar Reference Chandrasekhar1961). The simulations have been conducted with multimode perturbations having mode number $m = 1\text {--}40$
 , note that the value of $\gamma _{{\rm RT}}$
 would be different for different modes (or wavelengths). The growth rate becomes maximum for the smallest-wavelength modes and minimum for the longest-wavelength modes. To calculate the value of $\gamma _{{\rm RT}}$
 for the normalization of time, the smallest mode of perturbation ($m=40$
 ) having wavelength $\lambda = L_x/40$
 has been selected.
In some flows in HED plasmas, such as in ICF and supernova explosions (Dimonte et al. Reference Dimonte, Ramaprabhu, Youngs, Andrews and Rosner2005; Cabot & Cook Reference Cabot and Cook2006; Burton Reference Burton2011; Srinivasan et al. Reference Srinivasan, Dimonte and Tang2012; Srinivasan & Tang Reference Srinivasan and Tang2014a; Sauppe et al. Reference Sauppe, Palaniyappan, Loomis, Kline, Flippo and Srinivasan2019), the Atwood number can reach a very high value ($A_t\geqslant 0.85$ ) and the temperature can have a large variation in the domain. As a result, a large variation in Reynolds and magnetic Reynolds numbers may exist in the domain. In this work, the plasma parameters are selected to access highly varying density and temperature regimes in laboratory and astrophysical plasmas where the viscosity and resistivity may be important. The parameters are summarized in table 1 in normalized form. The simulations use an initial plasma beta $\beta ^{{\rm ini}} =2 \mu _0 p_0/{B_x^{{\rm ext}}}^{2} = 5000$
 whenever an external horizontal magnetic field ($B_x^{{\rm ext}}$
 ) exists in the system.
Summary of plasma parameters in normalized form.

Using the parameters given in table 1 and using the expressions for the isotropic viscosity ($\mu$ ) and resistivity ($\eta$
 ) mentioned in § 2, the Reynolds number $Re=\rho V_{{\rm RT}} L_y/\mu$
 and magnetic Reynolds number $Re_m=\mu _0 V_{{\rm RT}} L_y/\eta$
 , are plotted as a function of vertical height ($y/L_x$
 ) in figure 1(a). Here, $V_{{\rm RT}}=L_y \gamma _{{\rm RT}}$
 defines the terminal velocity of the RTI. Note that $Re$
 and $Re_m$
 are in the ranges of $485\text {--}7.3 \times 10^{7}$
 and 20–1105, respectively. The profile of resistivity (and corresponding magnetic Reynolds number) has been modified to ensure the resistive time step is larger than the hyperbolic time step since an explicit time-stepping scheme is used in this work. The following form of modified resistivity ($\eta _{{\rm mod}}$
 ) has been used, $\eta _{{\rm mod}} = \eta /a + b$
 ; where $a = 18.5$
 and $b =7.3 \times 10^{-9}$
 are constants. Using the modified expression of resistivity $\eta ^{{\rm mod}}$
 , the modified profile of magnetic Reynolds number ($Re_m^{{\rm mod}}$
 ) is plotted in figure 1(b). Note that the resistivity profile is modified in the heavy fluid to increase the minimum value of the magnetic Reynolds number from $20$
 to $285$
 . For the simulations presented here, the modified resistivity profile has been used to capture the essential physics of RTI in the presence of resistivity. The magnetic Prandtl number, $Pr_m = Re_m /Re =\nu /\eta$
 (where $\nu =\mu /\rho$
 is the kinematic viscosity), is a dimensionless quantity that estimates the ratio of momentum and magnetic diffusivity. In figure 1(b), $Pr_m$
 varies from $2$
 for $y/L_x<0$
 to $4\times 10^{-6}$
 for $y/L_x>0$
 producing a significant variation across the domain.
Panel (a) shows the profile of Reynolds number ($Re$ ) and magnetic Reynolds number ($Re_m$
 ) as functions of vertical height ($y/L_x$
 ) in the domain. Panel (b) shows the profile of magnetic Reynolds number ($Re_m$
 ) along with the modified magnetic Reynolds number ($Re_m^{{\rm mod}}$
 ) profile as functions of vertical height ($y/L_x$
 ).

4 Simulation results and discussion
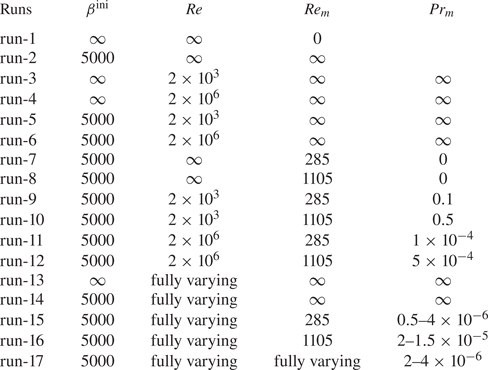
The simulations have been performed for different values of magnetic Prandtl number to elucidate the role of viscosity and resistivity in the RTI and magneto-RTI. Table 2 summarizes all simulation cases performed here for different values of plasma beta (external magnetic field) and magnetic Prandtl numbers (Reynolds numbers and magnetic Reynolds numbers). This section discusses the results and findings of each case that is presented.
Summary of numerical simulations performed here.

4.1 Simulation results for inviscid, irresistive cases: run-1 and run-2
Simulations for inviscid ($\mu =0$ ) and irresistive ($\eta =0$
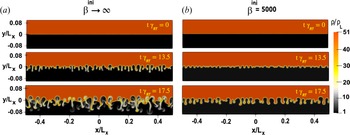
 ) cases are performed (see run-1 and run-2 in table 2). Figure 2 presents plots of mass density ($\rho /\rho _L$
 ) at different times for $\beta ^{{\rm ini}} \rightarrow \infty$
 (no initial external horizontal magnetic field) and for $\beta ^{{\rm ini}} =5000$
 (in the presence of an initial external horizontal magnetic field). As expected, the height of the RTI mixing region or the height of the RTI fingers reduces in the presence of an applied horizontal magnetic field. Note this suppression of small-scale structures due to the presence of the magnetic field. To calculate the growth rate, the peak bubble-to-spike distance ($h/L_x$
 ) over the normalized times ($t \gamma _{{\rm RT}}$
 ) for both $\beta ^{{\rm ini}} \rightarrow \infty$
 and $\beta ^{{\rm ini}} =5000$
 is presented in figure 3. In the simulations, the height has been measured by tracking the difference between the upper and lower boundaries of the RTI mixing region. As shown in the inset of figure 3, the numerical growth rates are calculated from the slope of the plot $\log (h/L_x)$
 vs $t \gamma _{{\rm RT}}$
 . The numerical growth rates obtained from the simulations for both $\beta ^{{\rm ini}} \rightarrow \infty$
 and $\beta ^{{\rm ini}}=5000$
 are $0.75 \gamma _{{\rm RT}}$
 and $0.5 \gamma _{{\rm RT}}$
 , respectively. The growth of RTI significantly decreases in the presence of an applied horizontal magnetic field, as expected. The analytical expression of the growth rate ($\gamma _{{\rm RT}}$
 ) of RTI for purely hydrodynamic flows (no viscosity, no resistivity and no magnetic field) is given by Chandrasekhar (Reference Chandrasekhar1961) as

Using the parameters given in table 1 and $k= 80{\rm \pi} /L_x$ (for $\lambda =L_x/40$
 ), the analytical value of the growth rate $\gamma _{{\rm RT}}$
 can be estimated as $2.69 \times 10^{9}\ {\rm s}^{-1}$
 for a single mode that is estimated to be the fastest growing at early times. The numerical growth rate is $0.75 \gamma _{{\rm RT}}= 2 \times 10^{9}\ {\rm s}^{-1}$
 but this is for a multimode growth rate, which explains the difference between the analytical and numerical values. As time evolves, the nonlinear interactions between modes significantly change the dominant wavenumber. When an applied magnetic field ${\boldsymbol {B}}^{{\rm ext}}$
 exists, the RTI growth rate becomes (Chandrasekhar Reference Chandrasekhar1961; Jun & Norman Reference Jun and Norman1996)

Note that the RTI is affected by the horizontal magnetic field (${\boldsymbol {B}} \parallel {\boldsymbol {k}}$ ) and is not directly impacted by magnetic fields that are normal to the interface when using a MHD model. In figure 2 for $\beta ^{{\rm ini}}=5000$
 , the height of the mixing region is decreased along with suppression of the small structures. In this case, one can approximately calculate the wavelength of RTI fingers by calculating the number of RTI fingers in the domain. This technique suggests approximately $30$
 RTI spikes growing at this time. Therefore, the effective smallest wavelength is approximately ${\approx }L_x/30$
 . When an appropriately aligned magnetic field is initialized, the value of the peak magnetic field in the system increases with time as RTI grows. For example, the plasma $\beta$
 becomes $226$
 from an initial value of $5000$
 at time $t\gamma _{{\rm RT}} =13.5$
 . Using the parameters given in table 1, $\beta =226$
 and $k_x L_x= 60{\rm \pi}$
 , the analytical values of the growth rate $\gamma _{{\rm RT}}^{B}$
 can be estimated as $\gamma _{{\rm RT}}^{B} =0.63 \gamma _{{\rm RT}}$
 . The numerical growth rate obtained from the simulation shows good agreement with the analytical value for $\beta ^{{\rm ini}}=5000$
 considering that these are estimates for multimode simulations.
Plot of mass density ($\rho /\rho _L$ ) profiles at different times for $\beta ^{{\rm ini}} \rightarrow \infty$
 (a) and $\beta ^{{\rm ini}}=5000$
 (b); where $\mu =0$
 and $\eta =0$
 . Note the stabilizing effect of an applied horizontal magnetic field on overall RTI and the damping of short-wavelength modes.

Plot of peak bubble-to-spike distance ($h/L_x$ ) over time ($t \gamma _{{\rm RT}}$
 ) for $\beta ^{{\rm ini}} \rightarrow \infty$
 and $\beta ^{{\rm ini}}=5000$
 ; where $\mu =0$
 and $\eta =0$
 to estimate a numerical growth rate. Note the growth rate is reduced with an applied horizontal magnetic field, as expected.

The enstrophy ($Z$ ), kinetic energy ($E$
 ) and magnetic field energy ($B^{2}$
 ) averaged over the vertical direction ($y$
 ) of the system are defined as

where $\boldsymbol {\omega } = \boldsymbol {\nabla } \times \boldsymbol {u}$ represents the fluid vorticity. In 2-D mixing and turbulence, the enstrophy ($Z$
 ), kinetic energy ($E$
 ) and magnetic field energy ($B^{2}$
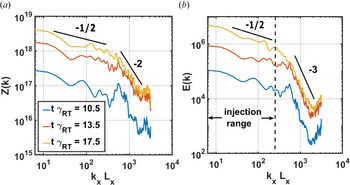
 ) are important quantities as they appear to be the only quadratic constants of motion. In figure 4, the evolution of the enstrophy ($Z$
 ) and kinetic energy ($E$
 ) spectra ispresented as a function of normalized wavenumber $k_x L_x$
 at different times for $\beta ^{{\rm ini}} \rightarrow \infty$
 . Note that there will be no magnetic field for $\beta ^{{\rm ini}} \rightarrow \infty$
 .
Evolution of enstrophy ($Z$ ) and kinetic energy ($E$
 ) spectra as a function of wavenumber ($k_x L_x$
 ) for $\beta ^{{\rm ini}} \rightarrow \infty$
 ; where $\mu =0$
 and $\eta =0$
 .

The spectra can be separated into three regions based on the range of $k_x L_x$ . The first region with $k_x L_x \leqslant 80 {\rm \pi}$
 is known as the injection range where all the external perturbation modes exist. All the energy has been injected into the system within these wavelengths. The second region $80{\rm \pi} \leqslant k_x L_x \leqslant 600{\rm \pi}$
 , or the middle range, is the inertial sub-range. This is the regime which basically connects the injection range to the dissipation range. The third region where $k_x L_x \geqslant 600{\rm \pi}$
 is the dissipation range, which accounts for grid scales as $L_x=2000 \Delta x$
 ; where $\Delta x$
 is the grid size along the $x$
 -direction. As physical dissipation (viscosity and resistivity) is absent in the system for the simulations in this section, the only dissipation mechanism is, therefore, governed by the numerical dissipation. All the energy for modes smaller than or equal to the grid size is dissipated by numerical dissipation. For $\beta ^{{\rm ini}} \rightarrow \infty$
 (see figure 4), note that the enstrophy ($Z$
 ) and kinetic energy ($E$
 ) increase equally in all the available modes in the system with time as long as $t\gamma _{{\rm RT}} \leqslant 13.5$
 . At $t \gamma _{{\rm RT}}= 17.5$
 , the transfer of kinetic energy as well as enstrophy is seen from short-wavelength modes to long-wavelength modes. This happens due to the nonlinear interactions of the modes leading to the formation of longer-wavelength modes with time. As a result, the small-scale structures get modified, changing the growth rate in the nonlinear regime for $\beta ^{{\rm ini}} \rightarrow \infty$
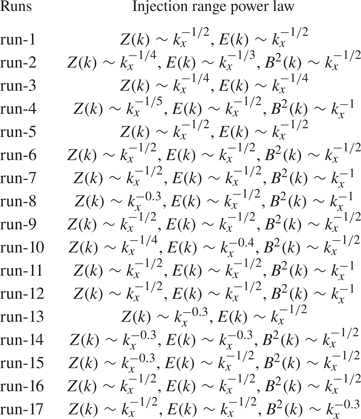
 . The numerically obtained power law scalings for the enstrophy, kinetic energy and magnetic field energy spectra in both the injection range and inertial sub-range are included in figure 4. In this case, the spectra of kinetic energy and enstrophy obey the following power scaling laws in the injection range ($k_x L_x \leqslant 80 {\rm \pi}$
 ),


In the inertial sub-range ($80{\rm \pi} \leqslant k_x L_x \leqslant 600{\rm \pi}$ ), the spectra are found to obey different power laws,


For $\beta ^{{\rm ini}}=5000$ , the evolution of enstrophy ($Z$
 ), kinetic energy ($E$
 ) and magnetic field energy ($B^{2}$
 ) spectra as a function of wavenumber $k_x L_x$
 at different times is shown in figure 5. The enstrophy ($Z$
 ), kinetic energy ($E$
 ) and magnetic field energy ($B^{2}$
 ) increase equally in all modes in the system until $t \gamma _{{\rm RT}} = 17.5$
 for $\beta ^{{\rm ini}}=5000$
 . There is no transfer of kinetic energy, enstrophy and magnetic field energy over the modes. This is because the spectrum still lies in the linear regime due to the presence of a horizontal magnetic field. The magnetic field opposes the growth of the RTI and decreases the vertical velocity of the fluid. In this case, the spectra of kinetic energy, enstrophy and magnetic field energy, obtained from the numerical simulations, obey the following power laws in the injection range ($k_x L_x \leqslant 80 {\rm \pi}$
 ):


Similarly, the power law in the inertial sub-range ($80{\rm \pi} \leqslant k_x L_x \leqslant 600{\rm \pi}$ ) for $\beta ^{{\rm ini}}=5000$
 is found to be


The slope of the spectra in the inertial sub-range decreases with the presence of a horizontal magnetic field. The slope of the inertial sub-range measures the rate at which the energy is transferred from large scale to small scales or vice versa. In other words, it defines the rate at which the larger scales get fragmented into smaller scales and vice versa due to mixing. Therefore, this shows that the rate of small-scale formation due to RTI mixing decreases with the application of a horizontal magnetic field. The scaling of these power laws in both the injection range and inertial sub-range for these cases (run-1–2) is summarized in tables 3 and 4. Note that the numerical dissipation is active in the range of $k_x L_x > 600{\rm \pi}$ . As a result, all the energy is also seen to grow proportionally with time in this regime.
Evolution of enstrophy ($Z$ ), kinetic energy ($E$
 ) magnetic field energy ($B^{2}$
 ) spectra as a function of wavenumber ($k_x L_x$
 ) for $\beta ^{{\rm ini}}=5000$
 ; where $\mu =0$
 and $\eta =0$
 .

Summary of power laws for the numerical simulations in the injection range.

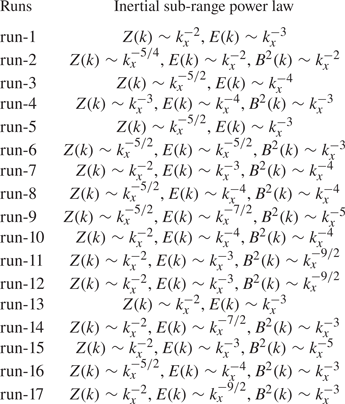
Summary of power laws for the numerical simulations in the inertial sub-range.

4.2 Simulation results for constant viscosity, irresistive cases ($Pr_m = \infty$ ): run-3–6

Constant viscosity is introduced throughout the domain in the simulation. The simulations are performed for two different values of constant Reynolds numbers, $Re= 2\times 10^{3}$ and $Re=2 \times 10^{6}$
 , but with no resistivity ($Re_m=\infty$
 ). As $\eta =0$
 for these simulations, this study corresponds to the cases of very large magnetic Prandtl number ($Pr_m \rightarrow \infty$
 ). In this study, cases without a magnetic field $\beta ^{{\rm ini}} \rightarrow \infty$
 and with a magnetic field $\beta ^{{\rm ini}}=5000$
 at $t\gamma _{{\rm RT}} =0$
 are considered. The relevant simulation parameters are shown in table 2 under run-3–6. In figure 6, the mass density ($\rho /\rho _L$
 ) is shown at different times for $Re =2 \times 10^{3}$
 and $Re =2\times 10^{6}$
 for $\beta ^{{\rm ini}} \rightarrow \infty$
 . It is seen that the growth of the RTI decreases with decreasing $Re$
 or increasing viscosity ($\mu$
 ). Figure 7 shows mass density ($\rho /\rho _L$
 ) at different times for the two Reynolds numbers $Re =2 \times 10^{3}$
 and $Re =2 \times 10^{6}$
 , but for $\beta ^{{\rm ini}}=5000$
 . Here, the size of the RTI fingers decreases further when applying a horizontal magnetic field compared with the inviscid case presented in § 4.1. The magnetic field has a stabilizing effect in addition to viscous stabilization on the growth of RTI. To further illustrate the complementary role of viscous and magnetic field stabilization, the peak bubble-to-spike distance ($h/L_x$
 ) over time ($t \gamma _{{\rm RT}}$
 ) is presented for both $\beta ^{{\rm ini}} \rightarrow \infty$
 and $\beta ^{{\rm ini}}=5000$
 and for different constant Reynolds numbers ($Re$
 ) in figure 8. Note that, as $Re$
 increases, the growth rate of the RTI approaches the growth rate for the inviscid cases ($\mu =0$
 ) with and without the initial magnetic field. For $\beta ^{{\rm ini}} \rightarrow \infty$
 , the growth rates from the simulations are $0.55 \gamma _{{\rm RT}}$
 and $0.64 \gamma _{{\rm RT}}$
 for $Re =2 \times 10^{3}$
 and $Re =2 \times 10^{6}$
 , respectively. The analytical expression for the growth rate of RTI in a compressible viscous fluid is given by Menikoff et al. (Reference Menikoff, Mjolsness, Sharp and Zemach1977) as

where $\omega = \bar {\nu }^{2} k^{3}/ A_t g$ and $\bar {\nu } =(\mu _l +\mu _h)/ (\rho _l+ \rho _h)$
 is the density averaged kinematic viscosity. In figure 9, the analytical form of $\gamma _{{\rm RT}}^{{\rm vis}}/ \gamma _{{\rm RT}}$
 is shown as a function of wavenumber $k_x L_x$
 for $Re = 2 \times 10^{3}$
 and $Re = 2 \times 10^{6}$
 . For $Re = 2 \times 10^{3}$
 , it is seen that the analytical growth rate is maximum for $k_x L_x \approx 60 {\rm \pi}$
 , which corresponds to a wavelength of approximately $L_x /30$
 . Similarly, for $Re = 2 \times 10^{6}$
 , the analytical growth rate becomes maximum for $k_x L_x \approx 76 {\rm \pi}$
 , or a wavelength of approximately $L_x /38$
 . This is consistent with the simulation results from figure 7. The theoretical growth rates of the mode having wavelength $L_x/30$
 and for the mode having wavelength $L_x/38$
 are approximately $0.56 \gamma _{{\rm RT}}$
 and $0.65 \gamma _{{\rm RT}}$
 , respectively. The growth rates obtained from simulations show good agreement with the analytical results.
Plot of mass density ($\rho /\rho _L$ ) profile at different times for different constant values of $Re$
 ; where $\beta ^{{\rm ini}} \rightarrow \infty$
 and $Pr_m=\infty$
 ($\eta =0$
 ). Note the stabilizing effect of viscosity on short-wavelength RTI.

Plot of mass density ($\rho /\rho _L$ ) profile at different times for different constant values of $Re$
 ; where $\beta ^{{\rm ini}} =5000$
 and $Pr_m=\infty$
 ($\eta =0$
 ). Note the viscous and magnetic field stabilization acting in tandem to damp RTI growth.

Plot of peak bubble-to-spike distance ($h/L_x$ ) over time ($t \gamma _{{\rm RT}}$
 ) for $\beta ^{{\rm ini}} \rightarrow \infty$
 and $\beta ^{{\rm ini}} =5000$
 and for different constant values of $Re$
 ; where $\eta =0$
 . Note the effects of viscous and magnetic stabilization on RTI growth.

Plot of $\gamma _{{\rm RT}}^{{\rm vis}}/\gamma _{{\rm RT}}$ as a function of wavenumber $k_x L_x$
 for different constant values of $Re$
 ; where $\eta =0$
 . Note that the viscous cases produce a peak growth in the linear regime corresponding to $k_xL_x \approx 60{\rm \pi}$
 .

Note that, when viscosity increases, the morphology of the RTI spikes appear to be smooth and exhibit different characteristics, as seen in figure 7. Due to the presence of viscosity, the traditional mushroom cap structure on the tip of the RTI fingers is inhibited and forms smooth structures. The presence of viscosity also strongly suppresses the growth of the small-scale structures and short-wavelength modes.
The plasma $\beta$ as a function of peak bubble-to-spike distance ($h/L_x$
 ) for different $Re$
 for $\beta ^{{\rm ini}}=5000$
 is presented in figure 10. Note that the plasma $\beta$
 is independent of $Re$
 if presented as a function of the peak bubble-to-spike amplitude instead of as a function of time. This shows that the dynamics of magnetic field is not affected by the viscosity for the same amplitude of the RTI growth but the actual RTI growth as a function of time is impacted by the different $Re$
 , as noted from figure 8. Also note that plasma $\beta$
 decreases with time or height as RTI grows for all $Re$
 considered. This is because the value of magnetic field increases as RTI grows in the system. Figure 11 presents enstrophy ($Z$
 ), kinetic energy ($E$
 ) and magnetic field energy ($B^{2}(k$
 )) spectra at time $t \gamma _{{\rm RT}} t= 17.5$
 as a function of wavenumber $k_x L_x$
 for different values of $Re$
 . The scaling of these power laws in both the injection range and inertial sub-range for these cases (run-3–6) is summarized in tables 3 and 4. Note that the spectral power of the magnetic energy does not change with $Re$
 but the spectral power of enstrophy and kinetic energy increases with an increasing value of $Re$
 for all available modes. This shows that the dynamics of magnetic field energy is independent of $Re$
 or viscosity. It was shown by Kulsrud et al. (Reference Kulsrud, Cen, Ostriker and Ryu1997) that the dynamics of the magnetic field can be completely described by the ion fluid vorticity in the absence of viscosity and resistivity but in the presence of a Biermann battery, which is not considered in this work. Including the viscosity and resistivity in the MHD equations considered here, a theoretical treatment is included to illustrate the dynamics of the magnetic field and vorticity in the presence of viscosity and resistivity. Following the same method as shown by Kulsrud et al. (Reference Kulsrud, Cen, Ostriker and Ryu1997), the momentum equation (2.2) can be written in terms of vorticity ($\omega$
 ) as

where $\boldsymbol {J}$ represents the net current density. Similarly, (2.4) can be modified in terms of the ion cyclotron frequency ($\boldsymbol {\omega }_{\boldsymbol {ci}}=Z_i e \boldsymbol {B}/m_i$
 ) as

The last terms on the right-hand sides of (4.15) and (4.16) are responsible for the dissipation of the vorticity and magnetic field, respectively. The dynamics of vorticity and kinetic energy depends on the viscous stress tensor $\boldsymbol {{\rm \pi} }$ and the corresponding $Re$
 . This is consistent with the numerical results presented here. On the other hand, the dynamics of vorticity is independent of resistivity $\eta$
 or magnetic Reynolds number $Re_m$
 , but the dynamics of the magnetic field depends on the $Re_m$
 . To illustrate this, simulations are performed for different constant values of $Re_m$
 discussed in the next section.
Plot of plasma $\beta$ as a function of peak bubble-to-spike distance ($h/L_x$
 ) for different values of $Re$
 ; where $\beta ^{{\rm ini}}=5000$
 and $Pr_m=\infty$
 ($\eta =0$
 ). Note that the plasma $\beta$
 is independent of $Re$
 when compared at the same RTI amplitude.

Evolution of enstrophy ($Z$ ), kinetic energy ($E$
 ) and magnetic field energy ($B^{2}$
 ) spectra at late time $t\gamma _{{\rm RT}} = 17.5$
 as a function of wavenumber ($k_x L_x$
 ) for different constant values of $Re$
 ; where $\eta =0$
 . Note that the spectra of enstrophy and kinetic energy in the inertial range of dissipation ($k_x L_x \geqslant 80{\rm \pi}$
 ) change with $Re$
 but the spectra of magnetic field in this range are independent of $Re$
 .

4.3 Simulation results for constant resistivity, inviscid cases ($Pr_m=0$): run-7–8

In this section, simulation results are presented for different constant magnetic Reynolds numbers ($Re_m$ ) but with no viscosity ($\mu =0$
 ) (see run-7–8 in table 2). In this study, $Pr_m =0$
 . In all these simulations, an initial horizontal magnetic field with $\beta ^{{\rm ini}} =5000$
 is applied. In figure 12, the mass density ($\rho /\rho _L$
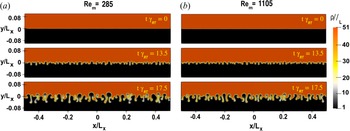
 ) profile at different times is presented for $Re_m =285$
 and $Re_m=1105$
 . It is seen that the growth of the RTI increases with a decrease in magnetic Reynolds number ($Re_m$
 ) or increase of resistivity ($\eta$
 ). This is because the resistivity diffuses the magnetic field and reduces the magnetic stabilization. As a result, the RTI growth increases due the reduction of effective magnetic field tension. In this figure, it is to be noted that the morphology of the RTI spikes in terms of mushroom cap structures on the tip of the fingers is seen to be independent of $Re_m$
 . Also of note is the appearance of additional small-scale structures for higher resistivity cases. This is also expected as the magnetic field opposes development of the small-scale structures. In figure 13, the peak bubble-to-spike distance ($h/L_x$
 ) over time ($t \gamma _{{\rm RT}}$
 ) is presented for different constant values of $Re_m$
 to illustrate the effect of magnetic Reynolds number on the growth rate of RTI in HED plasmas. It is found that the growth rate increases with increase in resistivity. The numerical growth rates are obtained from the simulations for $Re_m =285$
 and $Re_m =1105$
 as $0.68 \gamma _{{\rm RT}}$
 and $0.53 \gamma _{{\rm RT}}$
 , respectively. Including a finite constant resistivity $\eta$
 , Jukes (Reference Jukes1963) has shown that the analytical growth rate of RTI changes with resistivity $\eta$
 as

The growth rates obtained from the simulations also obey the analytical scaling.
Plot of mass density ($\rho /\rho _L$ ) profile at different times for $Re_m=285$
 and $Re_m=1105$
 ; where $\beta ^{{\rm ini}}=5000$
 and $\mu =0$
 . Note that a smaller $Re_m$
 , corresponding to a larger $\eta$
 , produces an increase in RTI growth compared with a larger $Re_m$
 .

Plot of peak bubble-to-spike distance ($h/L_x$ ) over time ($t \gamma _{{\rm RT}}$
 ) for different constant values of $Re_m$
 ; where $\beta ^{{\rm ini}}=5000$
 and $\mu =0$
 . Note that the growth rate increases with a decrease in $Re_m$
 , corresponding to an increase in $\eta$
 .

The plasma $\beta$ is plotted as a function of peak bubble-to-spike distance ($h/L_x$
 ) for different $Re_m$
 in figure 14. Note that plasma $\beta$
 decreases with peak bubble-to-spike distance for all values of $Re_m$
 but at different rates depending on the value of $Re_m$
 . The rate at which the plasma beta decreases is larger for high $Re_m$
 . This shows that the dynamics of the magnetic field is not independent of resistivity. This is due to the fact that the magnetic field gets diffused more for low $Re_m$
 , leading to a higher plasma $\beta$
 .
Plot of plasma $\beta$ as a function of peak bubble-to-spike distance ($h/L_x$
 ) for different constant values of $Re_m$
 ; where $\beta ^{{\rm ini}}=5000$
 and $\mu =0$
 . Note that the plasma $\beta$
 changes with $Re_m$
 .

In figure 15, a plot of enstrophy ($Z$ ), kinetic energy ($E$
 ) and magnetic field energy ($B^{2}(k$
 )) spectra at time ($t \gamma _{{\rm RT}} t= 17.5$
 ) as a function of wavenumber $k_x L_x$
 is shown for different values of $Re_m$
 . The scaling of these power laws in both the injection range and inertial sub-range for these cases (run-7–8) is summarized in tables 3 and 4. It is observed that the magnetic field spectra change significantly by changing the value of $Re_m$
 , whereas the spectra of enstrophy and kinetic energy do not show any significant dependence on the value of $Re_m$
 . The spectral power of magnetic field energy increases with increasing value of $Re_m$
 for all the available modes. This justifies that the dynamics of the magnetic field energy depends on $Re_m$
 or $\eta$
 . But the dynamics of enstrophy and kinetic energy does not depend on $Re_m$
 . This is consistent with (4.15) and (4.16).
Evolution of enstrophy ($Z$ ), kinetic energy ($E$
 ) and magnetic field energy ($B^{2}$
 ) spectra at late time $t\gamma _{{\rm RT}} = 17.5$
 as a function of wavenumber ($k_x L_x$
 ) for different constant values of $Re_m$
 ; where $\beta ^{{\rm ini}}=5000$
 and $\mu =0$
 . Note that the spectra of enstrophy and kinetic energy in the inertial range of dissipation ($k_x L_x \geqslant 80{\rm \pi}$
 ) are independent of $Re_m$
 but the spectra of the magnetic field in this range change with $Re_m$
 .

4.4 Simulation results for constant viscosity, constant resistivity cases: run-9–12
Simulations have also been performed for different values of constant $Re$ with the inclusion of different constant values of $Re_m$
 (see run-9–12 in table 2). In this case, all the simulations use an applied horizontal magnetic field corresponding to $\beta ^{{\rm ini}}=5000$
 . Figure 16 presents the mass density ($\rho /\rho _L$
 ) profile at different times for $Re_m =285$
 ($Pr_m = 0.1$
 ) and $Re_m=1105$
 ($Pr_m = 0.5$
 ) with $Re= 2 \times 10^{3}$
 . Similarly, the mass density ($\rho /\rho _L$
 ) profile at different times for $Re_m =285$
 ($Pr_m = 1 \times 10^{-4}$
 ) and $Re_m=1105$
 ($Pr_m = 5 \times 10^{-4}$
 ) for $Re= 2 \times 10^{6}$
 is presented in figure 17. Note that the morphology of the RTI fingers does not exhibit a strong dependence on $Re_m$
 for the values considered here, but shows a more significant dependence with $Re$
 . The mushroom caps on the tip of the RTI fingers are inhibited for high viscosity. When viscosity is held constant, the growth rate increases with an increase in resistivity. On the other hand, the growth rate decreases with an increase in viscosity when resistivity is held constant.
Plot of the mass density ($\rho /\rho _L$ ) profile at different times for $Re_m=285$
 ($Pr_m = 0.1$
 ) and $Re_m=1105$
 ($Pr_m = 0.5$
 ); where $Re= 2 \times 10^{3}$
 and $\beta ^{{\rm ini}}=5000$
 .

Plot of the mass density ($\rho /\rho _L$ ) profile at different times for $Re_m=285$
 ($Pr_m = 1 \times 10^{-4}$
 ) and $Re_m=1105$
 ($Pr_m = 5 \times 10^{-4}$
 ); where $Re= 2 \times 10^{6}$
 and $\beta ^{{\rm ini}}=5000$
 .

The power law scaling of the enstrophy ($Z$ ), kinetic energy ($E$
 ) and magnetic field energy ($B^{2}(k$
 )) spectra as a function of wavenumber $k_x L_x$
 is quantified for these runs (run-9–12) in both the injection range as well as the inertial sub-range. The scalings of these power laws are given in tables 3 and 4 for run-9–12. Figure 18 presents the enstrophy ($Z$
 ), kinetic energy ($E$
 ) and magnetic field energy ($B^{2}(k$
 )) spectra at time $t \gamma _{{\rm RT}} t= 17.5$
 as a function $k_x L_x$
 for different values of $Re$
 ; where the value of $Re_m$
 is held constant to $Re_m=285$
 for $\beta ^{{\rm ini}}=5000$
 . It is seen here that the spectra of enstrophy and kinetic energy change with $Re$
 , whereas the magnetic field spectra do not change with $Re$
 . Similarly, the enstrophy ($Z$
 ), kinetic energy ($E$
 ) and magnetic field energy ($B^{2}(k$
 )) spectra at time $t \gamma _{{\rm RT}} t= 17.5$
 as a function $k_x L_x$
 for different values of $Re_m$
 are plotted in figure 19 holding $Re$
 constant at $Re=2 \times 10^{3}$
 for $\beta ^{{\rm ini}}=5000$
 . Note that $Re_m$
 does not affect the spectra of enstrophy and kinetic energy, whereas the magnetic field spectra depend on $Re_m$
 . These findings are consistent with those in §§ 4.2 and 4.3.
Evolution of enstrophy ($Z$ ), kinetic energy ($E$
 ) and magnetic field energy ($B^{2}$
 ) spectra at late time $t\gamma _{{\rm RT}} = 17.5$
 as a function of wavenumber ($k_x L_x$
 ) for different constant values of $Re$
 ; where $\beta ^{{\rm ini}}=5000$
 and $Re_m =285$
 . Note that the spectra of enstrophy and kinetic energy in the inertial range of dissipation ($k_x L_x \geqslant 80{\rm \pi}$
 ) change with $Re$
 but the spectra of the magnetic field in this range are independent of $Re$
 .

Evolution of enstrophy ($Z$ ), kinetic energy ($E$
 ) and magnetic field energy ($B^{2}$
 ) spectra at late time $t\gamma _{{\rm RT}} = 17.5$
 as a function of wavenumber ($k_x L_x$
 ) for different constant values of $Re_m$
 ; where $\beta ^{{\rm ini}}=5000$
 and $Re = 2 \times 10^{3}$
 . Note that the spectra of enstrophy and kinetic energy in the inertial range of dissipation ($k_x L_x \geqslant 80{\rm \pi}$
 ) are independent of $Re_m$
 but the spectra of the magnetic field change with $Re_m$
 .

4.5 Simulation results for fully varying viscosity, irresistive cases ($Pr_m=\infty$): run-13–14

Next, the self-consistent fully varying $Re$ profile shown in figure 1 is considered without resistivity (see run-13–14 in table 2). The simulations have been performed using both $\beta ^{{\rm ini}} \rightarrow \infty$
 and $\beta ^{{\rm ini}}=5000$
 . In figure 20, the mass density ($\rho /\rho _L$
 ) profile is presented at different times for $\beta ^{{\rm ini}} \rightarrow \infty$
 and $\beta ^{{\rm ini}}=5000$
 . To further illustrate the effect of a fully varying $Re$
 profile on the RTI, the peak bubble-to-spike distance ($h/L_x$
 ) over time ($t \gamma _{{\rm RT}}$
 ) is presented for $\beta ^{{\rm ini}} \rightarrow \infty$
 and $\beta ^{{\rm ini}}=5000$
 for this case in figure 21 along with the bubble-to-spike amplitudes for constant $Re$
 cases. The growth and nature of the RTI for fully varying viscosity for $\beta ^{{\rm ini}} \rightarrow \infty$
 and $\beta ^{{\rm ini}}=5000$
 is close to that of the high viscosity case or low Reynolds number ($Re=2 \times 10^{3}$
 ) case. This is because the RTI fingers largely grow in the lower density regime ($y<0$
 ) at the interface due to the high Atwood number considered here. The mixing is not significant in the high density regime. In the lower density regime, the value of $Re=2 \times 10^{3}$
 , which has significantly higher viscosity compared with the high density regime ($y>0$
 ). Therefore, the evolution of RTI is dominated by the high viscosity regime. Hence, viscosity, even if disparate, plays an important role in the RTI process in such parameter regimes with and without an applied horizontal magnetic field. Similar to the previous cases, the power law scaling of enstrophy ($Z$
 ), kinetic energy ($E$
 ) and magnetic field energy ($B^{2}$
 ) spectra as a function of wavenumber $k_x L_x$
 in both the injection range and inertial sub-range are summarized in tables 3 and 4 under run-13–14.
Plot of the mass density ($\rho /\rho _L$ ) profile at different times for $\beta ^{{\rm ini}} \rightarrow \infty$
 and $\beta ^{{\rm ini}}=5000$
 ; where fully varying $Re$
 is considered with no resistivity ($\eta =0$
 ). Note the viscous stabilization of RTI due to the high viscosity of the low density region.

Plot of peak bubble-to-spike distance ($h/L_x$ ) over time ($t \gamma _{{\rm RT}}$
 ) for $\beta ^{{\rm ini}} \rightarrow \infty$
 and $\beta ^{{\rm ini}}=5000$
 for different values of $Re$
 ; where $\eta =0$
 . Note that the fully varying $Re$
 case has viscous stabilization corresponding to the viscosity of the lower density fluid.

4.6 Simulation results for fully varying viscosity, constant resistivity cases: run-15–16
Simulations are performed considering fully varying $Re$ with the inclusion of different values of constant $Re_m$
 ($Re_m=285$
 and $Re_m=1105$
 ). These correspond to $Pr_m$
 in the range $0.5 \text {--} 4\times 10^{-6}$
 for $Re_m=285$
 and $Pr_m$
 in the range $2 \text {--} 1.5\times 10^{-5}$
 for $Re_m = 1105$
 . In these studies, an applied horizontal magnetic field corresponding to $\beta ^{{\rm ini}}=5000$
 is included as before. Figure 22 shows the mass density ($\rho /\rho _L$
 ) profile at different times for $Re_m =285$
 and $Re_m=1105$
 . It is seen that the growth of the RTI spikes increases with the decrease of $Re_m$
 as expected. In figure 23, the peak bubble-to-spike distance ($h/L_x$
 ) over time ($t\gamma _{{\rm RT}}$
 ) for different values of $Re_m$
 is shown. Note that the growth of RTI is higher for high resistivity (blue solid line) compared with that obtained for low resistivity (red solid line) when also including the fully varying viscosity. The plasma $\beta$
 as a function of peak bubble-to-spike distance ($h/L_x$
 ) for different values of constant $Re_m$
 (solid blue and red line) is presented in figure 24, where $\beta ^{{\rm ini}}=5000$
 and fully varying $Re$
 are considered. The magnetic field decreases for the lower value of $Re_m= 285$
 , which corresponds to higher $\eta$
 . Furthermore, it is observed here that the morphology of the RTI fingers is not significantly affected by the resistivity. The power law scaling of enstrophy ($Z$
 ), kinetic energy ($E$
 ) and magnetic field energy ($B^{2}$
 ) spectra as a function of wavenumber $k_x L_x$
 in both the injection range and inertial sub-range for these cases is summarized in tables 3 and 4 in the column under run-15–16.
Plot of mass density ($\rho /\rho _L$ ) profiles at different times for $Re_m =285$
 and $Re_m= 1105$
 ; where $\beta ^{{\rm ini}}=5000$
 and fully varying $Re$
 is considered. Note increased growth of RTI for lower $Re_m$
 as expected, even with a fully varying $Re$
 .

Plot of peak bubble-to-spike distance ($h/L_x$ ) over time ($t \gamma _{{\rm RT}}$
 ) for different values of $Re_m$
 ; where $\beta ^{{\rm ini}}=5000$
 and fully varying $Re$
 is considered. Note that RTI growth is higher for low $Re_m$
 even with a fully varying $Re$
 . Also note that the fully varying $Re$
 and fully varying $Re_m$
 case asymptotes to the $Re_m$
 corresponding to the lower fluid.

Plot of plasma $\beta$ as a function of peak bubble-to-spike distance ($h/L_x$
 ) for $Re_m=285$
 , $Re_m =1105$
 and fully varying $Re_m$
 ; where $\beta ^{{\rm ini}}=5000$
 and fully varying $Re$
 are considered. Note that the plasma $\beta$
 is higher late in time for lower $Re_m$
 compared with a higher $Re_m$
 , even with a fully varying $Re$
 . Also note that the fully varying $Re_m$
 case produces a magnetic field that lies in between the regimes of the upper and lower fluids.

4.7 Simulation results for fully varying viscosity, fully varying resistivity case: run-17
The final set of simulations is performed for a fully varying $Re$ along with a fully varying $Re_m$
 profile. These correspond to $Pr_m$
 in the range $2 \text {--} 4\times 10^{-6}$
 . Note that the resistivity profile used for this case is the modified resistivity profile shown in figure 1. In this case, an applied horizontal magnetic field corresponding to $\beta ^{{\rm ini}}=5000$
 is included, as in the previous cases. Figure 25 presents the mass density ($\rho /\rho _L$
 ) profiles for fully varying viscosity and resistivity profiles at different times. It is observed that the structure of RTI is quite different from the conventional mushroom cap structure. The morphology of the RTI spikes exhibits less Kelvin–Helmholtz formation and shows the suppression of small-scale structures more significantly than the higher $Re_m=1105$
 , fully varying $Re$
 case presented in figure 22. In figure 23, the peak bubble-to-spike distance ($h/L_x$
 ) over time($t\gamma _{{\rm RT}}$
 ) for fully varying $Re_m$
 and fully varying $Re$
 profiles is presented along with the constant $Re_m$
 cases (see yellow solid line). The growth rate for the fully varying resistivity case is close to the growth rate obtained for the constant $Re_m =1105$
 case. This is because the RTI mostly grows in the low density regime where $Re_m =1105$
 . Therefore, the dynamics of RTI for the high Atwood number regime can be described by the physical parameter space of the lower fluid, which is governed by the viscosity and resistivity of the lower fluid. The plasma $\beta$
 as a function of peak bubble-to-spike distance ($h/L_x$
 ) for fully varying $Re_m$
 and $Re$
 is shown in figure 24 (see solid yellow line), where $\beta ^{{\rm ini}}=5000$
 is considered. The dynamics of the magnetic field and its corresponding growth, as noted by the decreasing plasma $\beta$
 , for fully varying $Re_m$
 and $Re$
 , is different from the constant magnetic $Re_m$
 cases. The field strength obtained lies in between the regimes of the upper and lower fluids (with their corresponding resistivities). The power law scaling of enstrophy ($Z$
 ), kinetic energy ($E$
 ) and magnetic field energy ($B^{2}$
 ) spectra as a function of wavenumber $k_x L_x$
 in both the injection range and inertial sub-range is summarized in tables 3 and 4 under run-17.
Plot of mass density ($\rho /\rho _L$ ) profiles at different times for fully varying viscosity and resistivity case; where $\beta ^{{\rm ini}}=5000$
 . Note the morphology of the RTI in this case exhibiting less Kelvin–Helmholtz formation than even the higher $Re_m=1105$
 , fully varying $Re$
 case presented in figure 22.

5 Summary and conclusion
In summary, the role of viscosity and resistivity on the RTI and magneto-RTI is studied for a high Atwood number and high plasma-$\beta$ regime in HED plasmas applicable to both laboratory and astrophysical settings. This work describes 2-D RTI evolution and resulting turbulence when surveying plasma-$\beta$
 and magnetic Prandtl number, $Pr_m$
 , for these regimes. The simulations have been performed using fluid simulation techniques based on the unstructured discontinuous Galerkin finite element method (Hesthaven & Warburton Reference Hesthaven and Warburton2007; Song Reference Song2020; Song & Srinivasan Reference Song and Srinivasan2021). Using a visco-resistive-MHD model, a detailed investigation of RTI in a 2-D planar geometry for experimentally and observationally relevant parameters is presented. It has been shown here that the inclusion of viscosity and resistivity in the system drastically changes the growth of the instability and modifies its internal structure on smaller scales. The presence of viscosity inhibits the development of small-scale structures and significantly modifies the morphology of the RTI spikes. On the other hand, the morphology of the RTI spikes is found to be independent of resistivity but it assists in the development of small-scale structures via the diffusion of the magnetic fields. The reduced magnetic field strength that results in time permits shorter-wavelength modes to grow. Considering fully varying viscosity and fully varying resistivity profiles in the simulation due to the strong dependence of viscosity and resistivity on the disparate temperature profile across the interface, the effect of both viscosity and resistivity is shown to be significant in the evolution of RTI in HED plasmas. Furthermore, it is also found that the dynamics of the magnetic field is explicitly independent of viscosity and likewise the resistivity does not affect the dynamics of enstrophy and kinetic energy. Also presented here is the power law scaling of enstrophy, kinetic energy and magnetic field energy over a wide range of viscosity and resistivity in both the injection range and the inertial sub-range of spectra. This could provide a useful tool for understanding RTI induced turbulent mixing in high Atwood number HED plasmas and could aid in interpretation of observations of RTI induced turbulence spectra.
Acknowledgements
All simulations in this paper were performed using the Advanced Research Computing (ARC) at Virginia Tech.
Editor William Dorland thanks the referees for their advice in evaluating this article.
Funding
This work was supported by the National Science Foundation under grant number PHY-1847905.
Declaration of interests
The authors report no conflict of interest.