Introduction
According to the World Health Organization, the term ‘malnutrition’ refers to a number of diseases, each with a specific cause related to one or more nutrients (for example, protein, iodine or calcium) and each is characterized by an imbalance between the supply of nutrients and energy and the body’s demand for these to ensure adequate growth, maintenance and body functions (de Onís et al., Reference De Onís, Monteiro, Akré and Glugston1993). The prevalence of under-nutrition varies between countries (de Onís et al., Reference De Onís, Blössner, Borghi, Morris and Frongillo2004). Various anthropometric indices are used to assess protein–energy malnutrition. Height-for-age portrays long-term growth, and a low height-for-age indicates ‘stunting’ through chronic malnutrition. Weight-for-height is particularly sensitive to acute malnutrition and a low weight-for-age is an indication of ‘wasting’. Weight-for-age represents a convenient synthesis of linear growth and body proportion, and a low value indicates ‘underweight’.
It has been estimated that more than half of young children in South Asia suffer from protein–energy malnutrition, which is about five times the prevalence in the Western Hemisphere, at least three times the prevalence in the Middle East and more than twice that in East Asia. India has the highest percentage of undernourished children in the world (Bellamy, Reference Bellamy2002). The third round of the National Family Health Survey (NFHS-3) conducted in India in 2005–2006 reported that the prevalences of stunting, wasting and underweight in under-5 children were 38.4%, 19.1% and 45.9% respectively (National Family Health Survey, 2005). Data for preschool children in India from the National Nutrition Monitoring Bureau (NNMB) survey conducted from 1973 to 2004 found the levels of stunting, wasting and underweight to be 51.5%, 15.0% and 54.9%, respectively (Gopalan, Reference Gopalan2010). The prevalence of overall severe malnutrition based on the percentile concept (<60% of the standard) was reported to be 8.2% from the same cohort. Although the NFHS-3 and NNMB data provided malnutrition prevalences in under-5 children, there are no available data for the incidence of malnutrition in school-age children. A cross-sectional survey by Raj et al. (Reference Raj, Sundaram, Paul, Sudhakar and Kumar2009) found the prevalence of underweight in children aged 5–14 years to be 38.4% in 2003 and 29.9% in 2005. They found the mean (SD) BMIs for 5-, 6- and 7-year-old males to be 13.8 (1.3), 14.2 (1.6) and 14.4 (1.9), but did not provide age-specific prevalences of stunting, wasting and underweight, and BMI classification was based on Centers for Disease Control (CDC) standards, so the data may not be comparable with other prevalence studies from India.
A study in Aligarh, India, reported that the incidence of grade III (severe) malnutrition was highest (27.7%) in 7- to 10-year-old children and the most common risk factors for malnutrition were low socioeconomic status, poverty and early age of employment (Ahmad & Talat, Reference Ahmad and Talat2013). A cross-sectional study in Meerut, India, which included 5- to 11-year-old children, reported that wasting was seen in 44.6% and stunting in 43.8% of children, and that malnutrition was associated with learning difficulties (Neelu et al., Reference Neelu, Bhatnagar, Garg, Chopra and Bajpai2009).
Although there have been a few cohort studies, there is still a dearth of incidence data on underweight and stunting among 5- to 7-year-old children, especially in south India. Data for this age group are very important as these would allow the effect of malnutrition on learning and physical development of this age group to be studied. The Mysore Parthenon Birth Cohort, one of few long-term follow-up data sets, involves 663 urban live births who are being followed up with the collection of detailed anthropometric data every 6–12 months, although the main interest of the study is to examine the long-term effects of maternal glucose tolerance and nutritional status on cardiovascular disease risk factors in the offspring (Krishnaveni et al., Reference Krishnaveni, Veena, Hill, Karat and Fall2014). However, this study did not provide the incidence of malnutrition over time and was urban-centric. An anthropometric profile of 1240 children from twelve rural schools in Aligarh, India, between the ages of 6 and 14 years showed that the prevalences of wasting and stunting were 32.76% and 79.73% respectively among boys, and 28.12% and 81.8% respectively among girls (Khalil & Khan, Reference Khalil and Khan2004). A study of 20 children from Banglore, India, who were malnourished according to height-for-age (stunting) and weight-for-height (wasting) indicators, reported that stunting could result in long-lasting cognitive impairment as compared with adequately nourished children between the age groups of 5–7 and 8–10 (Kar et al., Reference Kar, Rao and Chandramouli2008). However, although the prevalences of underweight and stunting were around 25%, a sample size of 20 subjects in each group is too small to draw any conclusion. A study of 122 randomly selected children between the ages of 5 and 11 from a paediatric out-patients’ department in Delhi found that lung function was significantly reduced in malnourished children (Faridi et al., Reference Faridi, Gupta and Prakash1995). A population-based survey conducted on a sample of 1860 children aged 5–12 years in Lahore, Pakistan, using BMI-for-age z-scores found that underweight and wasting indices were lower than the WHO and USCDC reference values (Mushtaq et al., Reference Mushtaq, Gull, Mushtaq, Abdullah, Khurshid and Shahid2012), and that 8.6% and 7.7% of boys and girls had severe stunting, and 10.1% and 10.1% had severe wasting, respectively. These prevalences were nearly 44 percentage points lower than values reported in India.
The aetiology of childhood malnutrition is not simple as it involves interactions between biological, cultural and socioeconomic factors (Baitun et al., Reference Baitun, Tahmeed, Kenneth and Iqbal2010). In most South Asian countries, poverty, high population density, the low status of women, poor antenatal care, high rates of low birth weight, unfavourable childcare practices and poor access to child health care are all contributors to the development of protein–energy malnutrition (WHO, 2012). Several factors, such as poverty and poor access to nutrition and health care, could be remedied within a short period. India has the dubious distinction of having a very high prevalence of low birth weight. A significant contributing factor to infant and child mortality – poor nutritional status during childhood – also has implications for adult economic achievement and health (Victoria et al., Reference Victoria, Adair, Fall, Hallal, Martorell, Richter and Sachdev2008). A study conducted in south India suggested that the risk factors for severe malnutrition were low mother’s education, low family income, more among boys, use of firewood or coal for cooking and defecation in an inside toilet/latrine (Jeyaseelan & Lakshman, Reference Jeyaseelan and Lakshman1997). However, the above studies did not present data on the incidence of the various type of malnutrition at pre-pubertal and pubertal ages and their risk factors related to the dynamics of malnutrition during their pre-pubertal years. Therefore, the objective of the present study was to study pre-pubertal nutrition in order to inform policies to help pubertal growth in India.
Methods
Study area and data collection
The urban unit of this study was in Vellore town, the headquarters of North Arcot Ambedkar district, whose population was 174,000 in 1981. It is an important business centre, with a large section of the population engaged in trade and commerce or government services. It is well connected with the neighbouring cities of Chennai and Bangalore by road and by railway. In the town 89% of the population were Hindus, about 8% were Muslims, 2% were Christians and roughly 1% other religions at the time of the study. The rural unit, K.V. Kuppam block, consists of 48 revenue villages with 84 hamlets. The area enjoys a tropical climate with an average yearly rainfall of 830 mm. Electricity is the prime source of power for lift irrigation, the principal crops being paddy, sugar cane, plantain and vegetables. Other crops include peanuts, sorgum, millet and ragi. The total population was 96,000 in 1981, of whom 97.9% were Hindus, 1.4% Muslims and 0.6% Christians. Of the total work force, about 47.2% were engaged in agriculture, 4.7% in unskilled work, 8.1% in skilled work and only 3.1% in business. Through a sample survey it was estimated that more than 75% of the total population were living below the poverty line, set at Rs 650 per capita annual income in 1981. The populations of the two study areas distinctly reflect rural and urban characteristics, and are expected to show differentials due to their socioeconomic status, food habits, sanitation and living environment. The rural and urban areas were homogeneous as far as social variables were concerned.
In 1982 seven localities and 22 villages were selected from the Vellore town and K.V. Kuppam development block sampling frames, respectively. All children aged 5–7 years were screened for signs of malnutrition by consultant paediatricians. Those with neurological disorders and gross physical deformities were excluded. A total of 2496 children (1197 rural; 1299 urban) were recruited for the study. Anthropometric data were collected by two anthropologists, and care was taken to reduce inter- and intra-observer variation by standardizing the procedure. The sample children were screened at baseline in September 1982 and followed up every six months until September 1990 – a total of sixteen times over a 9-year period. EPIINFO software was used to compute age- and sex-adjusted z-scores for follow-up and baseline anthropometric measurements (WHO, 2010). ‘Underweight’ was assessed based on BMI z-scores, and ‘stunting’ using height-for-age z-scores. Children were classified as having ‘normal’ weight if their BMI z-scores were >−2 standard deviations, being ‘mild/moderately’ underweight when their z-scores were between −2 and −3 standard deviations and ‘severely’ underweight if the z-scores were <−3 standard deviations (WHO, 2012). Similarly, height-for-age z-scores were also classified as normal, and mild/moderate and severe stunting.
Oral consent was obtained from the children’s parents (written informed consent was not mandatory at the time of data collection). The Christian Medical College IRB provided ethical approval. Only some hypothesized risk factors were considered for risk factor analyses; these were ‘defecation practices at household level’ (inside toilet/latrine; in the open fields), ‘type of fuel used for cooking in the house’ (firewood or cow dung or coal; gas or kerosene), ‘presence of a separate kitchen within the household’ (yes; no), ‘mother’s education’ and ‘father’s education’ (illiterate or literate but not completed primary school [illiterate/literate]; completed primary or middle school [primary/middle school]; and completed high school or college [high school/college]), and other household characteristics including ‘type of roof’, ‘type of floor’ and ‘type of house’. Other risk factors that were considered important were number of family members, birth order and consanguineous marriage. Confounding factors such as sex of the child and rural/urban residence were also considered for analyses.
Statistical analysis
Data were analysed using the Generalized Estimating Equation (GEE) with a cumulative odds model. As anthropometric measurements were measured for each child at different follow-up times, the GEE was used to make adjustments for the correlation between the outcomes within each child as these observations are no longer independent (Hanley et al., Reference Hanley, Negassa, Edwardes and Forrester2003; Ballinger, Reference Ballinger2004). Auto-regressive correlation structure was considered. Since the outcome is an ordinal datum categorized as ‘normal’, ‘mild/moderate’ and ‘severe’ underweight or stunting, a GEE cumulative odds model was applied (Twisk, Reference Twisk2003). This model allows the transition of the outcome from normal to mild/moderate or severe and vice versa. All the risk factors in the unadjusted analysis were considered for multivariable analyses. The data were analysed using SAS 9.2.
Results
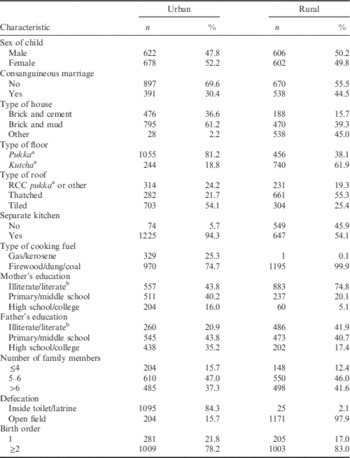
The study children’s baseline characteristics by area of residence are shown in Table 1. The sex ratio was well balanced in the rural area, while there was a 4.4 percentage point difference (52.2% girls vs 47.8% boys) in the urban area. Consanguineous marriages were more common in the rural (44.5%) than in the urban area (30.4%). Nearly 16% of the rural houses were built using brick and cement, while this was 36.6% in the urban area. About half of the houses in the rural area had thatched roofs, but this was 21.7% in the urban area. In the rural area 45.9% of houses did not have a separate kitchen, while only 6% did not have a separate kitchen in the urban area. Significantly more parents were in the ‘illiterate/literate’ category in the rural area than in the urban area. Ninety-eight per cent of the rural children and 16% of the urban children defecated in the open field.
Distribution of study children’s characteristics (risk factors) by area of residence at baseline, September 1982 (N=2496)

a A kutcha house is made up of mud with a hay stack or tin roof, and cannot normally withstand harsh weather; a pukka house is made of brick/block walls with a RCC (reinforced cement concrete) roof.
b Illiterate or literate but not completed primary school.
Underweight
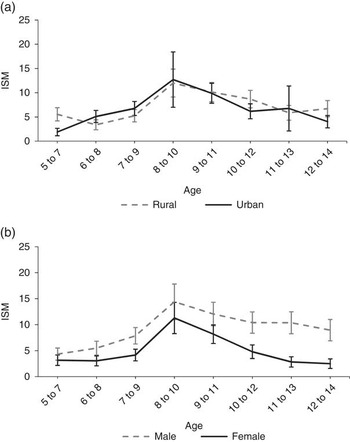
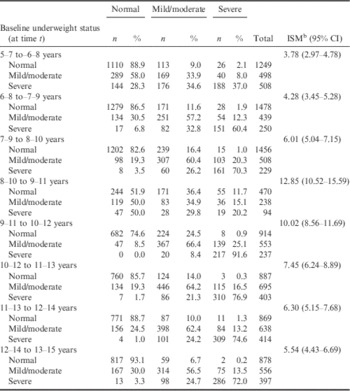
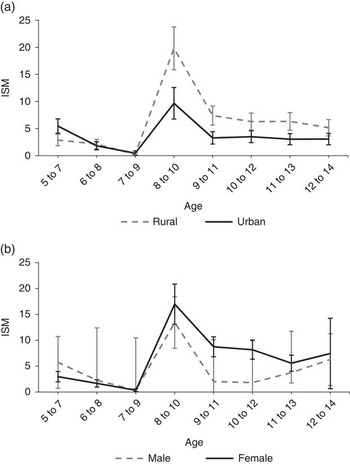
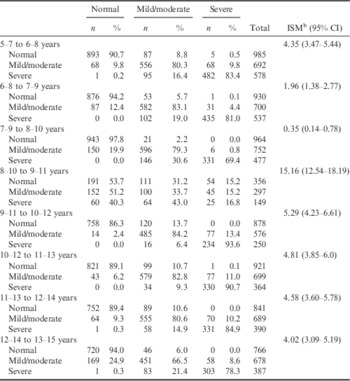
The prevalence of severe underweight at baseline was 22.5%, and that of moderate underweight was 21.7%. Male children had a higher prevalence of severe underweight (25%) (data not presented) than female children (19.9%). The prevalence of severe underweight in the rural area was 16.5%, while that in the urban area was higher at 28%. Table 2 presents the incidence of underweight for the sample children at each year of follow-up. The incidence of severe malnutrition (ISM) was measured as the number of new cases of severe under-nutrition in a population between time t and t+1. In the first year from baseline ISM was found to be around 4% (95% CI: 2.9–4.7). It was also about 4% (3.5–5.3%) in the second year, but increased to around 6% (5.0–7.1%) in the third year. The incidence of severe underweight in 9- to 11-year-old children, based on a sample of 802 available children (32%), was about 12.8% (10.5–15.6%). However, ISM increased from this age upwards reaching 10%, 7.5%, 6.3% and 5.5% when the children were 10–12, 11–13, 12–14 and 13–15 years old, respectively. Figure 1 shows the change in ISM over time by area of residence and sex. Male children had a higher incidence of severe underweight compared with female children, but there was no difference between rural or urban children.
Incidence of severe malnutrition (underweight) by area of residence (a) and sex (b).

Underweight incidence for sample children at each year of follow-up from baseline (t+1)Footnote a

a Based on BMI z-scores.
b ISM: incidence of severe malnutrition.
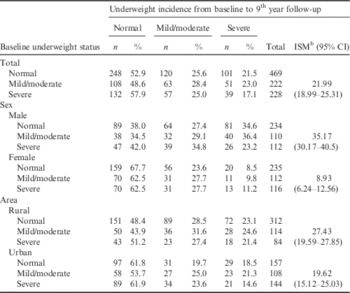
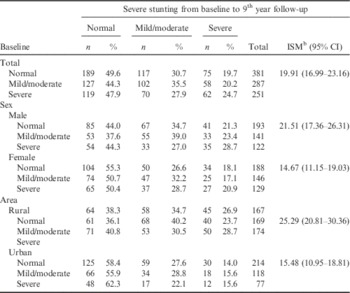
Table 3 presents the association between baseline nutritional status, underweight status and ISM to the 9th year follow-up by sex and area of residence. Of the female children who were normal at baseline, 8.5% were severely underweight at the end of the 9-year follow-up, while 34.6% of the male children were severely underweight, and the difference was statistically significant (p<0.001). Similarly, the male children who were severely malnourished at baseline remained at the same level after 9 years (23.2%), while this was 11.2% in female children, the difference being statistically significant (p<0.05). However, there was no significant difference between rural and urban areas in the incidence of severe underweight after 9 years.
Underweight incidence for sample children at baseline to 9th year follow-up by sex and area of residenceFootnote a

a Based on BMI z-scores.
b ISM: incidence of severe malnutrition.
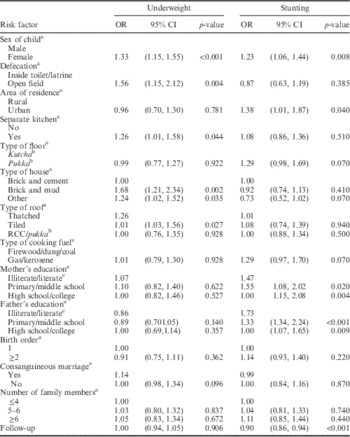
The adjusted risk factor analysis for pre-pubertal age (from 5–7 years to 8–10 years) is shown in Table 6. The adjusted analysis shows that on average boys had 1.3 (1.1–1.6) times higher odds for severe underweight compared with girls (p<0.001). Children who defecated in an inside toilet/latrine had 1.6 (1.2–2.1) times the odds of severe underweight compared with children who defecated in the open fields (p=0.004). Children living in a house where there was no separate kitchen had 1.3 (1.0–1.6) times higher odds of severe underweight compared with children living in houses where there was a separate kitchen (p=0.044). Children who lived in houses built from brick and mud had 1.7 (1.2–2.3) times higher odds of severe underweight compared with children who lived in houses built with brick and cement (p=0.002). On the other hand, children who lived in some other type of house had 1.2 (1.0–1.5) times higher odds of severe underweight compared with children who lived in houses built with brick and cement (p=0.035). Children who lived in houses with a thatched roof had 1.3 (1.0–1.6) times higher odds of severe underweight compared with children who lived in houses with reinforced cement concrete (RCC) or pukka roofs (p=0.027).
Stunting
The prevalence of severe stunting at baseline was 25.8%, and that of moderate stunting was 31.0%. Table 4 presents the incidence of stunting for the sample children at each year of follow-up, and Table 5 presents the impact of baseline stunting status to the 9th year follow-up by sex and area of residence. Male children had a higher prevalence of severe stunting (27.9%) than female children (23.5%). The prevalence of severe stunting in the rural area was 33.2%, while that in the urban area was lower (18.9%). The incidence decreased over the next couple of years until the children reached 8–10 years. That is, on average, if 100 children were followed up for a year, then at least 2.2 (1.7–3.0) would be severely stunted before their pre-pubertal age. But the incidence of severe stunting, based on 802 (32%) of children, was 15% when they were 9–11 years. However, the incidence reduced to around 5% from 10–12 years to 13–15 years: that is, during their pubertal period. Figure 2 shows the incidence of severe stunting by area of residence and sex. Rural children had a higher incidence of severe stunting compared with urban children, and female children had a higher incidence of severe stunting compared with male children over time.
Incidence of severe malnutrition (stunting) by area of residence (a) and sex (b).

Stunting incidence for sample children at each year of follow-up from baseline (t+1)Footnote a

a Based on height-for-age z-scores.
b ISM: incidence of severe malnutrition.
Stunting incidence for sample children at baseline to 9th year follow-up by sex and area of residenceFootnote a

a Based on height-for-age z-scores.
b ISM: incidence of severe malnutrition.
Table 5 shows that, overall, there was no association between baseline nutritional status and physical development over time. There was an increasing trend in those who were normal at baseline but with severe stunting after 9 years (19.7%) vs those who were severely stunted at baseline and with severe stunting after 9 years (24.7%), but the difference was not statistically significant. Of rural children who were normal at baseline, 26.9% had severe stunting at the end of 9 years, while the urban children had 14.0% severe stunting at the end of 9 years, the difference being statistically significant (p<0.01). Similarly, the rural children who were severely stunted at baseline remained at the same level after 9 years (28.7%), while this was 15.6% in urban children, the difference being statistically significant (p<0.05). However, there was no significant difference in severe stunting between male and female children after 9 years.
In the risk factor adjusted analyses for pre-pubertal age (from 5–7 years to 8–10 years), male children had higher odds (OR=1.2; 95% CI: 1.1–1.4) of severe stunting compared with females (p=0.008) (see Table 6). Children with mothers who were in the illiterate/literate category had 1.5 (1.1–2.0) times higher odds of severe stunting compared with children with mothers who had a high school or college education (p=0.02), whereas children with mothers who had primary or middle school education had 1.6 (1.2–2.1) times higher odds of severe stunting compared with children with mothers who had high school or college education (p=0.004). Children with a father who was in the illiterate/literate category had 1.7 (1.3–2.2) times higher odds of severe stunting compared with children with a father who had high school or college education (p<0.001). Children with a father who had primary or middle school education had 1.3 (1.1–1.7) times higher odds of severe stunting compared with children with a father who had high school or college education (p=0.009).
Adjusted GEE analysis for underweight and stunting by socio-demographic and household variables

a Interaction of follow-up with other risk factors was also performed, but is not presented in the table.
b A kutcha house is made up of mud with a hay stack or tin roof, and cannot normally withstand harsh weather; a pukka house is made of brick/block walls with a RCC (reinforced cement concrete) roof.
c Illiterate or literate but not completed primary school.
Discussion
This study used BMI and height-for-age z-scores to classify child nutritional status, as recommended by paediatricians and child psychiatrists. Very few previous studies have used BMI to classify malnutrition (Kain et al., Reference Kain, Uauy, Lera, Taibo and Albala2005; WHO, 2012). The study of child underweight and stunting (malnutrition) is particularly important as nutritional deficiency in the early years may result in a lower attention span, a decreased ability to concentrate and poor memory (Engle & Fernández, Reference Engle and Fernández2010) In other words, a deficiency of nutrients in children is known to have a severe impact on their cognitive development (Grantham-McGregor, Reference Grantham-McGregor1995). Hence it is important to study the risk factors for underweight and stunting among children (Behrman, Reference Behrman1996; Berkman et al., Reference Berkman, Lescano, Gilman, Lopez and Black2002; Black, Reference Black2003).
Very few studies have studied the prevalence of malnutrition (underweight, stunting and wasting) among children in the age group 5–7 years in India; most are of under-5 children. One study reported on malnutrition among children aged 6 years in Chile (Kain et al., Reference Kain, Uauy, Lera, Taibo and Albala2005). However, this only presented the prevalence of overweight and obesity. In the present study, using data from 1982 to 1990, the incidence of severe underweight was around 5% per year at pre-pubertal age and 8.4% at pubertal age, and male children had a higher risk of malnutrition than female children. This finding contradicts the findings from the 2005–06 NFHS-3 data, which showed that there was a difference in severe malnutrition (underweight) for males and females, with female children having a higher risk of malnutrition than males (National Family Health Survey, 2005–06). This study has shown that the incidence of severe underweight was lower in female than in male children. However, after nearly 20 years, based on the NFHS-3 results, especially on the sex differences, the trend was in opposite direction. This may suggest that sex discrimination in infant feeding and treatment-seeking practices has evolved over the two decades, with male child preference increasing over time.
This study showed that male children who were of normal weight or severely underweight at baseline had a significantly higher chance of being severely underweight after 9 years compared with female children. This could be due to the fact that female children attain pubertal changes much earlier than male children. This was also evident from the fact that there was no difference between rural and urban children.
The study had shown that, overall, there was no significant difference in severe stunting after 9 years between children who were normal at baseline and those who were severely malnourished. There could be two reasons for this. First, when children reach 14 or 15 years of age hormonal changes might alter their nutritional status. Second, nearly one-third of the children were lost to follow-up in nearly 5 years. Third, there was a significant difference between rural and urban children in severe stunting at baseline and after 9 years. Rural children had over a 15% difference compared with urban children in the incidence of severe stunting over 9 years. Thus the impact of baseline malnutrition was more significant in the rural children than in the urban children.
A cross-sectional study in Uganda conducted on children under 30 months of age showed that area of residence was an important factor for nutritional health. It reported that children from urban areas had better immunization rates than children from rural areas and thereby better health (Kikafunda et al., Reference Kikafunda, Walker, Collett and Tumwine1998). The present study also showed that children from rural areas had a higher risk of severe stunting than children living in urban areas. A finding contradicting the present study was that children from urban areas had a higher risk of malnutrition compared with children from rural areas, but it was also reported that the children from urban areas came from the slum areas of Kampala (Owor et al., Reference Owor, Tumwine and Kikafunda2000). The present study showed similar finding for severe underweight. The urban population is rapidly increasing in India with expectations of a possible better life, but the prevalence of underweight among under-five children reported in urban slums in India ranged from 52% to 68%, with Delhi recording a prevalence of 82%. This high prevalence is attributed to a lack of basic amenities such as safe drinking water, proper housing and drainage, which compromise the nutrition of those living in the urban areas (Ghosh & Shah, Reference Ghosh and Shah2004).
Two studies have reported malnutrition as a cause of poor family socioeconomic status (Owor et al., Reference Owor, Tumwine and Kikafunda2000; Baitun et al., Reference Baitun, Tahmeed, Kenneth and Iqbal2010). This study had a similar finding that was indirectly reflected by the ‘presence of a separate kitchen in the house’, which implies that, on average, if there is no separate kitchen in the house where the child lives then he/she has a higher chance of malnutrition (underweight and/or stunting) compared with a child living in a house with a separate kitchen. Another study reported that hygiene practice influences the risk of malnutrition among children (Kikafunda et al., Reference Kikafunda, Walker, Collett and Tumwine1998). The present study found that defecation within the premises (an inside toilet) or using a latrine was significantly associated with severe underweight but not with severe stunting. The absence of a significant association with severe stunting could be due to the fact that the incidence of this was very low during the follow-up period compared with the incidence of severe underweight, so the sample size for the incidence of severe stunting was not large enough. This may be the reason that defecation was not significant in the multivariate analyses. Despite the adjustment for area of residence in the multivariable analyses, defecation is only associated with underweight. The reason for children using a latrine being a risk category could be that the five-year prevalence of underweight was nearly the same for rural and urban areas (37%). However, the percentages of children defecating in the open field were 98% and 16.4% in rural and urban areas, respectively. Thus the higher prevalence of open field for defecation has confounded the results. That is, more children in the urban area used a latrine and also had a slightly higher incidence of severe underweight. Thus the overall analyses showed that latrine use was a risk factor, but this really meant urban children had a higher risk of severe underweight. However, the reverse has happened in the incidence of stunting, as the incidence of stunting was higher in the rural area.
The variables that are associated with infections, such as place of defecation, presence of a separate kitchen and type of house, are expected to be associated with acute malnutrition. These are, in general, infection-, hygiene- and respiratory-problem-related variables. However, risk factors such as parent’s education and area of residence were significantly associated with stunting. These are poverty-related variables. This has been discussed in relation to area of residence as a confounder. As a limitation, this study did not have any data on cognitive development to study the impact of child malnutrition while they are in school.
In conclusion, the data on the prevalence of malnutrition from the 2005-06 NFHS-3 were similar to those in the present study using data from 1982 to 1990, suggesting that the burden of malnutrition in school-age children in southern India has not changed after 30 years, with the incidence of severe malnutrition in children aged 10–15 years ranged from 10% to 6%. The risk factors for underweight and stunting were mostly poverty- and hygiene-related, which is reflected in the type of fuel used for cooking and defecation practice. The incidence of malnutrition was higher at pubertal ages than at pre-pubertal ages. Therefore it is recommended is that a similar prospective study is conducted in India in the near future, as the consequences of malnutrition for child intellectual development are detrimental during the pubertal period, and that school children should be screened periodically for malnutrition during the adolescent period and provided with nutritional intervention if necessary.
Acknowledgments
The authors sincerely acknowledge the Indian Council for Medical Research (ICMR) for funding this study. They are also grateful to the reviewer for their help with improving the presentation of this paper.