Introduction
The Scolytinae (Coleoptera: Curculionidae) are commonly known as “bark and ambrosia beetles.” Worldwide, 6530 species currently are recognised, with 582 species found in the continental United States of America and Canada. Of these species, 66 are exotic (Atkinson Reference Atkinson2025). Most scolytines breed in woody conifers and angiosperms (i.e., broadleaf or hardwood trees), but some develop in ferns, palms, monocots, and herbaceous plants (Wood Reference Wood1982; Kirkendall et al. Reference Kirkendall, Biedermann, Jordal, Vega and Hofstetter2015). Most scolytines infest weakened, injured, or recently cut host plants, but some will infest live, healthy plants, and others infest only dead plants (Wood Reference Wood1982; Raffa et al. Reference Raffa, Grégoire, Lindgren, Vega and Hofstetter2015). Most scolytines develop within the phloem (inner bark; i.e., true bark beetles) or xylem (wood) of their host plants, but some construct galleries and develop within seeds, fruit, cones, pith, or roots (Wood Reference Wood1982). Of species that infest and develop in xylem, the vast majority feed on fungal symbionts that grow on the gallery walls (ambrosia beetles), with only a few species appearing to feed only on wood (Kirkendall et al. Reference Kirkendall, Biedermann, Jordal, Vega and Hofstetter2015).
Scolytines are commonly transported between countries through international trade: all life stages can reside within the host plant. For example, about 60% of all beetle (Haack Reference Haack2006) or insect (Haack et al. Reference Haack, Britton, Brockerhoff, Cavey, Garrett and Kimberley2014) interceptions at ports of entry in the United States of America on wood packaging materials used in international trade were scolytines. The number of exotic scolytines established in the United States of America has steadily increased; for example, 29 were listed in 1982 by Wood (Reference Wood1982), 49 were known as of 2002 (Haack Reference Haack2001), 58 as of 2010 (Haack and Rabaglia Reference Haack, Rabaglia and Pena2013), and 66 as of 2025 (Atkinson Reference Atkinson2025). Similarly, many newly established exotic scolytines have been reported in several other world regions in recent years (Kirkendall and Faccoli Reference Kirkendall and Faccoli2010; Li et al. Reference Li, Johnson, Gao, Wu and Hulcr2021; Lantschner et al. Reference Lantschner, Gomez, Vilardo, Stazione, Ramos and Eskiviski2024).
In response to the dramatic acceleration of global trade and continuous increases in introductions of invasive species into the United States of America (Schmitz and Simberloff Reference Schmitz and Simberloff1997), in 2000, the United States Department of Agriculture (USDA) Animal and Plant Health Inspection Service (APHIS) and USDA Forest Service formed an Exotic Pest Rapid Detection Team to develop a programme for early detection of exotic forest insects and diseases (Rabaglia et al. Reference Rabaglia, Duerr, Acciavatti and Ragenovich2008). In 2001, the team, along with the American National Plant Board and the American National Association of State Foresters, implemented a pilot early detection and rapid response project for rapid detection of exotic bark and ambrosia beetles. The main goal of the pilot project was to develop the methods and framework for a national early detection and rapid response programme, including budgets for equipment and personnel. Nine target species and one genus (Xyleborus) of Scolytinae were selected, based on their high interception rates at American ports of entry and the availability of suitable attractant baits (Supplementary material, Table S1). The pilot project continued through 2006, with a more formal national programme beginning in 2007 (Rabaglia et al. Reference Rabaglia, Duerr, Acciavatti and Ragenovich2008, Reference Rabaglia, Cognato, Hoebeke, Johnson, LaBonte, Carter and Vlach2019).
In 2001, surveys were conducted at nine American maritime ports, with three trapping sites per port that were located either within the port itself or in nearby urban parks, woodlots, or wood-recycling centres. In 2001 and 2002, four multiple-funnel traps were deployed at each site, using different attractants in each trap: ethanol, α-pinene + ethanol, a three-component exotic Ips lure, and Chalcoprax (Rabaglia et al. Reference Rabaglia, Duerr, Acciavatti and Ragenovich2008). Starting in 2003, Chalcoprax was dropped from the programme because of cost, a single European supplier, and the lure’s narrow target range of primarily the Eurasian bark beetle, Pityogenes chalcographus (Linnaeus). Since then, the pilot programme and subsequent national early detection and rapid response programme has used three traps per site and focused on wooded areas near high-risk locations where solid wood packaging material was imported, stored, or recycled, and the USDA APHIS Cooperative Agricultural Pest Survey programme initiated nonnative woodborer and bark beetle detection surveys within high-risk locations at ports of entry (Rabaglia et al. Reference Rabaglia, Cognato, Hoebeke, Johnson, LaBonte, Carter and Vlach2019).
Although the initial pilot project targeted 10 species or genera, all captured scolytines were identified in recognition that many nontarget species would undoubtedly be captured. It was also recognised that using only three or four traps per site baited with different lures targeting particular species or groups would not capture the full diversity of scolytine species present. However, no published research was found at that time on optimal survey strategies, including the number of traps or the selection of lures, to maximise scolytine captures.
Numerous studies have investigated various factors that influence bark beetle and woodborer trap captures, including intrinsic features such as trap type, trap colour, traps’ slippery or sticky coatings, and wet or dry collection cups, as well as extrinsic survey characteristics such as habitat selection, horizontal and vertical trap placement, and recent site disturbances (Allison and Redak Reference Allison and Redak2017; Dodds et al. Reference Dodds, Sweeney, Francese, Besana and Rassati2024). Overall, results suggest that deploying more than one trap type or colour, using an array of different lures, and installing traps at different heights increases the richness and abundance of species captured, which should increase the probability of detecting nonnative species that may be present (Dodds et al. Reference Dodds, Sweeney, Francese, Besana and Rassati2024). Some studies have shown that species richness of bark and woodboring beetles increases as the number of traps deployed increases in detection surveys (Flaherty et al. Reference Flaherty, Gutowski, Hughes, Mayo, Mokrzycki and Pohl2019; Marchioro et al. Reference Marchioro, Rassati, Faccoli, Van Rooyen, Kostanowicz and Webster2020; Sweeney et al. Reference Sweeney, Gao, Gutowski, Hughes, Kimoto and Kostanowicz2025). Other studies have investigated how the probability of capturing target insects varies with trapping intensity (Manoukis and Hill Reference Manoukis and Hill2021; Fang et al. Reference Fang, Caton, Manoukis and Pallipparambil2022), and others have investigated the effective trapping radius of pheromone traps for various scolytines (Schlyter Reference Schlyter1992; Turchin and Odendaal Reference Turchin and Odendaal1996). However, little information is available on the optimal trapping intensity and selection of lures.
The study described herein was aimed at filling some of the knowledge gaps related to the design of generic surveillance surveys. Specifically, our objectives were to determine how scolytine richness (diversity) at a site varied with (1) trapping intensity, (2) habitat type, and (3) lure type.
Methods and materials
2002 study
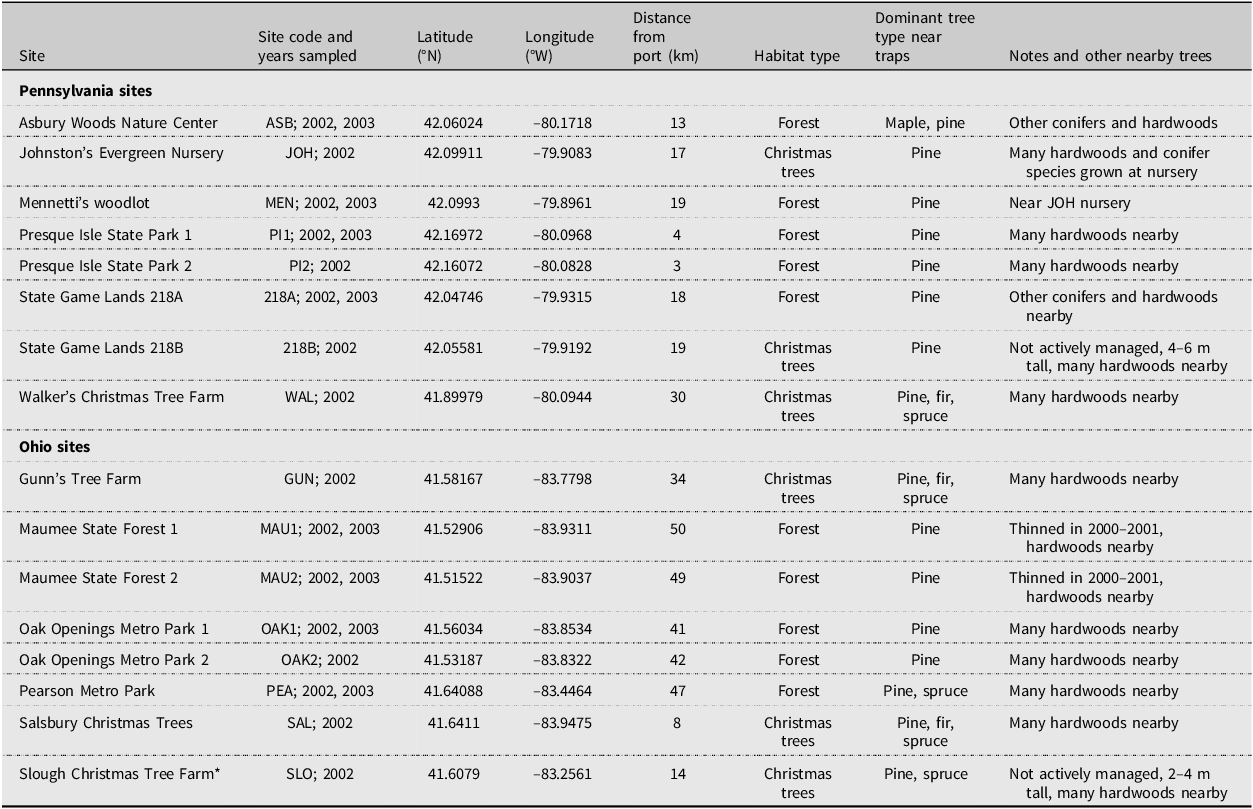
Sampling was conducted in 2002 at eight sites near Erie, Pennsylvania, and eight sites near Toledo, Ohio, United States of America (Table 1; Fig. 1). The Pennsylvania sites were within 3–30 km of the Port of Erie, and the Ohio sites were within 8–50 km of the Port of Toledo. Both ports receive international maritime shipments. The 16 sites included state parks, state game areas, private woodlots, nature preserves, tree nurseries, and Christmas tree farms. We required pine, Pinus spp. (Pinaceae), to be present at each site because pine is a major host plant for four of the exotic scolytines in the Great Lakes region that had been discovered during 1987–2001: Hylastes opacus Erichson in 1987 (Rabaglia and Cavey Reference Rabaglia and Cavey1994), Tomicus piniperda (Linnaeus) in 1992 (Haack and Kucera Reference Haack and Kucera1993), Hylurgus ligniperda (Fabricius) in 1994 (Hoebeke Reference Hoebeke2001), and Hylurgops palliatus (Gyllenhal) in 2001 (Haack Reference Haack2001). In addition to pine, several other species of conifers and hardwoods were present at each site and in nearby forests and woodlots. For the 10 forested sites, two had been thinned during 2000–2001, and the other eight had no recent management activities. Four of the six Christmas tree farms were actively growing and cutting pine Christmas trees each year, and the other two had been abandoned, with no active management and with pine trees 2–4 m tall at one site and 4–6 m tall at the other (Table 1).
Summary data for field sites used in 2002 and 2003

* This site (SLO) was dropped from the study due to vandalism.
Maps of the study sites: A, Lake Erie that show the location of Toledo, Ohio (T), and Erie, Pennsylvania (E); B, the eight field sites near Erie; and C, the original eight trapping sites near Toledo (the SLO site was later dropped due to vandalism). The stars in B and C indicate the location of the maritime ports in each city. Base maps are from Google Earth.

In each state, 16 traps were placed at seven of the sites, usually in a 4 × 4 grid pattern, and 64 traps were placed at one site in an 8 × 8 grid pattern. The spacing between traps was similar within a site but varied from 15 to 25 m among sites, depending on the site configuration and tree spacing. We used standard, black, 12-unit Lindgren funnel traps at all sites (Phero Tech Inc, Delta, British Columbia, Canada). The funnel traps were suspended from the upper portion of rebar poles that had a 90° bend near the top. The rebar was about 1.25 cm in diameter and 2.3 m in height to the bend at the top that extended 0.3 m horizontally. After inserting the bottom of the rebar pole into the ground, the funnel trap was attached to the top horizontal extension so that the upper portion of the funnel trap hung about two metres above ground. Two α-pinene (97–/3+) polyethylene bottles (combined release rate of 300 mg/day) and one ethanol polyethylene sleeve (280 mg/day; Phero Tech Inc.) were attached to each trap. No lubricant, such as Fluon, was applied to the funnel traps used in the present study.
The collection cup at the bottom of each funnel trap had a small screen that allowed rainwater to drain. Inside the bottom of each cup, we placed a circular piece of window screening that suspended the insects above any moisture that accumulated at the base. In addition, a few 1-cm × 1-cm pieces of No-Pest Strip (Spectrum Group, St. Louis, Missouri, United States of America), were placed inside each cup on top of the screen to quickly kill the trapped insects. The active ingredient in No-Pest Strips is dichlorvos, an organophosphate insecticide.
All traps were set up during 4–13 March 2002. Early March was selected because the soil is usually starting to thaw by then and because T. piniperda, the first pine-infesting scolytine to fly in spring in the Great Lakes region (Haack and Lawrence Reference Haack and Lawrence1995a, Reference Haack, Lawrence, Hain, Salom, Ravlin, Payne and Raffab; Kennedy and McCullough Reference Kennedy and McCullough2002), usually emerges by late March (Haack et al. Reference Haack, Poland and Heilman1998; Haack and Poland Reference Haack and Poland2001). We collected all insects from the traps on four occasions: 14–17 April, 7–9 May, 21–23 May, and 3–5 June 2002. The contents from each trap were placed in individual ziplock bags and labelled with site location, trap number, and date. We then cleaned each collection cup and drain screen, readjusted the circular screen and pieces of No-Pest Strip, and reattached the cup to the bottom funnel. The insects were returned to the USDA Forest Service laboratory on the campus of Michigan State University (East Lansing, Michigan, United States of America) and kept frozen until sorted to morphospecies. Almost all scolytines were identified to species with the assistance of four beetle taxonomists (see Acknowledgements). The data were recorded by state, site, trap number, collection date, species, and number of individuals.
2003 study
Eight of the original 16 sites were sampled again in 2003, four each in both Pennsylvania and Ohio (Table 1). All eight sites were forest sites and included the two sites that had been recently thinned in Ohio (MAU1 and MAU2). At each site, 28 traps were set up with four blocks of seven lure treatments: (1) α-pinene, (2) ethanol, (3) α-pinene + ethanol, (4) the three-component exotic Ips lure that targets the Eurasian bark beetle Ips typographus (Linneaus), (5) a two-component lure like Chalcoprax that targets the bark beetle Pityogenes chalcographus, (6) lineatin, which is the aggregation pheromone for the ambrosia beetle Trypodendron lineatum (Olivier), and (7) an unbaited control. The exotic Ips lure consisted of ipsdienol (50–/50+; bubble cap; release rate of 0.15 mg/day), cis-verbenol (80–/20+; bubble cap; 0.35 mg/day), and 2-methyl-3-buten-2-ol (no chiral centre; bubble cap; 10 mg/day). The P. chalcographus lure consisted of polyethylene pouches releasing a mixture of chalcogran and methyl 2,4-decadieneoate (MDA), which we will refer to as chalcogran + MDA (no release rate declared). Lineatin was released from 1-cm-long flex lures (no release rate declared). All lures were purchased from Phero Tech Inc. The lures were randomly assigned within each block. Depending on the configuration of the site, the blocks were set out in a continuous row or in a grid configuration. The traps were generally 15 m apart within a block, with blocks at least 25 m apart. The traps were set up during 14–18 March 2003, insects were collected every 3–4 weeks, and traps were taken down during 28–30 May 2003, following the same procedures as in 2002.
Data analyses – 2002 studies
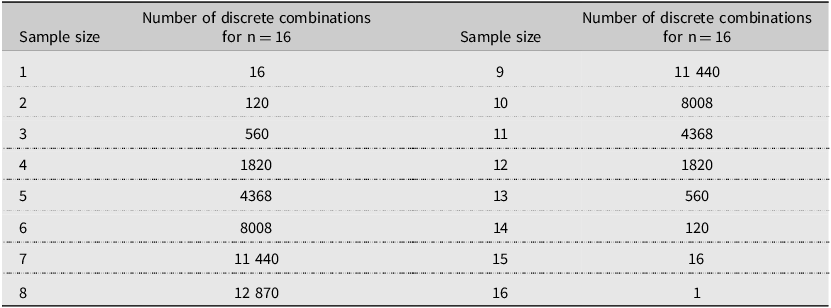
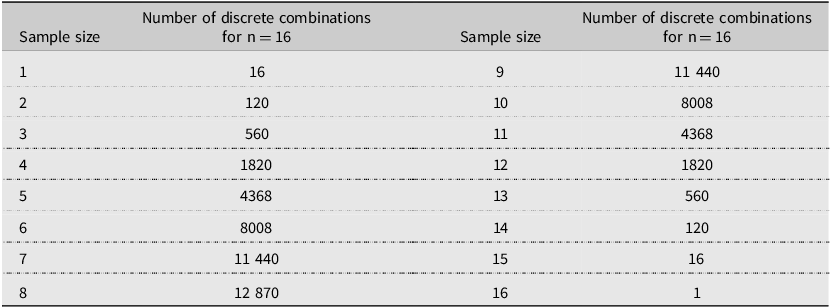
We first summarised the numbers of scolytine species found in each trap for the entire 2002 trapping season and categorised each species as either native or exotic to North America. Using the list of species that were found in each trap, we then calculated the number of discrete species that would have been found in every possible combination of traps when drawing samples sizes of 1–16 traps per site. This procedure, written in Fortran (programme by X.B.; Bronson Reference Bronson1992), performed 65 535 calculations per site (Table 2). For the two sites that had 64 traps, we arbitrarily selected the 16 traps located in the northwest quadrant of the trapping grid for analysis. The mean number of species detected was then calculated for each subsample size, ranging from one to 16 traps per site. These values were subsequently expressed as percentages of the total number of scolytine species found across all 16 traps at the same site. We then compared the average percentage values at selected trap densities (two, four, eight, and 12 traps) between states (Pennsylvania versus Ohio) and among habitat types (unthinned forests, thinned forests, and Christmas tree farms) to test for differences. After finding no significant differences, all sites were tested together in some analyses. For the two sites where 64 traps were deployed, we compared the average number of scolytine species collected in the initial block of 16 traps to all 64 traps. In addition, we calculated the mean number of scolytine specimens collected per trap at each site and then used these values to compare average catch by habitat type. Statistical analyses were conducted using one-way analysis of variance, followed by Tukey’s honestly significant difference test, a two-sided t-test, and the nonparametric Kruskal–Wallis rank sum test, followed by Dunn’s test (https://www.statskingdom.com). An alpha level of 0.05 was used in all analyses.
Number of discrete combinations of samples, ranging in size from 1 to 16 from a pool of 16 where order does not matter and there is no repetition. The total number of combinations in all rows is 65 535.
We also conducted bootstrap sampling of the 2002 trapping data, using 16 traps per site, to assess the effect of trapping intensity on scolytine diversity. Trap data from each site were resampled 1000 times using PROC SURVEYSELECT (SAS Institute 2012), randomly selecting between 1 and 20 traps with replacement for each species within each site. For each species, we calculated the probability of recovery at a given trapping intensity as the proportion of bootstrap iterations in which the species was detected. These probabilities were averaged across all species at each site and then across all sites. Sampling was conducted for all scolytines collected at each site and also separately for those species that were exotic or native to North America.
In addition, the season-long abundance data for all 16 (or 64) traps were pooled to calculate the Chao1 richness estimate for each field site. The Chao1 index estimates the total species richness of a community by calculating the number of new (undetected) species at a site based on the initial number of species observed at the same site and how many of these species were relatively rare, being represented by only one or two individuals each. In cases where the number of doubletons was zero, the bias-corrected formula was used where 1 was added to the number of doubletons to avoid division by zero (Colwell Reference Colwell2013). The number of observed species at each site was expressed as a percentage of the Chao1 estimate for the same site.
Data analyses – 2003 studies
Again, we initially summarised the numbers of scolytine species found in each trap for the entire 2003 trapping season. Each species was categorised as either native or exotic to North America. In addition, the typical larval feeding habit was assigned to each species: true bark beetles (phloem or phloeophagous), ambrosia beetles (fungus), wood feeding with no apparent ambrosia fungi (xylophagous), and other (e.g., cones, pith, and roots of nonwoody plants). We first calculated the mean number of all scolytines, true bark beetles, and ambrosia beetles for the four traps of the same lure type at each site. These mean values were then used in subsequent analyses to compare scolytine richness by lure type. Again, an alpha level of 0.05 was used, and testing was conducted using the Kruskal–Wallis rank sum test, followed by the Dunn’s test. In addition, the season-long abundance data for all traps of the same lure type were pooled across all sites and then used to calculate the Chao1 estimate of total species richness for each lure type. The lure types were then compared by dividing the observed number of species for each lure type by the highest Chao1 estimate for all lure types and expressing the values as percentages.
Results
2002 study
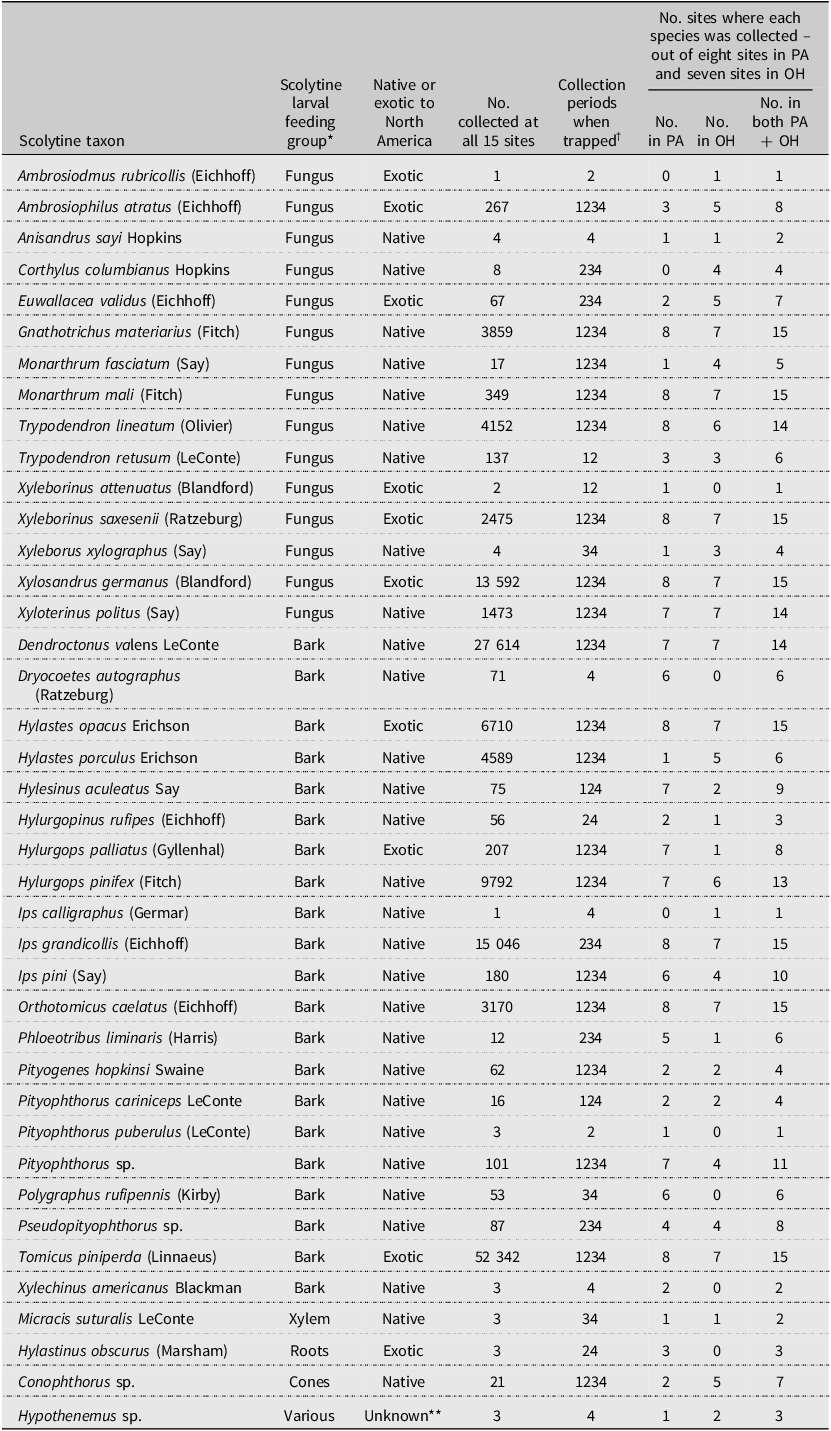
After dropping one site in Ohio due to vandalism (SLO; Table 1), the remaining 15 sites yielded 146 627 scolytine specimens, representing at least 40 species (Table 3). Two of the species collected in Ohio represent new state records, based on Atkinson (Reference Atkinson2025): Trypodendron lineatum and Trypodendron retusum (LeConte). Overall, more than 99.8% of the scolytines were identified to species, but most Conophthorus Hopkins, Hypothenemus Westwood, Pityophthorus Eichhoff, and Pseudopityophthorus Swaine individuals were identified only to genus. Two of the early detection and rapid response target bark beetle species (Supplementary material, Table S1; Hylurgops palliatus (Gyllenhal) at eight of the 15 sites and Tomicus piniperda at all 15 sites) and one exotic ambrosia beetle that formerly was in the genus Xyleborus (Ambrosiophilus atratus (Eichhoff)) were collected in 2002. Considering all 40 species, 19 were collected during each of the four trapping periods, and seven were collected during only one trapping period (Table 3).
Summary data for the scolytine species collected in Lindgren funnel traps baited with α-pinene and ethanol at 15 sites in Pennsylvania (PA) and Ohio (OH), United States of America, in 2002
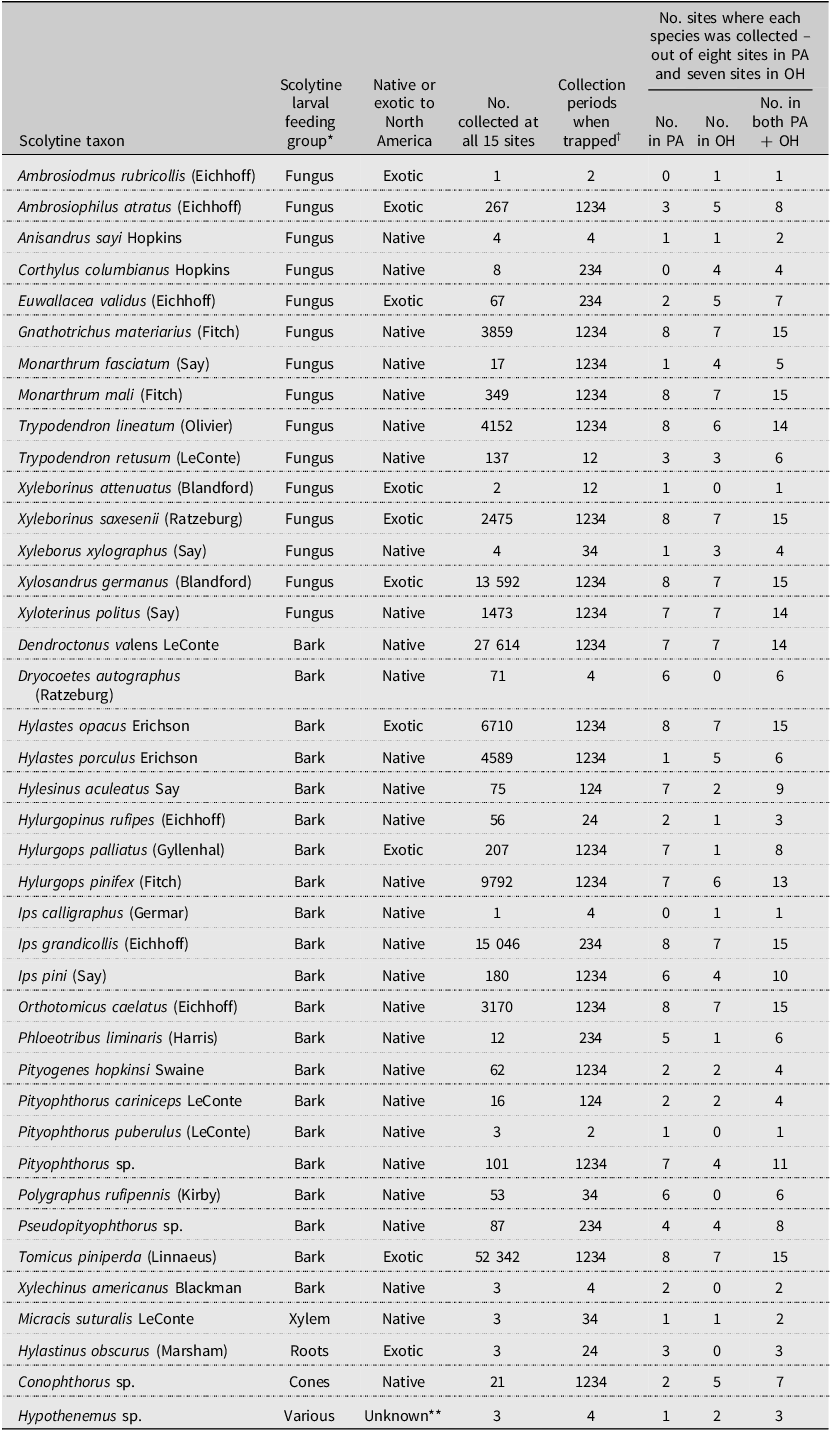
* Larval food: bark, mostly phloem; cones, pine cones typically, but some Conophthorus species feed in twigs; roots, typically roots of Fabaceae species such as Trifolium sp. (clovers); various, some species feed on phloem and others in pith of twigs; and xylem, wood.
** Both native and exotic species of Hypothenemus are found in North America.
† Traps were deployed in early March 2002. Beetles were collected four times: (1) 14–17 April, (2) 7–9 May, (3) 21–23 May, and (4) 3–5 June.
The five most commonly collected scolytines were Tomicus piniperda (35.7% of 146 627), Dendroctonus valens LeConte (18.8%), Ips grandicollis (Eichhoff) (10.3%), Xylosandrus germanus (Blandford) (9.3%), and Hylurgops rugipennis (Mannerheim) (6.7%; Table 3). By contrast, 10 species were represented by five or fewer specimens. Eight of the species were collected at all 15 sites, including Gnathotrichus materiarius (Fitch), Hylastes opacus Erichson, Ips grandicollis, Monarthrum mali (Fitch), Orthotomicus caelatus (Eichhoff), T. piniperda, Xyleborinus saxesenii (Ratzeburg), and Xylosandrus germanus. Of the 40 species, 13 were ambrosia beetles and 21 were true bark beetles. Some of the other species collected develop in cones, pith, roots, and xylem. Ten of the scolytine species collected in 2002 were exotic to North America and represented 51.6% of all collections that year. The number of exotic and native scolytine species collected at each site varied from 4 to 7 and from 10 to 18, respectively (Table 4).
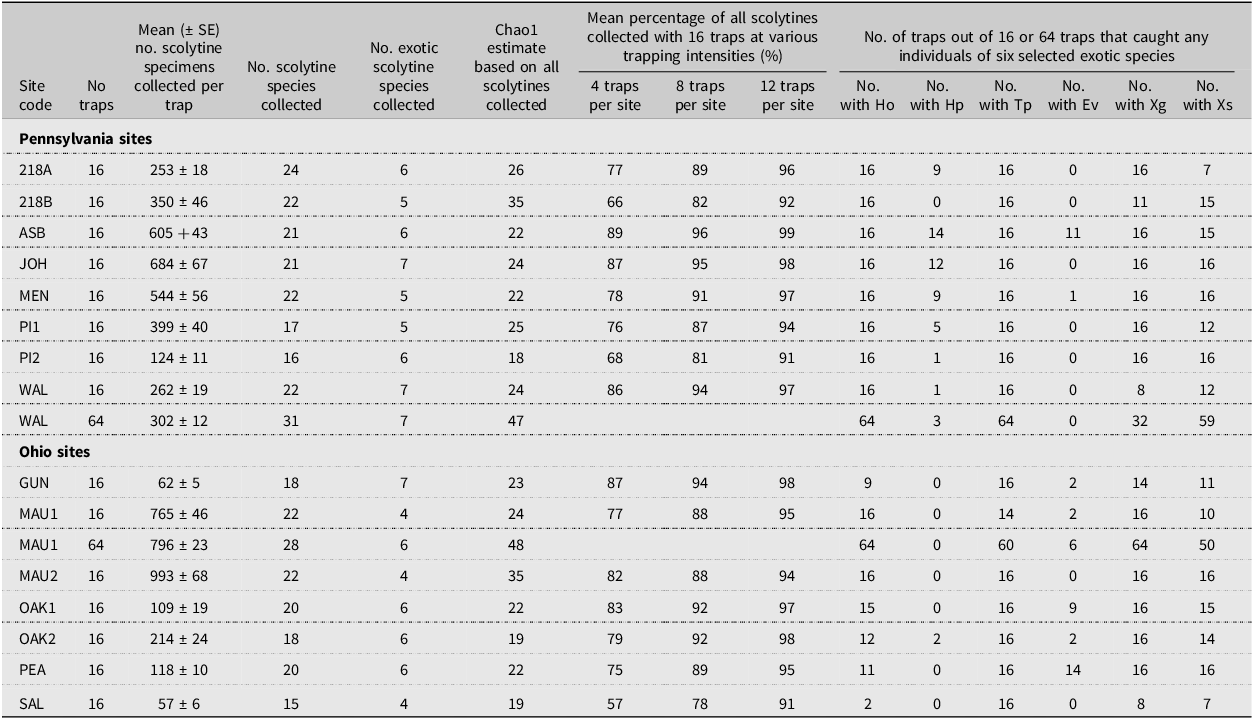
Number of scolytine species collected; number which were exotic to North America; Chao1 estimate of total scolytine richness; mean percentage of all scolytines collected with different numbers of traps per site; and number of traps that captured any of the six target exotic species at the 15 sites sampled in Pennsylvania and Ohio, United States of America, in 2002 using 16 traps per site, with two sites having 64 traps. Full names for each site are provided in Table 2. Species codes are as follows: Ho, Hylastes opacus; Hp, Hylurgops palliates; Tp, Tomicus piniperda; Ev, Euwallacea validus; Xg, Xylosandrus germanus; and Xs, Xyleborinus saxesen. SE, standard error
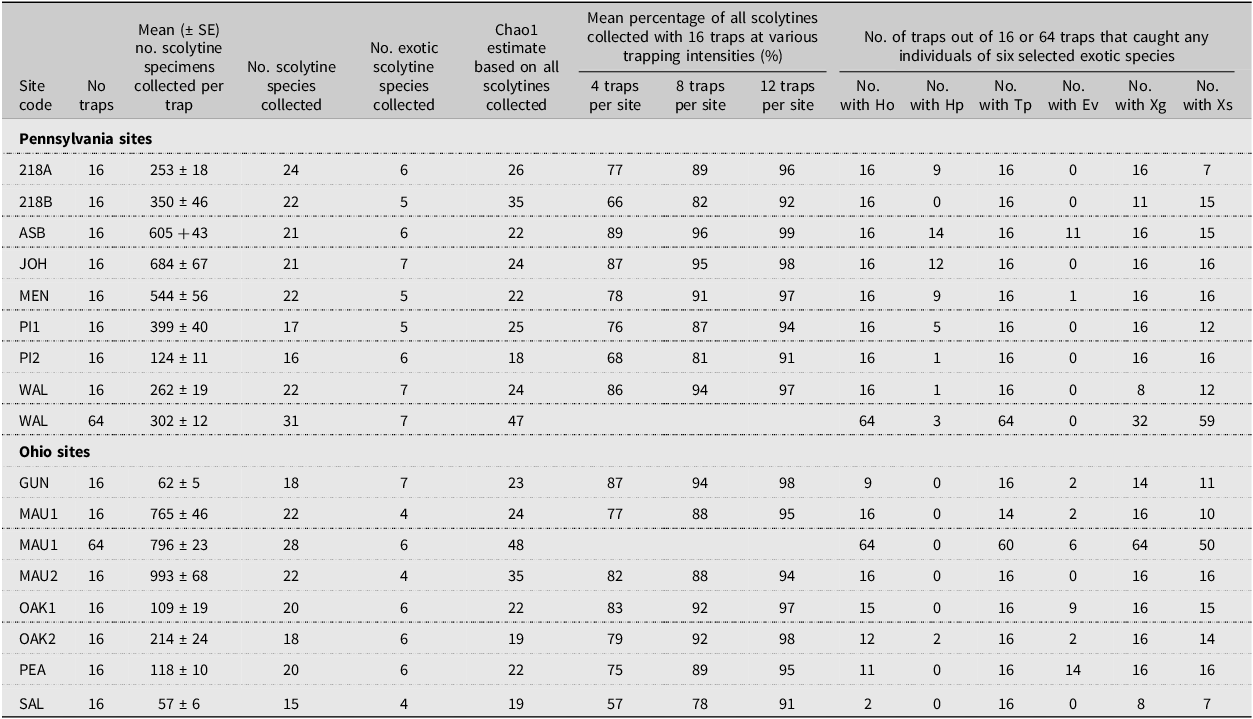
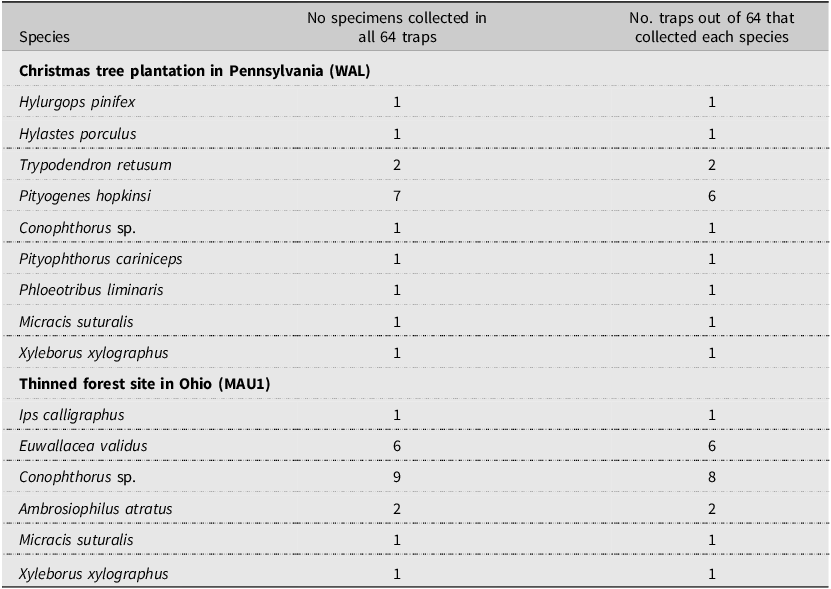
At the individual site level, considering first only 16 traps per site, 16–24 scolytine species were found at the eight Pennsylvania sites and 15–22 species were collected at the seven Ohio sites (Table 4). However, for the two sites where 64 traps were deployed, the number of species increased from 22 species when considering only 16 traps to 31 when all 64 traps were included at the Christmas tree site (WAL) in Pennsylvania, and from 22 species with 16 traps to 28 species with all 64 traps at the recently thinned forest site (MAU1) in Ohio (Table 5). The average number of species collected per site was significantly greater when 64 traps were deployed (29.5 ± 1.52) than when 16 traps were deployed (20.0 ± 0.7; H = 5.15, df = 1, P = 0.0233). Considering both locations (MAU1 and WAL), 10 of the 15 new species found when considering 64 traps per site were singletons, and for the five species where multiple specimens were collected, no more than two specimens were ever collected in any single trap.
List of scolytine species that were collected at two sites (MAU1 and WAL) when considering all 64 traps that were deployed in 2002 at those sites but were not collected in the initial 16 traps sampled from the northwest quadrants of the trapping grid at those sites

The mean percentage of scolytine species detected at all trapping intensities of 1–16 traps per site did not differ significantly between locations (states) or among habitats. For example, the Kruskal–Wallis test results for two traps per site were as follows: states – H = 0.12, df = 1, P > 0.72, and habitats – H = 0.97, df = 2, P > 0.61; for four traps per site: states – H = 0.0, df = 1, P = 1.00, and habitats – H = 0.05, df = 2, P > 0.97; for eight traps per site: states – H = 0.12, df = 1, P > 0.72, and habitats – H = 0.74, df = 2, P > 0.69; and for 12 traps per site: states – H = 0.01, df = 1, P > 0.81, and habitats – H = 0.72, df = 2, P > 0.69). When considering 16 traps per site, the average number of species collected per site did not differ significantly among the three habitats (H = 1.9, df = 2, P > 0.37).
The mean number of scolytine specimens collected per trap, considering 16 traps per site, varied from a low of 57 specimens per trap at one Christmas tree farm (SAL) to a high of 993 specimens at one of the thinned forest sites (MAU2; Table 4). When the overall means were compared between locations (states), no significant differences were found between the Pennsylvania sites (403 ± 68 specimens per trap) and the Ohio sites (331 ± 145 specimens per trap; t = 0.47, df = 13, P > 0.64). However, when considering the three habitat types, the mean number of scolytine specimens collected per trap was significantly higher in the thinned forest sites (879 ± 114) than in either the unthinned forest sites (296 ± 70) or the Christmas tree farms (283 ± 115; F = 8.4; df = 2,12; P < 0.013). For the two sites where 64 traps were deployed, no significant differences were found between the mean number of scolytine specimens collected per trap when comparing the initial block of 16 traps at those two sites to all 64 traps (see Table 4 for the site means; t = 0.61, df = 78, P > 0.543 for the thinned forest site MAU1; t = 1.66, df = 78, P > 0.127 for the Christmas tree farm WAL).
The Chao1 estimates for the number of new species based on 16 traps per site varied from 0 to 13 new species per site (Table 4). When the number of observed species at each site was expressed as a percentage of the corresponding Chao1 estimate, the resulting values ranged from 63% at two sites (218B, an abandoned Christmas tree farm; and MAU2, a thinned forest site) to 100% at one site (MEN, a conifer-dominated woodlot). When these 15 site percentages were averaged and compared by habitat type, no significant differences were found (H = 3.92, df = 2, P > 0.14). Similarly, no significant differences were found after pooling the thinned and unmanaged forest sites and comparing the forested sites to the Christmas tree farms (H = 2.55, df = 1, P > 0.11). For the two sites where 64 traps were deployed, the Chao1 estimate for the number of new species increased from two new species with 16 traps to 16 new species with 64 traps at a Christmas tree farm (WAL) and from 2 to 20 new species at a thinned forest site (MAU1; Table 4).
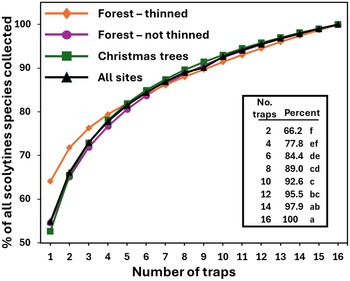
When considering all 15 sites together, using a single randomly selected trap at a site collected on average 55% of the scolytine species that were collected when using 16 traps per site (Fig. 2). Similarly, using four, eight, or 12 traps per site collected an average of 78, 89, and 95% of all scolytines, respectively. Statistically significant differences were found among the mean percentage values of the scolytines collected at varying trapping intensities (Fig. 2; Kruskal–Wallis, H = 103.1, df = 7, P < 0.0001). Mean percentage values of the scolytine species collected at different trapping intensities are also shown for each of the 15 individual sites in Table 4. When considering the species accumulation curves by habitat type, the three curves were similar (Fig. 2). Although the mean percentage values for the thinned forest sites were greater in absolute terms compared to those of the unthinned forest and Christmas tree sites at the lower trapping intensities (e.g., 1–4 traps per site; Fig. 2), the mean values did not differ significantly, even at an intensity of one trap per site (H = 1.34, df = 2, P > 0.51).The bootstrap analysis produced results that were broadly similar (Fig. 3C) to those calculated with the Fortran analysis (Fig. 2). For example, the mean proportion of species collected in the bootstrap analysis was 54% for one trap, 76% for four traps, and 95% for 20 traps per site. The most dramatic increase in the proportion of species recovered occurred when trapping intensity was increased from one to six traps. Including additional traps resulted in a more linear relationship between trapping intensity and the proportion recovered. When considering exotic and native species separately, the proportion of species recovered increased faster for exotic species (Fig. 3A) than for native species (Fig. 3B), especially at the lower trapping intensities. For example, the mean proportion of species collected with one trap per site was 76% and 45% for the exotics and natives, respectively, and similarly, 88% and 71% with four traps per site.
Mean percentage of scolytine species collected by habitat and overall, when increasing the trapping intensity per site from 1 to 16 traps and assuming that the total number of species collected with all 16 traps was the total scolytine richness present at each site. Results based on all 15 sites but using only the first block of 16 traps from the two sites where 64 traps were set out. Shown in the table section are the actual mean values for the even-numbered trapping intensities for the “all sites” curve and the associated Kruskal–Wallis and Dunn’s test results. Means followed by the same letter are not significantly different (H = 103.1, df = 7, P < 0.0001).

The proportion of scolytine species recovered as a function of trapping intensity for 15 locations near the ports of Erie, Pennsylvania and Toledo, Ohio, United States of America, in 2002 that were the following: A, exotic species; B, native species; or C, all species combined. Results are shown for each individual site, colour-coded by habitat type, as well as for the average for all sites combined. Proportions of species recovered at each site were estimated by conducting bootstrap sampling of each scolytine species recovered from the 16 funnel traps placed at each individual site.

2003 study
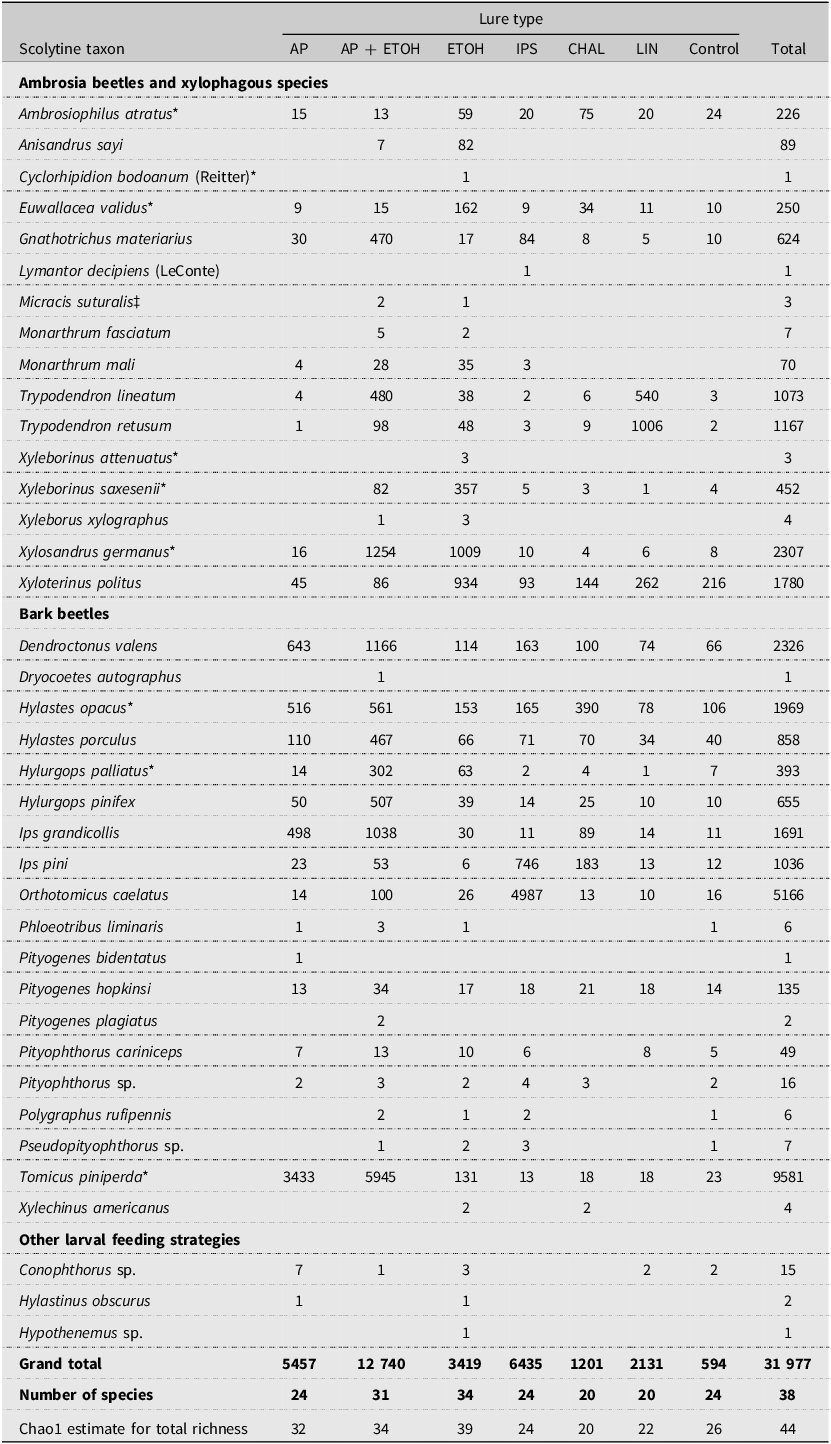
Overall, 31 977 scolytine specimens were collected from all eight field sites in 2003, representing at least 38 species (Table 6). Again, almost all specimens were identified to species, except for most individuals in the genera Conophthorus, Hypothenemus, Pityophthorus, and Pseudopityophthorus. The five scolytines most often collected were T. piniperda (30.0% of 31 977), O. caelatus (16.2%), D. valens (7.3%), X. germanus (7.2%), and H. opacus (6.2%). Two species collected in 2003 but not in 2002 were both ambrosia beetles, one being the exotic Cyclorhipidion bodoanum (Reitter) (one specimen from OAK1 in Ohio) and the other being the native Lymantor decipiens (LeConte) (one specimen from MAU1 in Ohio). Of the 38 species, 15 were ambrosia beetles and 19 were true bark beetles. Nine of the scolytine species collected in 2003 were exotic to North America and represented 47.5% of all collections that year.
Total number of specimens of each scolytine species collected at all eight sites in Pennsylvania and Ohio, United States of America, in 2003 by lure type: AP, α-pinene; AP + ETOH, α-pinene + ethanol; CHAL, chalcogran + MDA; ETOH, ethanol; IPS, exotic Ips lure; LIN, lineatin; and control, unbaited trap. Asterisks indicate species exotic to North America.

‡ Micracis suturalis feeds directly on xylem (xylophagous).
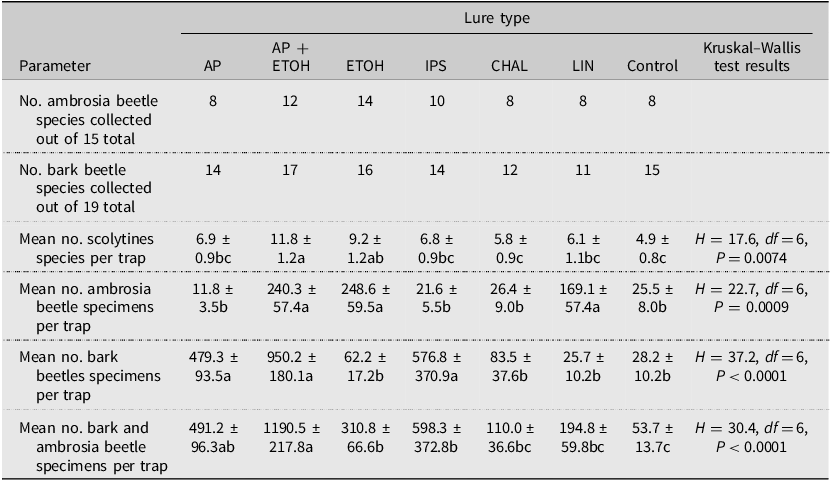
Overall, of the 38 species collected in 2003, the traps baited with ethanol (34 species) or α-pinene + ethanol (31 species) captured the most species, and the traps baited with chalcogran + MDA or lineatin captured the fewest (20 species each; Table 6). The Chao1 estimates for the number of new species for all traps of the same lure type varied from none (0) (exotic Ips lure and chalcogran + MDA) to eight (α-pinene). The total estimated scolytine richness collected was again highest for traps baited with ethanol (39 species), followed closely by α-pinene + ethanol (34 species) and α-pinene alone (32 species). After expressing the observed number of species for each lure type as a percentage of 39 (i.e., the highest estimated scolytine richness value for all lure types), the resulting values were 87% for ethanol, 79% for α-pinene + ethanol, 62% for both the α-pinene lure and the exotic Ips lure, and 51% for both the chalcogran + MDA lure and lineatin.
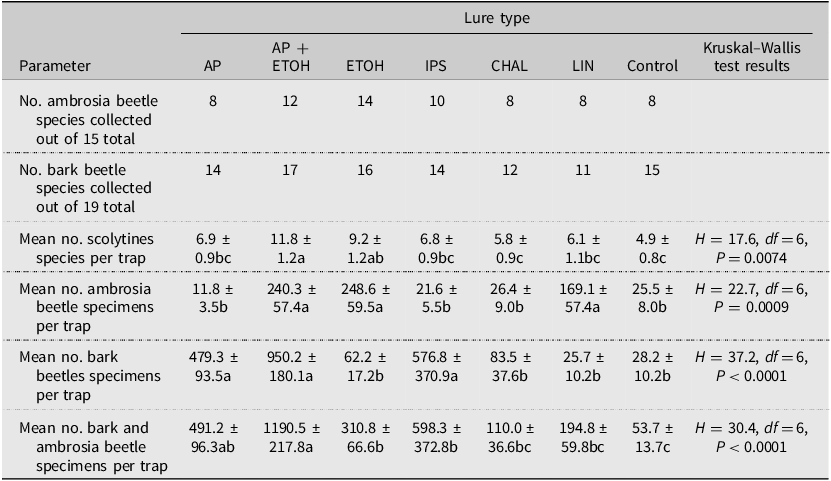
In absolute terms, traps baited with ethanol alone captured the most species of ambrosia beetles (14 out of 15) collected at all sites, and α-pinene + ethanol captured the most species of true bark beetles (17 of 19) collected at all sites (Table 7). The average number of scolytine species collected per trap was highest in traps baited with both α-pinene + ethanol or with ethanol alone. When considering the total number of scolytine individuals collected per trap, the most attractive lures varied between ambrosia beetles and bark beetles. For ambrosia beetles, the most attractive lures were ethanol, α-pinene + ethanol, and lineatin. By contrast, the most attractive lures for true bark beetles were α-pinene + ethanol, α-pinene, and the exotic Ips lure. Considering all scolytine species together, traps baited with α-pinene + ethanol captured the most specimens on average in absolute terms.
Numbers and means ± standard error of ambrosia beetle and bark beetle scolytine species or specimens collected in Pennsylvania and Ohio, United States of America, in 2003 by lure type. Data from all eight sites have been combined. Lure abbreviations are as follows: AP, α-pinene; AP + ETOH, α-pinene + ethanol; CHAL, chalcogran + MDA; ETOH, ethanol; IPS, exotic Ips lure; LIN, lineatin; and control, unbaited trap. Means followed by the same letter within rows are not significantly different.
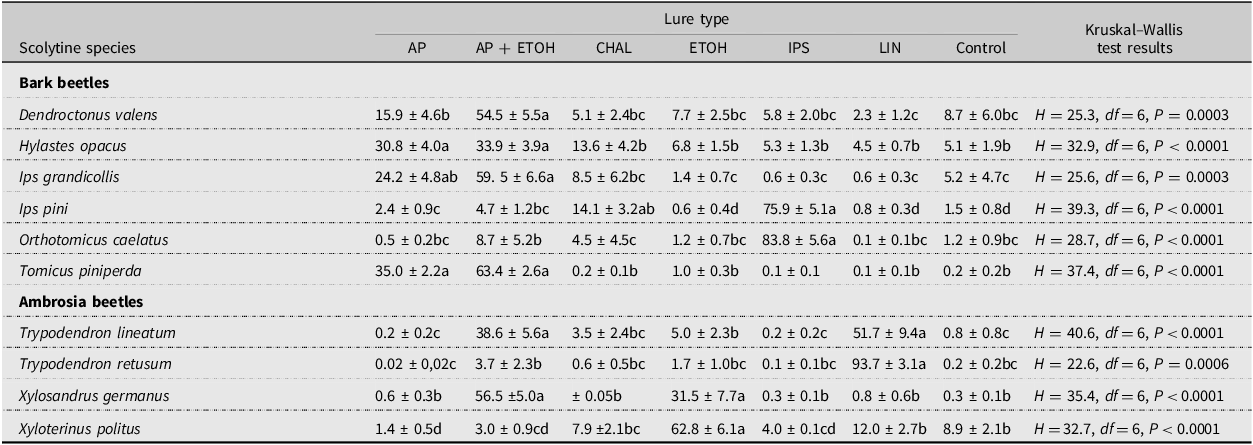
Wide variation occurred regarding which lure was most attractive to the 10 most common scolytines collected in 2003 (Table 8). For the six bark beetles, the combination of α-pinene + ethanol was most attractive to D. valens; using either α-pinene alone or in combination with ethanol was most attractive to H. opacus, I. grandicollis, and T. piniperda; and the exotic Ips lure was most attractive to I. pini and O. caelatus. Similarly, for the four ambrosia beetles, lineatin was the most attractive lure for T. retusum; lineatin and α-pinene + ethanol were best for T. lineatum; ethanol was best for X. politus; and ethanol or α-pinene + ethanol was most attractive for X. germanus.
Means ± standard error percent (%) of individuals collected per trap in Pennsylvania and Ohio, United States of America, in 2003 for the 10 most often collected scolytines by lure type. Data from all eight sites have been combined. Lure abbreviations are as follows: AP, α-pinene; AP + ETOH, α-pinene + ethanol; CHAL, chalcogran + MDA; ETOH, ethanol; IPS, exotic Ips lure; LIN, lineatin; and control, unbaited trap. Means followed by the same letter within rows are not significantly different.

Discussion
Generic surveillance surveys for bark- and wood-infesting insects usually target Scolytinae and Cerambycidae (Dodds Reference Dodds2011; Augustin et al. Reference Augustin, Boonham, De Kogel, Donner, Faccoli and Lees2012; Poland and Rassati Reference Poland and Rassati2019; Brockerhoff et al. Reference Brockerhoff, Corley, Jactel, Miller, Rabaglia, Sweeney, Allison, Paine, Slippers and Wingfield2023). Typically, three or four traps are set up at each survey site, with each trap baited with a different lure or with a combination of two lures (Petrice et al. Reference Petrice, Haack and Poland2004; Brockerhoff et al. Reference Brockerhoff, Jones, Kimberley, Suckling and Donaldson2006; Rabaglia et al. Reference Rabaglia, Duerr, Acciavatti and Ragenovich2008; Gandhi et al. Reference Gandhi, Cognato, Lightle, Mosley, Nielsen and Herms2010; Pfammatter et al. Reference Pfammatter, Coyle, Journey, Pahs, Luhman, Cervenka and Koch2011). In Canada, during the early 2000s, generic surveillance surveys were conducted with three traps each of three different lure types or lure combinations (nine traps total per site; Thurston et al. Reference Thurston, Slater, Nei, Roberts, Hamilton, Sweeney and Kimoto2022). By contrast, in some surveys, a “multi-lure” approach is used in which four or more different lures are placed on a single trap (Rassati et al. Reference Rassati, Petrucco Toffolo, Roques, Battisti and Faccoli2014, Reference Rassati, Faccoli, Petrucco Toffolo, Battisti and Marini2015; Fan et al. Reference Fan, Denux, Courtin, Bernard, Javal and Millar2019; Mas et al. Reference Mas, Santoiemma, Lencina, Gallego, Pérez-Laorga, Ruzzier and Rassati2023; Roques et al. Reference Roques, Ren, Rassati, Shi, Akulov and Audsley2023). The multi-lure approach is often used in surveys for cerambycids and scolytines, two groups for which several pheromones are available. The multi-lure approach can reduce operational costs by lowering the number of traps deployed at each site, while still attracting many target species (Rassati et al. Reference Rassati, Petrucco Toffolo, Roques, Battisti and Faccoli2014). However, depending on which lures are placed together, attraction could be enhanced or inhibited in multi-lure traps. For example, adding ethanol lures often increases attraction for some scolytines, whereas adding α-pinene lures can inhibit attraction to various hardwood-infesting ambrosia beetles (Phillips et al. Reference Phillips, Wilkening, Atkinson, Nation, Wilkinson and Foltz1988; Schroeder and Lindelöw Reference Schroeder and Lindelöw1989; Miller and Rabaglia Reference Miller and Rabaglia2009).
Besides the cost of traps and lures, another major expense involves the salaries for the personnel involved in servicing traps in the field, sorting the collected insects, and identifying them to species (Rabaglia et al. Reference Rabaglia, Duerr, Acciavatti and Ragenovich2008). For this reason, considering that funding is often limited, managers usually opt to survey more sites rather than place more traps at a single site. Nevertheless, our results indicate that using a single trap baited with α-pinene + ethanol will likely capture only 50–60% of the scolytine species present. Increasing the number of similarly baited traps to four traps per site will probably collect 70–80% of the species. These estimated percentages are based on the total number of species we captured with a trapping intensity of 16 traps per site. Given that more species were detected when the number of traps increased from 16 to 64 at two sites, and that the Chao1 estimates predicted more species at nearly all sites, the aforementioned percentages are likely overestimates when considering all scolytine species that occur at any site.
Our bootstrapping analyses indicated that adding up to six traps provided the largest increases in the proportion of scolytines detected but that the number of species captured continued to increase at a diminishing rate with additional traps beyond six. Similarly, in a recent multi-country study, Sweeney et al. (Reference Sweeney, Gao, Gutowski, Hughes, Kimoto and Kostanowicz2025) reported that deploying 8–9 traps per site was not sufficient to detect all Buprestidae, Cerambycidae, and Scolytinae species present when traps were baited with the same multi-lure combination (an ethanol lure plus five separate cerambycid aggregation sex pheromones) but varied in trap colour and canopy position.
Furthermore, our bootstrapping analyses indicated that the proportion of recovered species increased more quickly as the number of traps increased for exotic species than for native species (Fig. 3). This finding could reflect (1) the relatively low number of exotic species detected per site (4–7) compared with the number of native species (10–18) and (2) that many of the exotic species were already widely distributed at the time of our study, being found at most sites (Tables 3 and 4). For example, of the 10 exotic species detected in 2002, four were found at all 15 sites and three were found at 7–8 sites (Table 3). If, however, most of the exotic species detected in 2002 had been relatively rare, then the proportion of recovered exotics would likely have increased more slowly as trapping intensity increased.
In the present study, using α-pinene + ethanol, compared with α-pinene alone, increased the number of scolytine species collected. This pattern has been shown in many other studies (Petrice et al. Reference Petrice, Haack and Poland2004; Miller and Rabaglia Reference Miller and Rabaglia2009; Gandhi et al. Reference Gandhi, Cognato, Lightle, Mosley, Nielsen and Herms2010; Hartshorn et al. Reference Hartshorn, Coyle and Rabaglia2021). Variation in which lure was most attractive to individual scolytine species was expected, given that some species infest primarily conifers and others infest hardwoods, some infest hosts in particular physiological conditions or specific decay classes, and some species are strongly attracted to host kairomones (e.g., α-pinene and ethanol), while others respond most strongly to pheromones (Raffa et al. Reference Raffa, Grégoire, Lindgren, Vega and Hofstetter2015). Rabaglia et al. (Reference Rabaglia, Duerr, Acciavatti and Ragenovich2008) found responses similar to ours for species of Hylastes Erichson, Ips DeGeer, and Xylosandrus Reitter in their attraction to traps baited with ethanol alone, α-pinene + ethanol, and the exotic Ips lure. Petrice et al. (Reference Petrice, Haack and Poland2004) also reported varying responses by several scolytines to different lures, including β-pinene. Although chalcogran + MDA attracted few new species in our 2003 study, had P. chalcographus been present in our survey area, we would likely have had a better chance of collecting some by using this species-specific pheromone lure. Lure selection therefore depends on the target species and the goals of each survey. It is also noteworthy that individuals of more than 23 different scolytine species were collected in the unbaited control traps in our 2003 study, indicating that the funnel traps provide visual cues to many scolytines when in flight. Brockerhoff et al. (Reference Brockerhoff, Jones, Kimberley, Suckling and Donaldson2006) observed a similar effect in their nationwide survey in New Zealand.
It is not known whether the number of scolytine specimens collected per trap at the two sites where 64 traps were deployed in the present study was reduced by the large number of traps in a relatively small area. Such a scenario would be possible when the number of scolytines is limited. However, when comparing the average catch per trap at these two sites with the other 13 sites, they ranked second and eighth highest in catch rate (Table 4).
It is of interest that the pine-infesting bark beetle T. piniperda was the most frequently collected scolytine in both of our survey years. This finding likely reflects that (1) we sampled during the entire T. piniperda spring flight season in both years, (2) only early-season collections were made (March to early June), (3) pine was present at all sites, (4) T. piniperda was still actively spreading through both Pennsylvania and Ohio at the time of our surveys, and (5) traps were baited with α-pinene, which is an attractive lure for T. piniperda (Haack and Poland Reference Haack and Poland2001). In fact, nearly every trap collected some T. piniperda in 2002 (238 of 240 traps, considering 16 traps per site; Table 4). At the two sites where 64 traps were deployed in 2002, T. piniperda was captured in 60 of 64 traps at the thinned forest site in Ohio (MAU1) and in all 64 traps at the Christmas tree farm in Pennsylvania (WAL). If we had trapped throughout the entire summer in 2002, more scolytine species likely would have been collected and some likely would have been more abundant than T. piniperda.
Overall, 48–52% of all scolytines collected in 2002 and 2003 were exotic species. A similar pattern has been reported in many other generic surveillance surveys. For example, Gandhi et al. (Reference Gandhi, Cognato, Lightle, Mosley, Nielsen and Herms2010) reported that 60% of the individual scolytines collected at nine sites in Ohio were exotic species. Similarly, Rabaglia et al. (Reference Rabaglia, Cognato, Hoebeke, Johnson, LaBonte, Carter and Vlach2019) stated that 54% of the 840 000 scolytine specimens collected in the nationwide American early detection and rapid response surveys during 2007–2016 were exotic.
We collected similar numbers of scolytine species in both forested sites (16–24) and Christmas tree farms (15–22) in 2002 (Table 4), suggesting that both types of habitats are highly suitable as survey sites, especially when many of the target species infest conifers. Several woodlots dominated by hardwood trees were located near each of the sampled Christmas tree farms, making hardwood-infesting scolytines likely near the Christmas tree farms, where mostly pine, fir, Abies spp. (Pinaceae), and spruce, Picea spp. (Pinaceae) trees were grown. Dodds (Reference Dodds2011) reported that sites with recent disturbance had the highest scolytine abundance and richness. In Ohio, we found that the two thinned forest sites (MAU1 and MAU2) had the highest species counts (both 22) and Chao1 estimates (24 and 35) of all seven Ohio sites (Table 4), indicating that forest sites with recent thinning or logging activity are good survey sites. Nevertheless, Christmas trees farms can also be considered disturbed sites because some trees are cut each autumn, providing fresh stumps and often cull piles of unsold cut trees that can be infested the following spring. In Italy, where Rassati et al. (Reference Rassati, Faccoli, Petrucco Toffolo, Battisti and Marini2015) trapped scolytines and other borers at 15 maritime ports and in nearby forests, more exotic scolytines were detected in hardwood forests than in those dominated by conifers.
Results from our 2002 trapping efforts in Pennsylvania and Ohio provided some evidence on the historical spread of four exotic conifer-infesting bark beetles that had been discovered in the Great Lakes region during the 15 years before the current study. Hylastes opacus, which was first reported in 1987 in central New York State (Rabaglia and Cavey Reference Rabaglia and Cavey1994), was trapped at all 15 study sites in the present study (Table 3). Tomicus piniperda, which was first reported in Ohio in 1992 but was also found in five other neighbouring states, including Pennsylvania, by the close of 1992 (Haack and Poland Reference Haack and Poland2001), was also found at all 15 sites in 2002. Hylurgops palliatus, which was first reported near Erie, Pennsylvania, in 2001 (Haack Reference Haack2001), was found at seven of eight sites in Pennsylvania in 2002 but at only one of the seven sites in Ohio. By contrast, Hylurgus ligniperda, which was first trapped near Rochester, New York, in 1994 (Hoebeke Reference Hoebeke2001; Petrice et al Reference Petrice, Haack and Poland2004), was not collected at any of the 15 study sites in 2002. In fact, as of 2004 (Petrice et al. Reference Petrice, Haack and Poland2004; Liu et al. Reference Liu, Bohne, Lee, Flint, Penrose and Seybold2007) and 2025 (Atkinson Reference Atkinson2025), H. ligniperda has been reported as established only in the two American states of New York and California.
Besides the number of traps and the types of lures deployed at a site, many other factors can affect the numbers and diversity of scolytines collected in baited traps (Allison and Redak Reference Allison and Redak2017; Poland and Rassati Reference Poland and Rassati2019; Brockerhoff et al. Reference Brockerhoff, Corley, Jactel, Miller, Rabaglia, Sweeney, Allison, Paine, Slippers and Wingfield2023; Dodds et al. Reference Dodds, Sweeney, Francese, Besana and Rassati2024). Allison and Redak’s (Reference Allison and Redak2017) meta-analysis indicated that panel traps collected more specimens than funnel traps, that adding slippery substances like Fluon to the trap surface increased trap catch, that wet cups collected more specimens than dry cups, and that trapping conducted both near the ground and in the canopy collected more species. If we had treated our traps with Fluon, we may have captured more specimens of certain scolytines, such as the relatively large bark beetle, Ips calligraphus (Germar) (Allison et al. Reference Allison, Johnson, Meeker, Strom and Butler2011). Trap colour has also been shown to be an important factor, with black traps usually superior to other colours for attracting most scolytines (Allison and Redak Reference Allison and Redak2017; Santoiemma et al. Reference Santoiemma, Battisti, Courtin, Curletti, Faccoli and Feddern2024) but not always (Sweeney et al. Reference Sweeney, Gao, Gutowski, Hughes, Kimoto and Kostanowicz2025), and in some cases, colour preferences were shown to vary among scolytine species (Cavaletto et al. Reference Cavaletto, Faccoli, Marini, Spaethe, Magnani and Rassati2020). Overall, our results indicate that more scolytine species are collected when more traps and more types of lures are deployed at each site; however, including additional traps above five or six resulted in smaller incremental increases in the number of new species collected. To optimise costs, 4–6 traps baited with a combination of lures that target a broad range of scolytines should capture a high proportion of the species present at each site. Although large-scale generic surveillance programmes can be costly, they are valuable in enabling early detection of new exotic species, and if control is warranted, early detection can increase the likelihood of successful eradication or containment programmes (Liebhold et al. Reference Liebhold, Berec, Brockerhoff, Epanchin-Niell, Hastings and Herms2016; Brockerhoff et al. Reference Brockerhoff, Corley, Jactel, Miller, Rabaglia, Sweeney, Allison, Paine, Slippers and Wingfield2023). Moreover, trapping at the same sites on a multi-year cycle can increase the likelihood of recovering less abundant species and, for any new exotic detected, help to estimate when the establishment took place.
Supplementary material
The supplementary material for this article can be found at https://doi.org/10.4039/tce.2025.10033.
Acknowledgements
The authors thank Rachel Disipio, Greg Hobbs, Deborah Miller, and Amy Wilson (all with United States Forest Service), and Hui Ye (Yunnan University, Kunming, China) for field and laboratory assistance; Robert Acciavatti (United States Forest Service), Anthony Cognato (Michigan State University, East Lansing, Michigan, United States of America), E. Richard Hoebeke (Cornell University, Ithaca, New York, United States of America), and Robert Rabaglia (Maryland Dept. of Agriculture, Annapolis, Maryland, United States of America) for taxonomic assistance; John M. Burch, Thomas Bunting, Gary Clement, and Cathy Thompson (all with USDA APHIS) for field site coordination; Thomas Atkinson (University of Texas at Austin, Austin, Texas, United States of America) and Robert Setter (Synergy Semiochemicals Corp., Delta, British Columbia, Canada) for providing details on bark beetle geographic ranges and lures; Thomas Gunn, Richard Hieback, John Jaeger, Richard Mennetti, John Roth, David Rutkowski, Wilford Salsberry, Donald Schmenk, Thomas Slough, Richard Walker, and Steve Wasiesky for granting permission to use the field sites; and Jon Sweeney and two anonymous reviewers for providing valuable comments on an earlier version of this paper. Affiliations are generally listed for each person at the time when the study was conducted.