Introduction
Earth's two Polar Regions present an apparent paradox in their ongoing climate changes. The widely cited warming, sea ice retreat, melting of glaciers and other cryospheric changes in northern high latitudes have been considered symbolic of global change in recent years. The record minimum of Arctic sea ice in the summer of 2007 (Stroeve et al. Reference Stroeve, Serreze, Drobot, Gearheard, Holland, Maslanik, Meier and Scambos2008) heightened concern about the rate of change in the Arctic. At the same time, Antarctic sea ice coverage was near its maximum for the post-1978 period of satellite coverage (Fig. 1), and temperatures over much of the Antarctic continent show little or no trend. However, as will be shown below, global climate models project substantial polar amplification of greenhouse-driven warming in both Polar Regions. The present paper attempts to reconcile this apparent paradox by placing the recent variations of polar climate into a perspective of natural variations and radiative forcing. The assessment of ongoing changes draws upon recent publications as well as an evaluation of simulations by a suite of global climate models. We will conclude that a combination of natural variability and known model shortcomings, together with an aggregation of model simulations, can account for much of the apparent differences between recent Arctic and Antarctic changes, especially the degree to which recent changes are compatible with greenhouse-driven model simulations.
Time series of Southern Hemisphere sea ice area, 1979–2008. (From Cryosphere Today, http://arctic.atmos.uiuc.edu/cryosphere/).

Models and data sources
Output from the IPCC (Intergovernmental Panel on Climate Change) AR4 global climate models are used in this study. The IPCC model output archive, maintained by the Program for Climate Model Diagnosis and Intercomparison (PCMDI), is the largest archive of coordinated global climate model simulations of the 20th century and projections for the 21st century. The archive has been designated by the World Climate Research Programme for use in the Coupled Model Intercomparison Project, Phase 3 (CMIP3), so it is now referred to as the CMIP3 archive. The simulations were forced by several SRES scenarios (A2, A1B, B1, …) of greenhouse gas concentrations and, in some cases, estimated sulphate aerosol concentrations. The greenhouse gas scenarios are described in detail by Nakicenovic et al. (Reference Nakicenovic and Alcamo2000). A total of 23 major global climate models have contributed to the CMIP3 archive. The many simulations from these models show considerable scatter that can be attributed to three factors: 1) differences in the A2, A1B and B1 forcing scenarios, 2) natural variations that occur at different times and with different amplitudes in the various models, and 3) across-model differences in the formulation of the physical and dynamical processes that are important for climate. Because of the temporal randomness of (2), a compositing of output from multiple models can be used advantageously to suppress the natural variability while preserving the signature of external (greenhouse) forcing. Composites also tend to reduce the systematic errors inherent in any single model, although Walsh (Reference Walsh, Kane and Hinkel2008) shows that this improvement diminishes rapidly by the time five to ten models are included in a composite. Accordingly, the present paper makes use of subsets of 10–15 of the models in the PCMDI archive. The core subset of these models consists of the 15 models that were available for use by the initial deadline of the IPCC Fourth Assessment (IPCC, 2007). For that reason these 15 models are the ones used most extensively in the IPCC Fourth Assessment. These models are listed in Table I. (The present-day climate simulated by one of these models, IAP-FGOALS, was found to be such an outlier that it skewed the composites; this model was therefore eliminated from the 15-model subset, leaving a core subset of 14 models).
Fifteen core models from the CMIP3 (IPCC AR4) archive used in this study.

In many cases, modelling centres performed ensembles of as many as 10 simulations of the 20th and/or 21st centuries. In previous work, we have utilized all available ensemble members in an assessment of simulated variability (Wang et al. Reference Wang, Overland, Kattsov, Walsh, Zhang and Pavlova2007). However, in applications such as the present paper where composites are constructed, we use only the first ensemble member of each model to ensure equal weighting across the models.
Since our focus is on the simulated temperatures of the two Polar Regions, we draw upon several observational datasets of surface air temperatures. The first is the European Centre for Medium-range Weather Forecasting's (ECMWF) 40-year reanalysis (ERA40), which directly assimilates air temperatures into a global model. The ERA40 provides one of the most consistent gridded representations of surface air temperature and it therefore serves as a useful benchmark against which the model simulations of the late 20th century may be compared. (Data and documentation for the ERA40 can be found at http://www.ecmwf.int/research/era/Products).
Additional gridded fields of air temperature for both Polar Regions are compiled routinely by the Goddard Institute for Space Studies (GISS). These grids are based on surface air temperature observations interpolated to a regular grid and are available at http://data.giss.nasa.gov/gistemp/maps/. For the Antarctic region, we also utilize the gridded fields compiled by Chapman & Walsh (Reference Chapman and Walsh2007a) as well as the set of station reports synthesized by Thompson & Solomon (Reference Thompson and Solomon2002).
Model simulations of the past century
Arctic
An outstanding feature of the climate simulations is their variability across models and across scenarios of greenhouse forcing. Figure 2 shows the annual mean temperatures for the Northern Hemisphere polar cap, 60–90°N, over the period 1900–2100 from the 14-model subset described above. The 20th century results are based on historical forcing (greenhouse gas concentrations and, in some cases, aerosols) and are shown by the black symbols. The 21st century results are based on the A2, A1B and B1 forcing scenarios, each of which is denoted by a different colour. All temperatures are plotted as departures from the corresponding model mean for 1981–2000.
Departures (relative to mean for 1980–1999) of surface air temperatures, °C, averaged over the northern polar cap (60–90°N) from fourteen CMIP3 models (letter symbols) and three different SRES forcing scenarios (colours).

It is readily apparent from Fig. 2 that there is substantial variability among the models. The yearly values averaged over 60–90°N vary among models by as much as 3°C during the 20th century, primarily due to 1) natural variability (discussed later), and 2) differences in model parameterizations and other structural features. As the simulations extend into the 21st century, the spread widens largely because of differences among the forcing scenarios. The preferential clustering of the results from each forcing scenario is especially apparent in the latter half of the 21st century, when the stronger warming of the A2 scenario emerges relative to the smaller warming of the B1 scenario. In fact, from about 2070 onward, the variance across the scenarios exceeds the across-model variance within each scenario, as shown in Fig. 3. The implication is that the greatest source of uncertainty in late 21st century projections is the uncertainty in the greenhouse forcing. By contrast, the differences among the models (i.e. the across-model variance) account for at least as much uncertainty as the greenhouse forcing in the first half of the 21st century. For this reason, assessments of projected impacts of climate change over the next 50 years are not strongly dependent on the choice of the greenhouse forcing scenario.
Standard deviations of surface air temperatures, °C, averaged over the northern polar cap (60–90°N). Coloured lines represent across-model standard deviations for different forcing scenarios.

The simulated Antarctic temperatures (Fig. 4) show a scatter similar to the Arctic temperatures in Fig. 2. (Figure 4 includes annual temperatures from only the intermediate A1B scenario simulation by only eleven models in order to highlight the illustration of linear trend lines for both the observational data and the composite model results for the 1958–2002 periods - black and purple linear segments in Fig. 4). Figure 4 shows that a range of about 3°C is typical of the area-averaged (60–90°S) Antarctic temperatures. However, the projected warming in the 21st century is somewhat smaller for the Antarctic than for the Arctic polar cap. Figure 4, which is based on the middle-of-the-road A1B scenario, indicates a 1–4°C warming by 2100, while the corresponding Arctic warming under the same scenario is 3–7°C (Fig. 2, green symbols). One factor contributing to this asymmetry between the polar caps is that the Antarctic ice sheet occupies much of 60–90°S, thereby limiting the ice-albedo feedback that can be a substantial contributor to the warming over the Arctic Ocean and peripheral seas where sea ice is replaced by open water in many of the CMIP3 simulations.
Same as Fig. 2, but for the southern polar cap (60–90°S) and for only the A1B scenario. Solid black line is the average over all models.

A fundamental question concerning the use of global climate models for projected changes is: How well do the models simulate the trends of recent decades? The CMIP3 archive of 20th century simulations, together with retrospective analyses of observed temperatures, provide an opportunity for such comparisons. Figure 4 shows that the simulated and observed area-averaged (60–90°S) trends over 1958–2002 are siminar, and the corresponding Northern Hemisphere areal averages show comparable agreement. However, similarity of trends of spatial averages does not guarantee that the spatial patterns of the trends are similar. Figure 5 shows the trends of annual mean temperature over the recent 50-year period, 1957–2006, from a) the observational compilation of the Goddard Institute for Space Studies (http://data.giss.nasa.gov/gistemp/maps/), and b) a composite of the CMIP3 models in Table I (excluding IAP-FGOALS). (The GISS-derived trends show a similar pattern to those of ERA40). For this particular 50-year period, the CMIP3 forcing (greenhouse gas, aerosols) is prescribed from historical data (except for 2001–2006, which is from the A1B scenario). Because the trends are averaged over an ensemble of models, the natural variability over interannual to multidecadal timescales is effectively averaged out. In this respect, the trends in Fig. 5b may be regarded as the models’ greenhouse signature. A broad warming over the Northern Hemisphere, ranging from 0.3–0.7°C over the midlatitude oceans to 1.0–1.6°C over the Arctic peripheral seas, dominates Fig. 5b. Except for the peripheral sea ice regions in the Arctic Ocean's surrounding seas, the warming is generally larger over land than over the ocean at the same latitude. This greenhouse signature has long been found in global climate models. The observationally-derived pattern for the same period (Fig. 5a) is broadly similar to the model-simulated pattern of trends, although there are some notable differences. First, small areas of cooling are found in the midlatitude North Pacific Ocean and offshore of the south-eastern United States. Second, the areas over which the observed warming exceeded 1°C are larger than simulated, especially over Asia and northern North America. The discrepancies are strikingly greater during the winter season, as shown in Fig. 6. The observed wintertime warming exceeds 2°C over large portions of the northern continents, but regions of cooling are seen in far eastern Siberia and the Baffin Bay region, in addition to the midlatitude ocean areas that cooled in the annual mean (Fig. 5a). By contrast, the models’ warming is largest (2–3°C) over the Arctic peripheral seas, and is considerably weaker than observed over the northern continents. Taken at face value, the two panels of Fig. 6 seem to represent a contradiction between the model simulations and the reality of the past 50 years.
Linear trends of annual mean surface air temperature for 1957–2006 based on a. observational data (from NASA Goddard Institute for Space Studies), and b. the CMIP3 models used in the IPCC Fourth Assessment Report (AR4).

Same as Fig. 5, but for winter (December–February) surface air temperatures.

How can the contrasting patterns in Fig. 6 be reconciled? The answer appears to lie in the natural variability of the atmospheric circulation. The observational trends depicted in Fig. 6a represent one realization of the climate system. Multidecadal variability of the atmospheric circulation is an effective driver of temperature anomalies and trends over the multidecadal timescale. On the other hand, the model-derived trend map in Fig. 6b is a composite (average) of the trend maps produced by 14 individual models, each of which has circulation-driven temperature anomalies in different regions and decades. In effect, the composite of the model trend fields averages out the natural variability of the circulation-driven anomalies, leaving the signature of the models’ greenhouse-driven warming. This warming is largest in the peripheral Arctic seas because most of the models lose some sea ice during the 1957–2006 period, triggering the albedo-temperature feedback seaward of the new ice edge.
Nowhere is the effect of naturally varying atmospheric circulation anomalies more apparent than in north-western North America, where the observed wintertime warming in Fig. 6a is nearly 3°C. Figure 7 shows the time series of state-wide average annual temperatures for Alaska. This time series is based on annual means of Alaskan station data compiled by the Alaska Climate Research Center, http://climate.gi.alaska.edu/ClimTrends/Change/TempChange.html). While a linear regression produces a warming of approximately 2.5°C, the warming occurred almost entirely as a result of a “jump” in the late 1970s. The trends for the 1949–1976 and 1978–2007 subperiods are essentially zero. Figure 8 shows that the temperature “jump” coincided with a shift of phase of the Pacific Decadal Oscillation (PDO), which is an ocean-atmosphere anomaly pattern that affects most of the North Pacific Ocean and north-western North America. During its positive phase, into which the PDO shifted during 1977, the associated sea level pressure field results in anomalous northward advection of warm air into Alaska and western Canada. In the Eurasian sector, a similar explanation for the large positive temperature trends (Fig. 6a) can be found in the Arctic Oscillation, which favoured anomalous eastward advection of warm air into northern Eurasia for much of the 1990s (Thompson & Wallace Reference Thompson and Wallace1998). Models show varying degrees of success in capturing these large-scale atmospheric modes of variability (Stoner et al. in press), although the timing of phase shifts in the model simulations cannot be expected to match those of the historical record. Hence the abnormal warmth observed over northern Eurasia during the 1980s through the late 1990s does not appear in the composite of the model simulations. Rather, the models’ wintertime warming is greatest over the Barents, Kara, Bering and Labrador seas (as well as Hudson Bay), where the models’ greenhouse-driven decrease of wintertime sea ice is greater than in the observational data. The sensitivity of the observed trends to phase shifts of the low-frequency atmospheric modes makes the observed trends much more sensitive to the choice of the time period. We may conclude that the model-derived patterns in Figs 5 & 6 represent cleaner greenhouse signatures (by virtue of the compositing) than do the corresponding observationally-derived patterns.
Departures of annual statewide Alaskan air temperatures (°F) from the mean for 1949–2007. Red and blue bars denote positive and negative anomalies, respectively. Black line is 5-year running mean departure. [From Alaska Climate Research Center, http://climate.gi.alaska.edu].

Time series of the Pacific Decadal Oscillation. Thin line denotes monthly values, thick line is 12-month running mean. [From Joint Institute for the Study of the Atmosphere and Ocean, http://www.jisao.washington.edu/pdo/].

Antarctic
Observational trends in the Antarctic have been the subject of greater uncertainty and debate because of the lack of long-term in situ measurements over the Southern Ocean and the interior of the Antarctic continent. Automated weather stations and remote sensing measurements have come on-stream in the last few decades, but even most of the coastal observing stations date back only to the late 1950s (the International Geophysical Year). As is the case in the Arctic, the variability of the atmospheric circulation can introduce considerable sensitivity into computed trends through the choice of the time period. Nevertheless, a generally consistent picture is emerging with respect to Antarctic temperature trends of the past several decades. For example, Fig. 9 shows two examples of surface air temperature trends over Antarctica, albeit for slightly different time periods. The first (from Thompson & Solomon Reference Thompson and Solomon2002) is based solely on surface station data for December–May, 1969–2000. The second (from J. Comiso and the NASA Earth Observatory) was obtained from clear-sky satellite-derived surface skin temperatures for all calendar months of 1982–2004. Despite their different sources, seasons and time spans, both show a cooling over much of the Antarctic continent and a strong warming over the Antarctic Peninsula. The satellite data indicate areas of warming over the Southern Ocean, which is devoid of fixed observing stations. Explanations for the cooling over the Antarctic continent in a period of increasing greenhouse gas concentrations range from a role of ozone depletion in strengthening the Southern Annular Mode (Thompson & Solomon Reference Thompson and Solomon2002) to an increase of snowfall and associated cooling of the high-elevation surface (http://earthobservatory.nasa.gov/Newsroom/NewImages/images.php3?img_id=17257). The present consensus is that the major factor contributing to the recent cooling over much of the Antarctic continent has been the strengthening of the Southern Annular Mode in association with stratospheric ozone depletion (Arblaster & Meehl Reference Arblaster and Meehl2006). The greatest warming on the western side of the Antarctic Peninsula has been during the winter (cause unknown at present), while on the eastern side the weaker warming has been strongest during the summer (attributable to the positive shift in the SAM and associated down-slope motion on the eastern side of the Peninsula).
Antarctic surface air temperature trends for a. 1969–2000 from station data analysis of Thompson & Solomon (Reference Thompson and Solomon2002), and b. 1982–2004 from satellite data infrared data (From NASA Earth Observatory/J. Comiso, NASA Goddard Space Flight Center, http://earthobservatory.nasa.gov/Newsroom/NewImages/images.php3?img_id=17257). In both panels, red and orange denote warming and blue denotes cooling.

A more systematic compilation of Antarctic temperature data for the post-IGY period has been reported by Chapman & Walsh (Reference Chapman and Walsh2007a), and we use this compilation as the basis for a comparison with the CMIP3 model-derived trends for a period comparable to that of the Arctic comparisons in Figs 5 & 6. Chapman & Walsh synthesized information from the manned observing stations (e.g. Fig. 8a), the Automated Weather Station (AWS) network (Shuman & Stearns Reference Shuman and Stearns2001), and the ICOADS sea surface temperature database (Worley et al. Reference Worley, Woodruff, Reynolds, Lubker and Lott2005). Figure 10a shows the computed trends for the 1958–2002 period over a broad Southern Hemisphere domain that includes the Antarctic continent as well as the Southern Ocean. While there is cooling over portions of East Antarctica, the cooling is not as pervasive as for the shorter periods in Fig. 9. In general, the trends over the Antarctic continent and much of the Southern Ocean are small and insignificant. The smaller regions of cooling are again consistent with low-frequency variations of the atmospheric circulation, as discussed earlier for the Arctic (Figs 5a & 6a). However, as in Fig. 9, a strong warming over the Antarctic Peninsula is apparent in Fig. 10a. The rate of warming over the Peninsula exceeds 0.3°C per decade, resulting in a total warming of more than 2°C since the late 1950s.
Linear trends of annual mean surface air temperature for 1958–2002 based on a. observational data (Chapman & Walsh Reference Chapman and Walsh2007a), and b. the CMIP3 models used in the IPCC Fourth Assessment Report (AR4).

Figure 10b shows the corresponding field of trends for the same period from a composite of the CMIP3 models. The CMIP3 models capture the strong warming over the Antarctic Peninsula, although they also show strong warming (0.2–0.3°C per decade) in other coastal sectors. In general, the warming is stronger and more pervasive in the model simulations than in the observational depictions. An examination of the seasonal counterparts of Fig. 9b (not shown) indicates that the pattern of annual mean trends is determined primarily by winter and spring, and to a lesser extent autumn; summer trends are generally weak even in the coastal areas.
Why do the models simulate a stronger Antarctic warming over the past half-century than is shown by the observations? The models’ warming is spatially consistent with a retreat of sea ice, which is not apparent in the observational record. However, such reasoning merely shifts the question to the reason for the models’ excessive loss of sea ice, which is likely related to temperatures. Several postulates have been put forward to explain the apparent discrepancy. The cooling over the continental interior is consistent with the strengthening of the Southern Annular Mode, which may have resulted from ozone depletion (Thompson & Solomon Reference Thompson and Solomon2002, Overland et al. Reference Overland, Turner, Francis, Gillett, Marshall and Tjernstrom2008). Of the fifteen models examined here, ten include time-varying ozone concentrations in their late 20th century simulations; the changes in ozone are based on either Randel & Wu (Reference Randel and Wu1999) or Kiehl et al. (Reference Kiehl, Schneider, Portmann and Solomon1999). These same ten models prescribe a recovery of ozone in the 21st century based on the ozone recovery scenario of the WMO (2003). The other five models (including the FGOALS model cited earlier) assume no temporal variations in ozone in either the 20th or the 21st centuries. Miller et al. (Reference Miller, Schmidt and Shindell2006) have shown that the models with ozone variations included show a stronger increase in intensity of the Southern Annular Mode in the late 20th century. Despite the 21st century recovery of ozone in these models, the Southern Annular Mode remains stronger than in the constant-ozone models through the 21st century (Miller et al. Reference Miller, Schmidt and Shindell2006, figs 10 & 12).
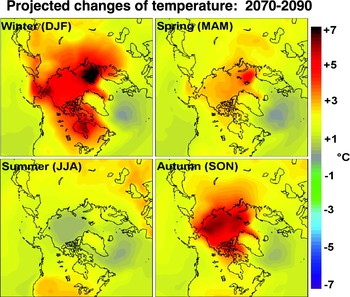
Projected changes of mean surface air temperature (°C), 2070–2090 relative to 1980–2000, for the four seasons and for northern high latitudes. Seasons are winter, December–February (DJF); spring, March–May (MAM); summer, June–August (JJA); and autumn, September–November (SON).

An alternative explanation for the greater Antarctic warming in the models has been suggested by Monaghan et al. (Reference Monaghan, Bromwich and Schneider2008), who note that the 20th century increases of water vapour over Antarctic may be too large in global climate models. Since water vapour is strongly correlated with downward long wave radiation in the models, this water vapour tendency may have played an important role in the models’ excessive near-surface warming of the Antarctic region.
Model projections
Given the ability of the composites of the CMIP3 models to capture the underlying greenhouse signature of climate change in the Arctic, we present 21st century projections based on the same sets of models used for the composites shown in Figs 5b, 6b & 10b. The projections shown here are limited to surface air temperature forced by the A1B scenario, a middle-of-the-range emission scenario used by the IPCC. Because the temperature changes in both hemispheres are strongly seasonal, we show the seasonal mean changes over the 21st century.
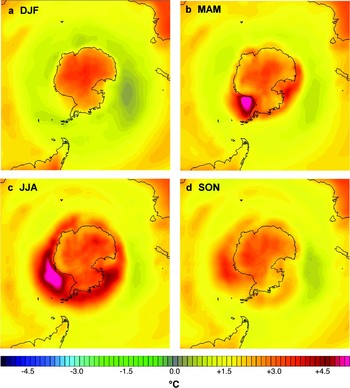
Figures 11 & 12 show the seasonal changes for the Arctic and Antarctic, respectively. Several features of the changes are common to both Polar Regions. First, the warming is strongly shaped by the loss of sea ice. The Arctic Ocean loses much of its summer sea ice by the end of the century in most models, resulting in a strong warming (5–7°C) during autumn over much of the Arctic Ocean. This warming extends into winter as a thin cover of new ice forms in areas that had previously been covered by thicker ice; the winter warming is strongest in the Bering Strait and Barents Sea regions, where winter ice reforms later than at present. In the Southern Hemisphere, the warming is strongest during winter (June–August) in the Weddell Sea and offshore of Queen Maud Land, where sea ice is also lost by some of the models. Autumn and spring also show strong warming in other offshore areas where sea ice is lost. Second, the summer warming over the polar ocean areas of both hemispheres is close to zero, as the oceans’ strong thermal inertia slows warming above the freezing temperature. Third, the continental areas of both hemispheres show much less seasonal variation of the warming compared to the adjacent ocean areas. The projected end-of-century warming is generally 2–3°C in the northern land areas and about 3°C over the Antarctic ice sheet.
The projected temperature changes in Figs 11 & 12 are subject to some serious caveats. First, the validity of the patterns and magnitudes of the warming depends strongly on the ability of the models to simulate sea ice realistically. The coincidence of the areas of sea ice loss and the largest warming points unambiguously to the importance of sea ice in the evolution of the near-surface air temperatures. Second, the stronger warming over the Antarctic ice sheet (relative to the northern land areas) calls into play the finding that the models over-simulate the Antarctic warming of the past 50 years. Whether this overestimate is due to changes in ozone or atmospheric water vapour is unclear, but both of these potential sources of bias should be present in the 21st century as well as the late 20th century simulations. All the models used here include ozone in one form or another, although the prescribed ozone in several models contains no secular changes. The next generation of global climate models will likely provide opportunities for the inclusion of fully interactive ozone chemistry, but the validity of the simulated variability of water vapour also merits investigation.
Finally, it must be noted that the across-model variability is especially large in the Polar Regions. While the largest warming in the Northern Hemisphere occurs in the Arctic, the across-model variance is so large that the Arctic does not show the largest greenhouse signal when the change of temperature normalized by the across-model variance. The same is true of the Weddell Sea region in the Southern Hemisphere. The large across-model variability is at least partially attributable to the large scatter among the models in their simulated sea ice coverage (Chapman & Walsh Reference Chapman and Walsh2007b; http://arctic.atmos.uiuc.edu/IPCC/).
Conclusions
The results presented here show that CMIP3 models provide plausible signatures of greenhouse-driven temperature change over the past 50 years in the Arctic, provided that the output of the models is composited so that the natural variability associated with the atmospheric circulation is removed. The actual pattern of Arctic temperature change over the past 50 years is strongly shaped by the low-frequency modes of atmospheric variability, especially during the winter season. The models show somewhat greater warming during winter over the Arctic peripheral seas, indicating that the retreat of wintertime sea ice is over-simulated by the models. The model composites show the observed strong warming near the Antarctic Peninsula, but they indicate excessive warming over the Antarctic ice sheet. Possible reasons for the discrepancies over Antarctica are the absence of ozone depletion effects in the models or the overestimate of water vapour in the more recent decades (Monaghan et al. Reference Monaghan, Bromwich and Schneider2008). The spatial and seasonal characteristics of the late 20th century warming are also apparent in the projected changes for the remainder of the 21st century, calling attention to the importance of realistic simulations of sea ice, ozone effects and water vapour in the polar atmospheres. The associated processes should be priorities for model validation and enhancement.
Acknowledgements
This work was supported by the National Science Foundation's Office of Polar Programs through Grant ARC-0327664, the Cooperative Agreement with the International Arctic Research Center. The figures were prepared by William Chapman, who also assisted in the formatting and submission of the manuscript.