


Introduction
Ice shelves occupy almost 50% of the coastline of Antarctica and the majority of the continent's large outlet glaciers terminate in an ice shelf. The stability of marine ice sheets and flow rates of outlet glaciers is related to the thickness and extent of their surrounding ice shelves and margins. The collapse of ice shelves on the Antarctic Peninsula has been seen immediately to precede acceleration of tributary glaciers and thinning of ice further inland (Rott and others Reference Rott, Rack, Skvarca and De Angelis2002; Scambos and others Reference Scambos, Bohlander, Shuman and Skvarca2004). The buttressing effect of the ice shelves pinned against islands and ice rises in the Ross, Weddell and Amundsen Seas protects the unstable West Antarctic Ice Sheet from rapid collapse which could lead to a sea level rise of approximately 3.3 m (Bamber and others Reference Bamber, Gomez–Dans and Griggs2009). As well as being important for marine ice sheet stability, ice shelf velocity and thickness measurements can be used to predict inland changes by calculating variation in ice discharged across the grounding line. Variation in ice shelf extent, ice flux across the grounding line and contribution of melting and calving can be monitored by recording ice thickness and surface velocity. Four components of mass-balance are applicable to ice shelves: ice flux across the grounding line, melting/freezing at the ice-ocean interface, calving at the seaward margin and accumulation/ablation on the surface. Monitoring some of these components in combination with calculations of mass distribution, strain rate and flow patterns allows important inferences about accumulation patterns, sublimation and surface melt rates, ocean temperatures and internal ice dynamics to be made.
The aim of this study is to demonstrate the value of satellite altimetry as a method of calculating surface velocity over ice shelves. Airborne laser altimetry has been used previously to monitor ice movement in small areas and over short time periods on Jakobshavn Isbræ, Greenland (Abdalati and Krabill Reference Abdalati and Krabill1999). This was achieved by densely scanning the glacier on different days and differencing the resulting digital elevation models. More recently terrestrial laser scanning has been used in the same area by placing the scanner on a hill overlooking the glacier (Schwalbe and Maas Reference Schwalbe and Maas2009), but these techniques are not feasible for large ice shelves in the Antarctic due to their low spatial coverage. Satellite-borne altimeters have not previously been used for velocity measurement over ice as they are unable to pick out small scale features with large vertical impressions such as crevasses due to the large sensor footprint. Modern satellite altimeters have a high pointing accuracy, reasonably small footprints and high pulse rates, as well as accurate repeat pass orbits, which together allow the repeated mapping of relatively small and gentle surface undulations.
As very precise elevation measurements are needed over ice sheets to quantify their contribution to sea level change (Pritchard and others Reference Pritchard, Arthern, Vaughan and Edwards2009), high precision satellite laser altimeters such as the Geoscience Laser Altimeter System (GLAS) on board ICESat have been developed. This altimeter has a footprint size of around 70 metres meaning it can identify areas with large crevasses and rifts (Fricker and others Reference Fricker, Bassis, Minster and MacAyeal2005). A vertical accuracy of around 3 cm over the poles also means that it can identify low amplitude, long wavelength undulations in the ice (Zwally and others Reference Zwally, Schutz, Abdalati, Abshire, Bentley, Brenner, Bufton, Dezio, Hancock, Harding, Herring, Minster, Quinn, Palm, Spinhirne and Thomas2002). This accuracy has previously been used to map thinning (for example Smith and others Reference Smith, Bentley and Raymond2005; Csatho and others Reference Csatho, Ahn, Yoon, van der Veen, Vogel, Hamilton, Morse, Smith and Spikes2005; Pritchard and others Reference Pritchard, Arthern, Vaughan and Edwards2009) as well as comparing the tidal signal beneath ice shelves with the non-tidal signal over grounded ice to pinpoint the grounding line (Brunt and others Reference Brunt, Fricker, Padman, Scambos and O'Neel2010).
To use the high vertical precision of altimetry to monitor horizontal movement requires firstly that features are sufficiently large to be detected by the altimeter and secondly that they move in the same direction and speed as the ice. Alberti and Biscaro (Reference Alberti and Biscaro2010) show that ICESat can be used to detect decimetre-scale topography variation in snow megadunes in East Antarctica, so variations of this order should also be traceable over the ice shelf. When ice is grounded, the general shape of the surface of the ice depends on the shape of the bedrock, with bedrock protrusions and depressions often visible as surface bumps or hollows. These surface features do not move with the ice, rather the ice deforms around them. This has been used as a method of image co-registration where bedrock is not visible (for example Scambos and others Reference Scambos, Dutkiewicz, Wilson and Bindschadler1992). Small scale features such as surface crevasses may still be tracked over grounded ice with optical imagery or speckle and reflectance patterns from Synthetic Aperture Radar (SAR). When the ice is floating however, any surface irregularities in the ice imprinted at the grounding line are transmitted downstream as there are no significant shear stresses to cause further deformation. Due to this difference in the movement and deformation of ice, the satellite altimetry technique described here is only applicable to floating ice where the movement of large scale features is synchronized with ice flow.
Currently, the most common methods of mapping ice shelf velocities involve cross-correlation of repeat-pass optical or SAR images, or radar interferometry (for example Rignot and others Reference Rignot, Bamber, van den Broeke, Davis, Li, van den Berg and van Meijgaard2008). Interferometry measures changes in phase of the return signal from SAR and relies on being able to maintain high phase coherence between images. This requires repeat acquisitions within a short time period and although accurate, is therefore limited in its applicability to many areas due to satellite coverage. SAR interferometry also suffers from tidal effects which make measuring velocity close to the grounding line difficult (Giles and others Reference Giles, Massom and Warner2009). Repeat-pass imagery allows features to be tracked on much longer time scales with images separated by several years. High resolution optical or SAR sensors such as Landsat or Radarsat benefit from high accuracy in velocity measurements however they cover small areas. Individual images, particularly over ice shelves, will not always contain stationary points such as rock outcrops, making co-registration difficult without stitching together multiple scenes. Low spatial resolution sensors such as MODIS (Moderate Resolution Imaging Spectroradiometer) suffer from reduced precision due to large pixel sizes (Haug and others Reference Haug, Kaab and Skvarca2010) and passive optical sensors have a further disadvantage over altimetry in that they cannot acquire images during the polar winter when it is dark, or when there is cloud cover.
Mapping velocity using ICESat
The method of calculating surface velocity described here involves repeat-track analysis of laser altimetry data from the ICESat satellite. ICESat is a NASA satellite designed primarily for measuring ice surface heights, clouds, and aerosols in the atmosphere. The uses of ICESat and an overview of its design brief are detailed elsewhere (for example Schutz and others Reference Schutz, Zwally, Shuman, Hancock and DiMarzio2005). Its only scientific instrument is the Geoscience Laser Altimeter System (GLAS) which is a high precision LIDAR operating at wavelengths of 532 and 1064 nm. ICESat initially had a pointing accuracy of 7.5 m ± 6.6 m for Laser 3a (Magruder and others 2005), giving a high confidence that the repeat data can be compared with minimal geolocational errors and the velocities obtained are well georeferenced. The altimeter acquires data to a latitudinal limit of 86° S (Zwally and others Reference Zwally, Schutz, Abdalati, Abshire, Bentley, Brenner, Bufton, Dezio, Hancock, Harding, Herring, Minster, Quinn, Palm, Spinhirne and Thomas2002), repeating each track between two and three times a year on a 91-day cycle. Altimetry data is sampled with 50–70 m diameter footprints every 0.025 seconds, giving an along track spacing of around 170 m (Schutz and others Reference Schutz, Zwally, Shuman, Hancock and DiMarzio2005). The repetition of close to the same orbits and adjustment of the pointing angle up to 5° allows comparison between surface elevations at different times.
We have used ICESat product GLA12 (GLAS Antarctic and Greenland Ice Sheet Altimetry Data), release 531, from October 2004 to October 2009. The elevation data is based on the TOPEX/Poseidon ellipsoid. The tidal correction applied to the data has been removed as it is likely to be inaccurate in the grounding zone where a tidal model had been applied based on a best estimation of the grounding line. As the grounding line is not known precisely for many areas of Antarctica, grounded ice may have been tidally corrected during pre-processing and areas which are floating may not. This could affect the slope, particularly where the grounding zone is poorly defined. A correction for signal saturation has also been applied as the high reflectance of the ice can affect the elevation value based on peak return time of the laser pulse.
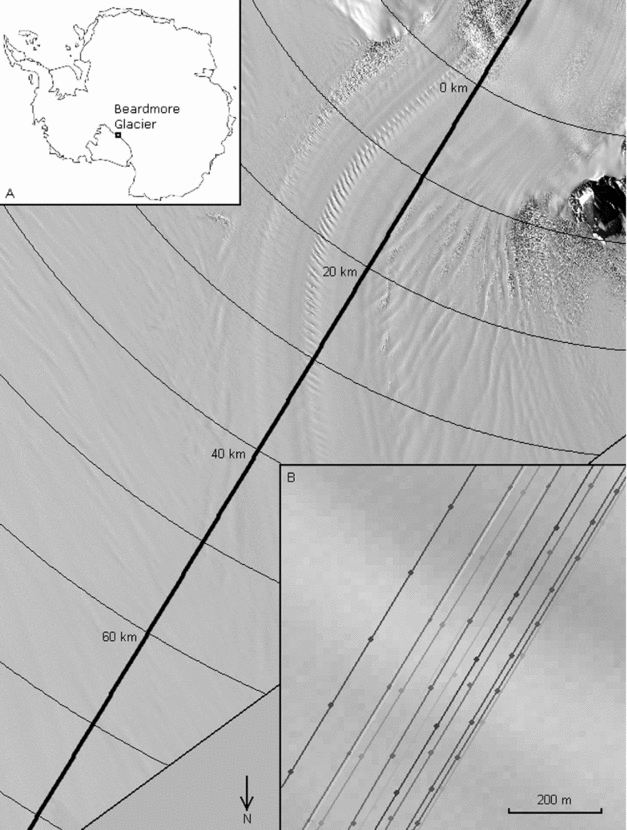
A small area of the Ross Ice Shelf downstream of the grounding line of the Beardmore Glacier is used to validate the technique (Fig. 1). The data is interpolated to a regularly spaced 1 m grid using distance from a fixed point upstream, in line with the central track as an origin. The interpolation method is based on a smoothed cubic interpolation providing steady changes in surface slope whilst maintaining as much detail as possible (Fig. 2a). Although the orbit path is broadly the same during each data acquisition period, the centre of the laser footprint is not always in the same place due to atmospheric effects and slight variation in the orientation, position or pointing angle of the satellite. The first derivate of elevation is used in favour of actual elevation to amplify differences in the ice profile between years. This conversion also removes the influence of tidal cycles on the correlation, producing a comparison between slope features (Fig. 2b) rather than actual elevations (Fig. 2a). As well as removing the effect of tides on the correlation, slope profile maintains a greater consistency over time and enhances the signal from feature peaks and troughs. Although undulations may decrease in amplitude over time due to longitudinal stress in the ice, the peaks and troughs stay in proportionally the same place.
ASTER image of the Beardmore grounding zone showing the orbital path of ICESat. Inset A shows the location of the Beardmore Glacier on the Ross Ice Shelf. Inset B is a close up of the tracks showing the amount of offset from the mean.
ICESat derived surface elevation for a 30 km section downstream of the grounding line (a) and along–track surface slope for the same section (b).

The tracks are correlated pairwise using a stepped cross-correlation method with increasing lag applied. The point of maximum correlation between the two tracks is recorded (Fig. 3). The amount of lag required in metres to obtain this maximum correlation represents the total movement of the ice in the along-track direction over the period between the two ICESat acquisitions. These values of ice movement are only used for further analysis if the correlation between the two profiles is greater than 0.75. This reduces the possibility of any coincidental correlations.
A comparison of the strength of correlation between the surface–slope profiles obtained during different track passes.

Although the ICESat tracks follow very similar paths, after post-processing the centre of the footprints can vary by up to 200 m across track (Table 1). This can cause the altimeter to record slightly different ice profiles, introducing some correlation errors. For identifying changes in grounded ice elevation this offset can be overcome by triangulating points on consecutive tracks (for example Pritchard and others Reference Pritchard, Arthern, Vaughan and Edwards2009). This is more difficult on floating ice due to changes in tide between acquisitions, although it could still be applied away from the grounding zone where the ice shelf moves consistently with tidal models and the elevations could be adjusted accordingly. This issue should be resolved with future altimeters (Abdalati and others Reference Alberti and Biscaro2010) but currently an alternative method must be used to account for this offset which relies on simultaneous comparison of multiple tracks.
Details of the 12 overlapping ICESat tracks used for this study. ‘Offset from mean’ refers to the average lateral displacement of each track from its ideal path, calculated over the whole length of the track (see Figure 1, inset B).

Where the features recorded by the altimeter are perpendicular to the satellite track, no adjustment needs to be made. Where the tracks pass over non-perpendicular features, an adjustment can be made by assuming a constant velocity between repeat passes. The adjustment for features is made using simple trigonometry (Fig. 4) before the velocity is calculated. Depending on which way the features are orientated, the offset between tracks may form a greater or lesser contribution to the overall displacement. The feature-track angle (α) is unknown without combining the ICESat method with another sensor but can be approximated by a minimisation routine if taken to be constant. This assumes that features do not significantly change orientation between ICESat orbits. The amount of adjustment increases proportionally to the inverse of the tangent of α. The features must not be parallel to the tracks or the error induced by the offset tends to infinity. If perpendicular then the offset can be ignored.

where, v = flow velocity, x = feature location, y = perpendicular offset, t = acquisition time, α = angle between features and satellite track.
A schematic explanation of the method used to reduce the effect of oblique surface features and ice flow which is non–parallel to ICESat tracks. Black lines indicate ICESat tracks, grey lines indicate the orientation of surface features. The final profile shows no relative feature displacement due to cross–track separation, therefore all displacement is due to ice movement in the track direction.

The direction of flow of ice compared to the ICESat tracks can also influence the relative contribution of feature orientation and offset to the recorded velocity. Provided that the same large features are aligned in a constant direction between repeat passes, the effect of the offset can be removed if both the angle of flow and the feature angle are known. With this in mind, the net velocity can be calculated exactly if the two angles are known. Alternatively, if one of the angles is known the other can be deduced providing there are enough ICESat tracks of sufficient quality (generally greater than 4). This technique is more suitable for use at ICESat track crossing points where the velocity in two directions can be calculated and therefore the angle between the tracks and the flow is already known. Three value minimization of both angles and velocity for a single track leads to widely varying values of flow direction inconsistent with intuitive flow directions obtained from satellite imagery and was not adopted here.
Discussion
Fig. 5 shows the offset-adjusted velocity recorded from each track pairing at 1 km intervals starting just above the grounding line. The grounding line occurs between 3 and 4 km downstream of the specified origin indicated by a rapid increase in measured velocity. The peak in velocity occurs at 17 km from the origin where the ice flow is parallel to the ICESat track although there is also fast flow at the grounding line. Both here and where the ice flow is parallel to the ICESat tracks at a point around 15 km downstream of the grounding line, the recorded velocities in the range 325–360 m a−1 are within 10% of currently published measurements for the glacier at its grounding line (Swithinbank Reference Swithinbank1963). Calculated velocities along the whole section also show a high internal consistency, particularly where the offset between tracks is small. The two pairs of tracks which most closely overlap (repeating their footprint to within 10 m), L3A - L3H and L3B - L3I yield velocities of 365 m a−1 and 367 m a−1 respectively at the grounding line. The recorded velocity drops sharply at around 40 km downstream of the grounding line. This represents the area of transition where ice originating from the Beardmore Glacier merges with slower ice already part of the ice shelf. This transition can also be seen in the ASTER imagery (Fig. 5). Shearing in this zone disrupts the features being tracked, and fewer pairs of tracks reach the correlation threshold for inclusion.
Along–track surface velocity for the 80 km downstream of the grounding line after adjustment for perpendicular offset. Individual points show the velocity obtained from the correlation of each track pair with a 5 km running–mean overlaid.

As the ice swings around to the north, approaching a perpendicular angle to the satellite tracks the velocity in the along-track direction is reduced. To secure a more accurate representation of the velocity in this area would require looking at tracks from a complementary orbital path. The standard deviation of values in this area is also increased as errors in offset are multiplied by the rapidly increasing values of (tan α)−1. This increase in scatter of the velocities is also an indication that the quality of the results for the last 40 km of the profile is lower than for the first 40 km.
Although there is a reduction in velocity precision where the flow is not parallel to the satellite tracks, the tracked features are assumed to be stable along the whole profile. Comparison of tracks 5 years apart only produces marginally lower correlations than tracks 1 year apart (Fig. 3). Features with similar amplitudes and wavelengths on the East Antarctic plateau have been interpreted as snow megadunes which migrate with the wind (Frezzotti and others Reference Frezzotti, Gandolfi and Urbini2002) but these are unlikely to form on the ice shelf, as they appear to be caused by oscillations in katabatic winds in a stable, uniform wind environment. Smaller aeolian features such as sastrugi and wind scours which modify the ice surface are not resolved by the ICESat footprint but both accumulation rates and prevailing wind should be considered when tracking features over longer periods. The correlation between recorded profiles will decrease over time but atmospheric conditions should not destroy or fundamentally change the pattern of kilometre-scale undulations over the period involved.
The offset adjustment requires an assumption of constant velocity over the measured time period. Fluctuations in surface velocity have been recorded on the nearby Byrd Glacier (Stearns and others Reference Stearns, Smith and Hamilton2008) but these are thought to be caused by subglacial lake drainage. As no subglacial lakes have presently been documented in the Beardmore catchment (Siegert and others Reference Siegert, Carter, Tabacco, Popov and Blankenship2005; Smith and others Reference Smith, Fricker, Joughin and Tulaczyk2009) and repeat ground measurements near the grounding line suggest that the velocity does not vary seasonally (Swithinbank Reference Swithinbank1963), it seems reasonable to make the assumption of constant velocity over a short time period for this glacier.
Conclusion
The single-track method described is useful when the track is parallel to ice flow but cannot be used as a standalone method as it produces values of ice movement in only one direction and the variance increases as flow becomes parallel to the tracks. In the Beardmore Glacier the ice flow direction can easily be inferred from ASTER imagery but further out on the ice shelf a combined track approach, or supplementary imagery is needed.
The new technique described here is made possible by the high precision of modern satellite altimeters but is only applicable to floating ice where there is little surface deformation and some spatial variability in surface elevation. The use of altimetry to measure ice shelf velocity is not meant to replace feature tracking using optical imagery or interferometry, it is designed to complement these techniques in areas where there are no ground control points or where image availability is limited. This is possible due to the high spatial coverage of altimetry data across Antarctica. The principles behind this method are currently being used to produce a 2-D velocity map of the entire ice shelf, by extending the simple version of the method presented here to multiple crossing tracks. The benefits of this technique over feature tracking by other satellite methods are its high accuracy of georeferencing, particularly in areas far away from stationary points, the availability of year-round, repeating data across Antarctica and the low computational expense in processing.
Acknowledgements
ICESat data were provided by the National Snow and Ice Data Center (NSIDC) in Boulder, Colorado. ASTER data were provided within the GLIMS project.



