In recent decades, researchers have found that the growing elite partisan polarization in the United States has had a variety of potentially problematic effects on citizens. For instance, it pushes partisans' opinions toward the ideological poles (for example, Druckman, Peterson and Slothuus Reference Druckman, Peterson and Slothuus2013; Levendusky Reference Levendusky2009; Levendusky Reference Levendusky2010), increases animosity towards the opposition (for example, Rogowski and Sutherland Reference Rogowski and Sutherland2016; Webster and Abramowitz Reference Webster and Abramowitz2017) and reduces political trust (for example, Jones Reference Jones2015; King Reference King, Nye, Zelikow and King1997).
However, the term polarization is often used ambiguously, and the rise in elite conflict in the United States has occurred along more than one dimension (Persily Reference Persily and Persily2015). Not only have the issue positions of Democrats and Republicans in Congress moved further apart and become more homogenous (McCarty, Poole and Rosenthal Reference McCarty, Poole and Rosenthal2016), but the amount of harsh and uncivil rhetoric has also increased (Dodd and Schraufnagel Reference Dodd, Schraufnagel, Frisch and Kelly2013). These changes in substantive views and style of debate have gone hand in hand in recent decades, leading many observers to conflate the two trends (Mutz Reference Mutz2017, 195). Nonetheless, issue polarization and political incivility remain conceptually distinct phenomena (Mutz Reference Mutz2015; Mutz Reference Mutz2017; Schraufnagel Reference Schraufnagel2005); an obvious question is therefore whether effects such as those mentioned above are caused by one or the other.
Unfortunately, prior studies provide few clear answers regarding the independent effects of issue polarization and incivility, as the two dimensions of elite conflict have often been empirically confounded. For instance, in experimental studies of incivility, participants have often been exposed to political debate featuring ideologically laden insults (for example, calling opponents ‘left wing’ or ‘socialist’) that signal not only a lack of respect, but also that issue positions are far apart (see Gervais Reference Gervais2015; Gervais Reference Gervais2019). Similarly, the treatment material in studies of issue polarization has frequently included terms (such as ‘bickering’ or ‘polarized atmosphere’) that signal substantive disagreement as well as a belligerent tone of debate (see Harrison Reference Harrison2016; Mullinix Reference Mullinix2016). This makes it impossible to disentangle the effects of issue polarization and incivility in many experiments. Furthermore, the challenge of empirical confounding is also present in observational studies, as it has not been customary to control for the level of incivility when examining the effects of issue polarization, and vice versa (for example, Forgette and Morris Reference Forgette and Morris2006; Hetherington Reference Hetherington2001; Jones Reference Jones2015; King Reference King, Nye, Zelikow and King1997).
Against this background, it is perhaps unsurprising that many researchers have claimed that incivility and issue polarization affect citizens in similar ways. Both dimensions of elite conflict have been linked to political distrust (for example, Forgette and Morris Reference Forgette and Morris2006; King Reference King, Nye, Zelikow and King1997; Mutz and Reeves Reference Mutz and Reeves2005; Uslaner Reference Uslaner2015), and just as issue polarization has been linked to polarization in terms of policy attitudes and affect among partisans (for example, Levendusky Reference Levendusky2009; Levendusky Reference Levendusky2010; Rogowski and Sutherland Reference Rogowski and Sutherland2016; Zingher and Flynn Reference Zingher and Flynn2018), incivility has been linked to an unwillingness to compromise and lowered affective evaluations of the political opposition (for example, Gervais Reference Gervais2019; Mutz Reference Mutz2007). Of course, it is not impossible for distinct phenomena to affect citizens in similar ways, but the potential for empirical confounding in many studies makes it hard to know whether the effects of incivility and issue polarization actually differ.
This article advances our understanding of how elite conflict affects citizens by carefully separating the effects of greater issue polarization from those of a more uncivil tone of debate.Footnote 1 This is done both experimentally and observationally, using both representative and diverse samples of the US population.
Contrary to what one might expect based on prior research, the results clearly show that the two aspects of elite conflict have different effects on citizens. Heightening the level of incivility lowers trust in politicians, but greater issue polarization does not. Conversely, greater issue polarization creates attitude polarization, but heightening the level of incivility does not. However, both aspects of elite conflict create affective polarization by increasing the animosity toward the other party.
These results speak to the ongoing academic debate about the nature of elite polarization. While I am not the first to propose that the extent of issue polarization should be distinguished from the level of incivility, the results demonstrate why the distinction matters when studying opinion formation. The two dimensions of elite conflict have different effects on trust and attitude polarization because they provide citizens with different types of information; it is therefore important not to confound them.
Furthermore, the results have real-world implications. Politicians, journalists and scholars frequently argue that disagreements among politicians should be tolerated but that being disagreeable should not. My results show that changing the tone of debate may improve political trust, but to bridge divides between ordinary Democrats and Republicans, the parties have to agree more on substantive matters. As long as Congress is polarized in terms of issue positions, we will see polarization and animosity among partisans, regardless of the level of civility.
Distinct, but Confounded, Dimensions of Conflict
The level of incivility and the degree of issue polarization should be thought of as conceptually distinct dimensions of elite conflict (Mutz Reference Mutz2015; Mutz Reference Mutz2017; Schraufnagel Reference Schraufnagel2005). Issue polarization concerns the distance in terms of policy positions between the parties and the homogeneity of each party (for example, Druckman, Peterson and Slothuus Reference Druckman, Peterson and Slothuus2013; Levendusky Reference Levendusky2009, Reference Levendusky2010), whereas incivility concerns the amount of respect politicians show their opponents (Brooks and Geer Reference Brooks and Geer2007; Coe, Kenski and Rains Reference Coe, Kenski and Rains2014).Footnote 2 The two phenomena certainly co-vary to some extent in the real world, but we do see some independent movement over time (Dodd and Schraufnagel Reference Dodd, Schraufnagel, Frisch and Kelly2013), and there is no necessary connection between them (Mutz Reference Mutz2015; Mutz Reference Mutz2017; Schraufnagel Reference Schraufnagel2005; see Paris Reference Paris2017 for a similar point on civility and bipartisanship). That is, politicians can disagree considerably about policy without resorting to name calling or the use of pejoratives, but they can also engage in such behavior without actually disagreeing to any great extent (Mutz Reference Mutz2015; Mutz Reference Mutz2017; Paris Reference Paris2017; Schraufnagel Reference Schraufnagel2005). Nevertheless, ‘polarization’ is often used as a catch-all term for conflict more generally (Persily Reference Persily and Persily2015), and, as I argue below, the two dimensions have been repeatedly confounded in both observational and experimental studies.
In observational studies, the challenge is that researchers do not control for one dimension of conflict when examining the effects of the other. A review of observational studies that have examined the effects of either dimension of conflict in the last 10 years (limited to articles indexed by Web of Science, see Appendix A1) shows that no study included such a control. Given the likely correlation between incivility and issue polarization, this makes it impossible to determine their independent effects.
In experimental studies, the risk of confounding typically arises from the word choice in the treatment material. For instance, when designing uncivil communication, researchers often include words that signal not only disrespect but also strong issue polarization. An illustrative example is the uncivil message used by Gervais (Reference Gervais2015; see also Gervais Reference Gervais2019). Here, the college policies of President Obama are described as ‘socialist’, which can surely be considered disrespectful in an American context. However, given the ideological content of the word, it might also signal something about the policy positions of the president and the messenger. The same can be said when words such as ‘left wing’, ‘commie’ or ‘Nazi’ are used as pejoratives (see Borah Reference Borah2014; Hwang, Kim and Huh Reference Hwang, Kim and Huh2014; Middaugh, Bowyer and Kahne Reference Middaugh, Bowyer and Kahne2017).
Similarly, many of the phrases used to manipulate issue polarization also risk sending signals along both dimensions. For instance, to make issue polarization appear high, Mullinix (Reference Mullinix2016) tells participants that the ‘political atmosphere’ is ‘incredibly competitive and highly polarized’, and Druckman, Peterson and Slothuus (Reference Druckman, Peterson and Slothuus2013) tell them that ‘the partisan divide is stark as the parties are far apart’. While researchers used to working with ideological continua might read such statements as mere descriptions of policy positions, we cannot be sure that laypeople interpret them in this way; in everyday language, these words might also signal a lack of mutual respect. Furthermore, this potential for confounding grows even larger when words such as ‘bickering’ are used to manipulate issue polarization (see Harrison Reference Harrison2016; Robison and Mullinix Reference Robison and Mullinix2016).
However, the risk of confounding in experiments does not only arise when words and phrases are open to multiple interpretations. As Dafoe, Zhang and Caughey (Reference Dafoe, Zhang and Caughey2018) argue, manipulating information about a particular attribute might alter beliefs about other attributes as well. Thus participants might infer something about the level of incivility when presented with information about the level of issue polarization, and vice versa, given that the two dimensions are often linked in public debate (Levendusky and Malhotra Reference Levendusky and Malhotra2016). If so, the risk of confounding extends to experiments with unambiguous or non-verbal treatment material (for example, Levendusky Reference Levendusky2010).
To be sure, the claim is not that the two dimensions of elite conflict were confounded in all previous experiments. Rather, it is hard to know when we can rule out confounding, especially as it has not been customary to include post-treatment measures tapping both perceived incivility and perceived issue polarization. Mutz (Reference Mutz2015) recently raised this point in relation to studies of incivility:
[M]ost of the studies that have examined the impact of incivility thus far have not included measures to establish that incivility was manipulated independent of other factors such as the partisan extremity of the communication source. This makes it difficult to know how much of any identified effect is style, and how much is perceived political substance. Is it the manner in which views are being exchanged that is important, or does the extremity of the views produce a given outcome? (Mutz Reference Mutz2015, 194)
To examine how rare such post-treatment measures actually are, a review has also been conducted of experimental studies examining the effects of elite incivility or issue polarization in the last 10 years (limited to articles indexed by Web of Science, see Appendix A2). Apart from the studies by Mutz,Footnote 3 no studies included measures of both perceived incivility and perceived issue polarization.
In sum, the independent effects of issue polarization and incivility remain unclear. Paris (Reference Paris2017) recently made a related point in her study of how different aspects of legislative conflict affect citizens. She argued that three prior studies focusing on partisan voting in Congress had possibly confounded this concept with other things, including incivility (Paris Reference Paris2017, 476–477). I agree with Paris, and our arguments are related since partisan voting can signal issue polarization. However, I believe the potential for confounding is not limited to the few studies focusing on partisan voting in Congress but applies more broadly to the literature on polarization. This also means that Paris and I focus on different outcomes. While she compared the effects of incivility and partisanship on evaluations of politicians and confidence in Congress,Footnote 4 I focus on a wider set of variables frequently studied in the polarization literature.
The Effects of Incivility and Issue Polarization
This article seeks to disentangle the effects of the two dimensions of conflict on (1) trust in politicians, (2) polarization among partisans in terms of policy attitudes and (3) affective polarization among partisans. All three outcomes have been studied frequently in the literature, and all three have – at least to some extent – been linked to both elite incivility and issue polarization. In the following sections, I review theoretical arguments offered in prior studies to show that there are, at least a priori, reasons to expect both the level of incivility and issue polarization to affect all three, and it is thus hard to say anything about their unique effects based on theory alone.
Trust in Politicians
Several researchers argue that incivility reduces trust in politicians, Congress or the government more generally (Borah Reference Borah2014; Forgette and Morris Reference Forgette and Morris2006; Mutz and Reeves Reference Mutz and Reeves2005; Paris Reference Paris2017). A typically offered rationale is that trust in politicians depends on whether citizens think elected officials will ‘observe the rules of the game’, and displays of incivility provide seemingly informative cues about whether they will do so. Specifically, when politicians shout or turn to name calling, they breach norms of social interaction that people only rarely disregard in everyday life (Funk Reference Funk, Hibbing and Theiss-Morse2001, 197), which makes citizens doubt whether politicians care about the common rules at all.
However, other researchers argue that the level of incivility is not the (only) aspect of elite conflict that affects political trust; issue polarization might also have an effect (Brady, Harbridge and Ferejohn Reference Brady, Harbridge, Ferejohn, Nivola and Brady2008; Jones Reference Jones2015; King Reference King, Nye, Zelikow and King1997; Uslaner Reference Uslaner2015).Footnote 5 For instance, some suggest that the ideological positions of members of Congress have become more polarized than those of the American public, and that this discrepancy creates distrust (for example, Citrin and Stoker Reference Citrin and Stoker2018, 57; King Reference King, Nye, Zelikow and King1997). Hetherington (Reference Hetherington2005, 23) summarizes this argument in the following way: ‘[T]hose in the political center – the majority of Americans – are now less likely to trust the government because they see the parties as too far apart from ordinary people and too close to the ideological poles’.
Hypothesis 1A Trust in politicians is lower when elite debate is uncivil than when it is civil.
Hypothesis 1B Trust in politicians is lower when issue polarization is high than when it is low.
Polarization of Policy Attitudes
Though scholars disagree on whether Americans are polarized in general (for example, Abramowitz and Saunders Reference Abramowitz and Saunders2008; Fiorina, Abrams and Pope Reference Fiorina, Abrams and Pope2008), they agree that partisan polarization has increased, making the gap between the policy attitudes of Republicans and Democrats wider on many issues (Abramowitz and Saunders Reference Abramowitz and Saunders2008; Fiorina, Abrams and Pope Reference Fiorina, Abrams and Pope2008; Hetherington Reference Hetherington2009; Layman, Carsey and Horowitz Reference Layman, Carsey and Horowitz2006). Many point to elite issue polarization as a leading cause. For instance, Levendusky (Reference Levendusky2009, Reference Levendusky2010) argues that issue polarization creates clearer cues, enabling people to adopt the positions of their preferred party. In turn, this widens the attitude gap. Relatedly, Druckman, Peterson and Slothuus (Reference Druckman, Peterson and Slothuus2013) argue that issue polarization decreases ambivalence and increases motivated reasoning. Therefore, in a polarized environment, people pay less attention to arguments and instead rely solely on party cues.
However, there is also research indicating that the level of civility might have an effect. For instance, Anderson et al. (Reference Anderson2014) argue that people use incivility as a cue when forming opinions on unfamiliar issues such as nanotechnology and that this can polarize attitudes about how risky the technology is. Relatedly, Gervais (Reference Gervais2019) argues that incivility from both elites and other sources can produce feelings of anger, and that anger makes people rely more heavily on party cues and pre-existing viewpoints. Ultimately, incivility reduces the willingness to compromise.Footnote 6
Hypothesis 2A Partisan attitude polarization is greater when elite debate is uncivil than when it is civil.
Hypothesis 2B Partisan attitude polarization is greater when issue polarization is high than when it is low.
Affective Polarization
Affective polarization is the degree to which partisans have negative feelings toward the opposing party, its politicians and its supporters (Iyengar, Sood and Lelkes Reference Iyengar, Sood and Lelkes2012; Iyengar and Westwood Reference Iyengar and Westwood2015). Again, some researchers point to rising incivility – or closely related phenomena – as an important cause. For instance, Mutz (Reference Mutz2007) finds that incivility polarizes thermometer ratings of politicians; if a televised debate featuring close-ups goes from civil to uncivil, people decrease their ratings of their least-liked candidate.Footnote 7 Mutz argues that this affective polarization occurs because incivility creates arousal, which can ‘intensify the negative affect viewers have for disliked people’ (Mutz Reference Mutz2007, 624). Relatedly, Iyengar, Sood and Lelkes (Reference Iyengar, Sood and Lelkes2012, 23) propose that exposure to ‘loud and negative political campaigns’ causes affective polarization by reinforcing partisan identity and confirming stereotypical beliefs about opponents.
Other researchers link affective polarization to elite issue polarization. For instance, Rogowski and Sutherland (Reference Rogowski and Sutherland2016) and Webster and Abramowitz (Reference Webster and Abramowitz2017) find that increased ideological differences between politicians produce polarized thermometer rankings (see also Hetherington Reference Hetherington2001). Rogowski and Sutherland offer two explanations. First, as the ideological distance increases, the stakes associated with choosing between candidates become higher. Secondly, issue polarization may lead to motivated reasoning in which citizens form attitudes with less reflection, which heightens in-group favoritism.
Hypothesis 3A Affective polarization is greater when elite debate is uncivil than when it is civil.
Hypothesis 3B Affective polarization is greater when issue polarization is high than when it is low.
Study Design
To disentangle and compare the effects of each dimension of elite conflict, I rely on one main study and three follow-up studies. The design for the main study is presented in this section, and the follow-up studies are presented following the results. The main study is a 2 (civility/incivility) × 2 (low issue polarization/high issue polarization) factorial experiment in which each dimension of conflict is manipulated independently, creating four ‘states of the world’ with varying combinations of elite conflict. The experiment was embedded in a survey administered to a representative (on age, gender, geography and education) sample (n = 1,279)Footnote 8 of the adult US population by YouGov in March 2017.
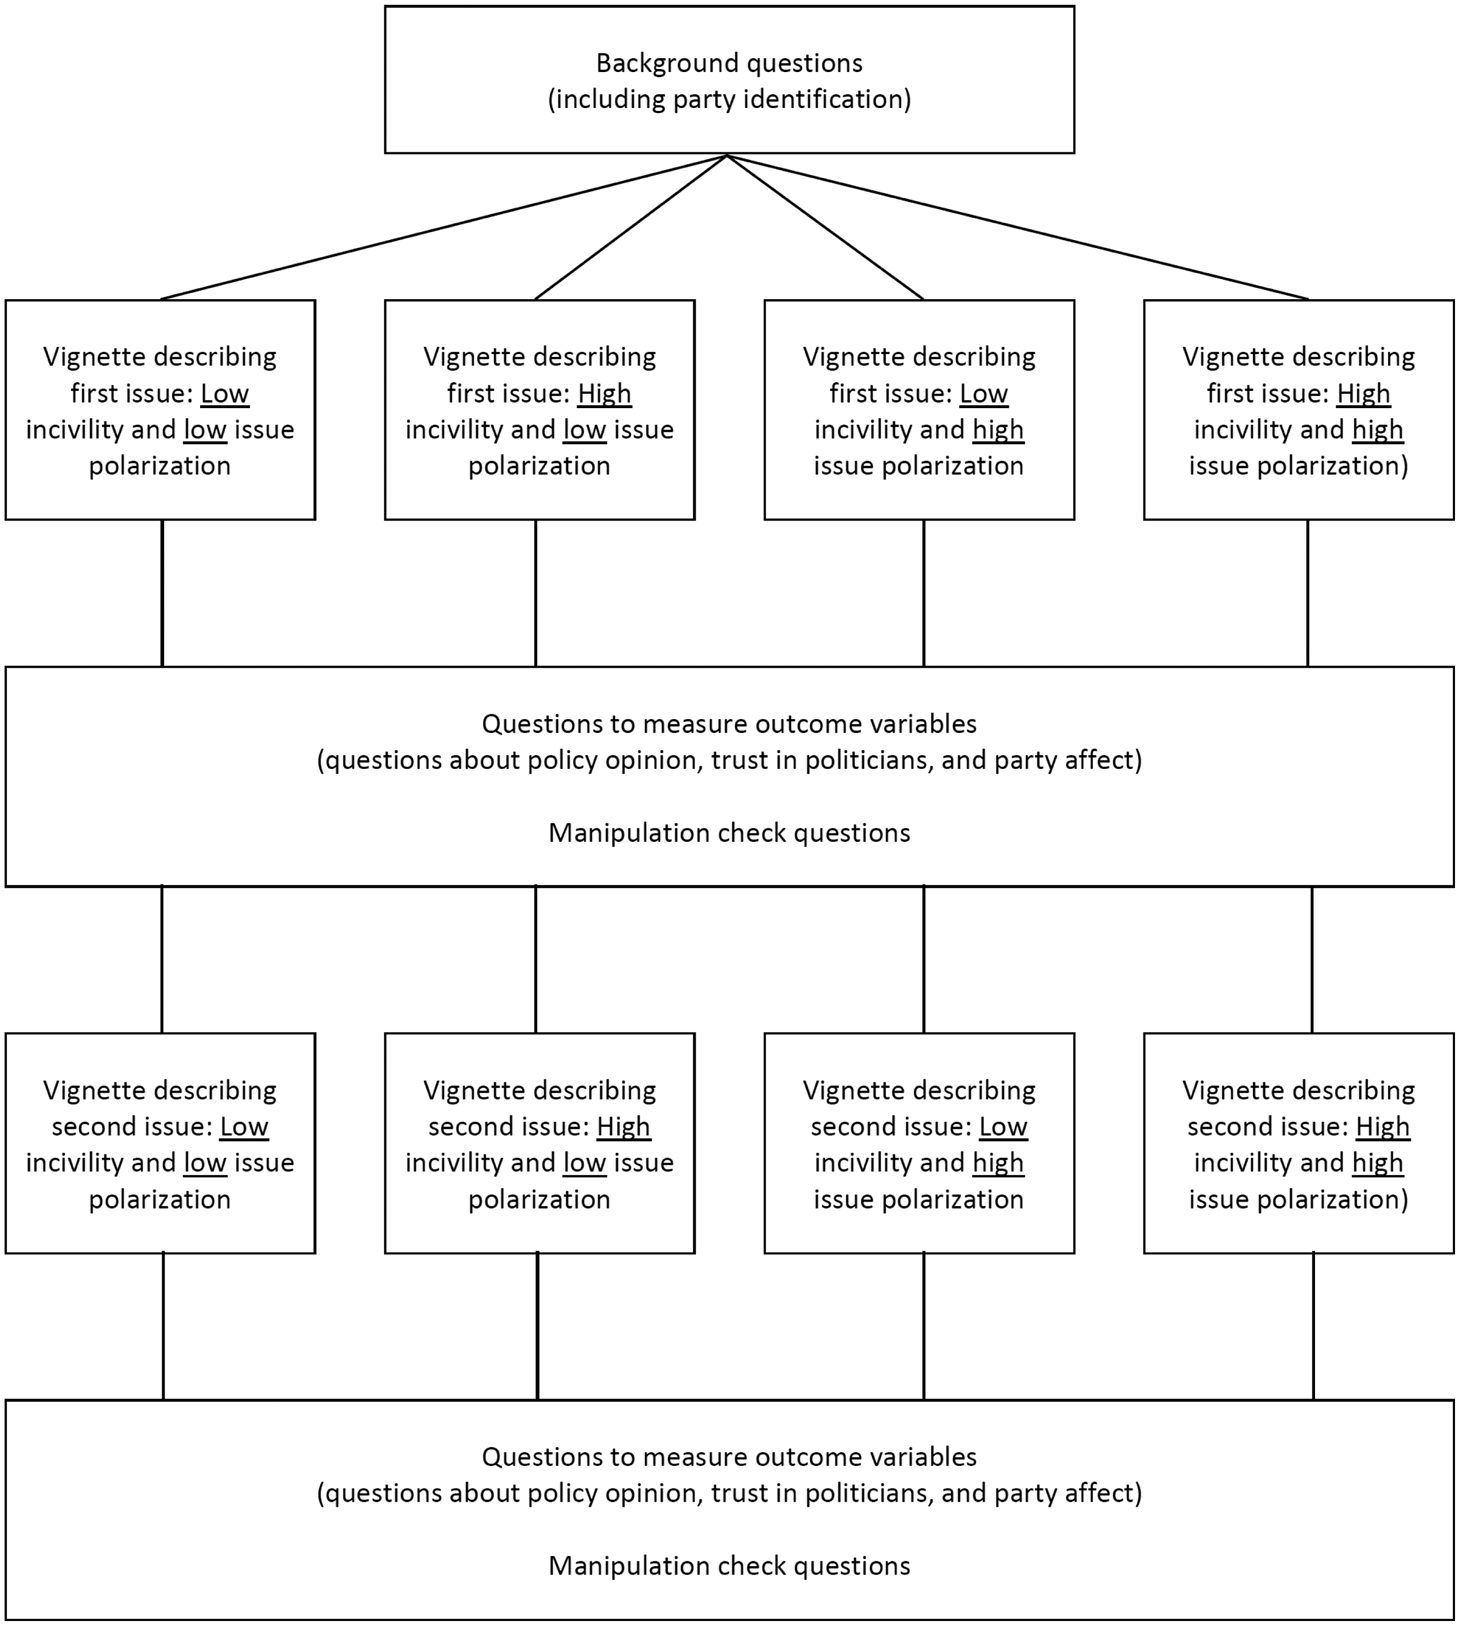
In the experiment, participants were first presented with information concerning a political issue on which some members of Congress are supposedly working. The information consisted of a few lines describing the level of issue polarization and a few lines describing the level of civility among politicians working on the issue. Upon reading this, participants were given a series of questions measuring the three outcomes of interest. To make the results less dependent on the specificities of one political issue, this procedure was then repeated using a different issue (for a similar approach, see Brooks and Geer Reference Brooks and Geer2007, 6). The two issues were whether drilling should be allowed off the Atlantic Coast and in the Arctic, and whether private firms should be in charge of air traffic controllers. High-salience issues were avoided to reduce pretreatment effects (for use of similar issues, see Druckman, Peterson and Slothuus Reference Druckman, Peterson and Slothuus2013; Levendusky Reference Levendusky2009). The issue order was randomized, and the survey flow is illustrated in Figure 1.
Survey flow
Note: the experiment also included a fifth group that did not receive information concerning the level of incivility and issue polarization on the two issues. See section following the follow-up studies for results including this benchmark condition.
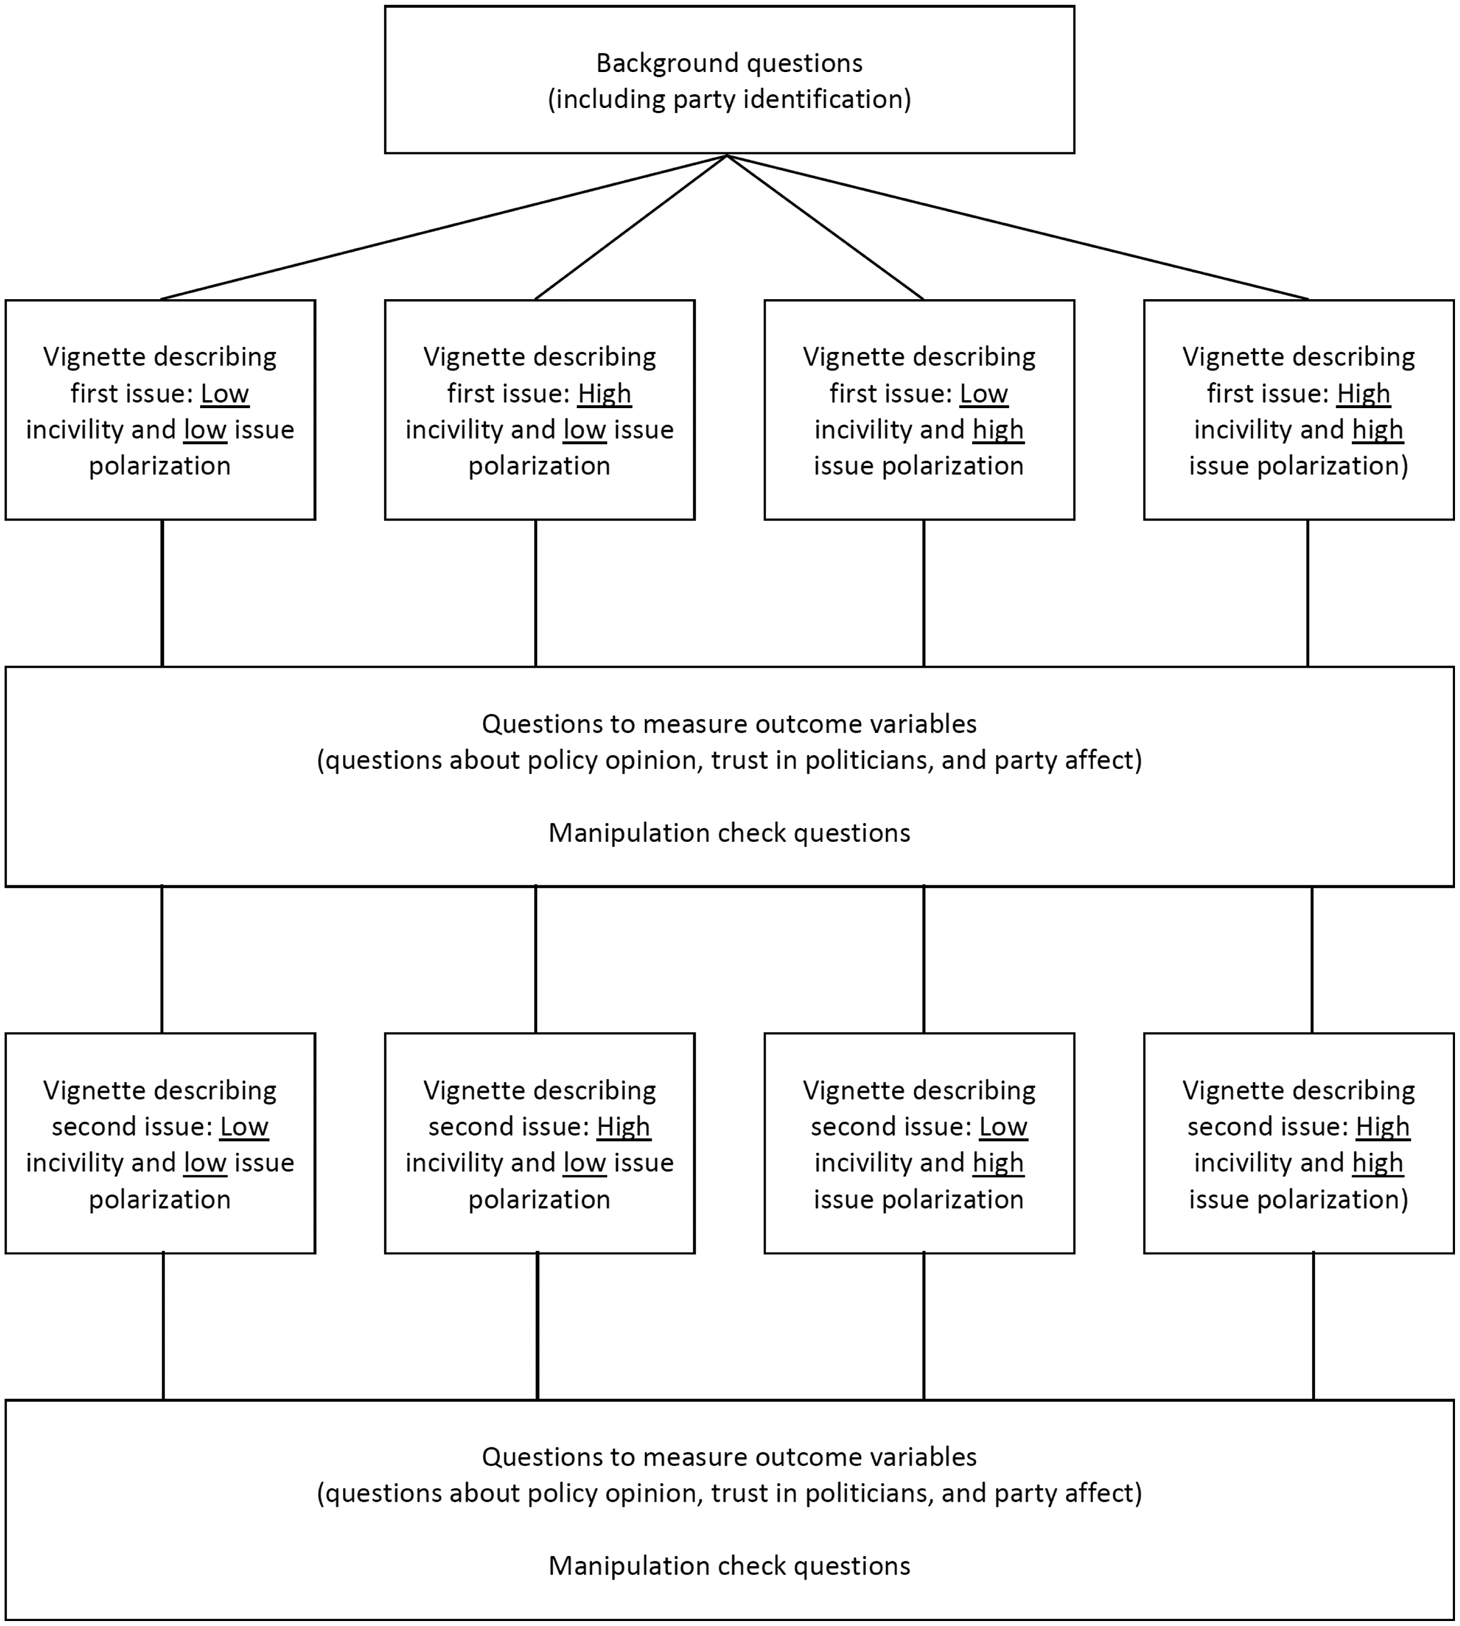
To increase experimental realism, it was important not to present participants with information on one issue that could be seen as contradicting the information on the other. The levels of issue polarization and incivility in the description of the second issue were thus aligned with the levels in the description of the first issue. Accordingly, the two issues are not separate experiments.
Manipulating the Two Dimensions of Conflict
To manipulate perceptions of issue polarization, participants were given information regarding the homogeneity of the parties and the distance between them in terms of policy positions, which corresponds to the definition offered earlier. In the polarized conditions, participants were told that the differences of opinion are large, and that most members of each party are on the same side of the issue as the rest of their party. In the unpolarized conditions, participants were told that differences of opinion are small and that members of each party can be found in large numbers on both sides of the issue.
To manipulate perceptions of incivility, participants were told that the tone of debate between the politicians working on each of the issues had been either ‘very harsh’ or ‘quite respectful’. They were also given two short quotes that were supposedly from a leading Democrat and a leading Republican. In the uncivil conditions, the quotes were rude and insulting (for example, saying that the political opponents have ‘rotten intentions’), and in the civil conditions, they signaled respect (for example, saying that the political opponents have ‘good intentions’).Footnote 9 To provide a sense of the full vignettes, a high issue polarization-incivility vignette is included below (see Appendix A3 for all vignettes).
Drilling off the Atlantic Coast and in the Arctic
Some members of Congress have recently been discussing whether to allow drilling for oil and gas off the Atlantic Coast and in the Arctic.
Strong disagreement between the parties
On average, Democrats in Congress tend to be strongly opposed to drilling, while Republicans tend to be strongly in favor of it, and the differences of opinion are generally large. Opinions are clearly split along partisan lines as most members of each party are on the same side as the rest of their party.
Harsh tone of debate
At the same time, the debate on this issue has been very harsh. For instance, a leading Republican member of Congress who supports drilling has said that the opponents ‘have rotten intentions’. Likewise, a leading Democratic member of Congress who opposes drilling has said that the supporters ‘are bad people who can't stop lying’.
A total of four pairs of quotes (two civil and two uncivil) were created, making it possible to use different quotes on each issue.Footnote 10 All quotes were inspired by comments from real politicians, and a prior study on Amazon's Mechanical Turk (n = 101) confirmed that they were balanced, meaning that each quote was approximately as rude or polite as the other quote in the pair (see Appendix A4). To further ensure balance, it was randomized whether the Republican or the Democratic politician was the author of each of the statements within each pair, and it was randomized which quote pair went with which issue.
While the main purpose of the factorial experiment was to compare responses across the four hypothetical ‘states of the world’, a fifth condition in which participants read only the first vignette paragraph was also included (see Gaines, Kuklinski and Quirk Reference Gaines, Kuklinski and Quirk2007, 8–9). Including this benchmark condition makes it possible to compare responses in the four states to those obtained in the absence of new information (that is, ‘our world’), which is an additional analysis presented after the results of the follow-up studies.
Outcome Measures
Questions measuring the three outcomes followed the description of each issue. Trust in politicians was measured using two questions: (1) ‘How much trust do you have in the members of Congress who work on this issue?’ (1 = ‘a great deal of trust’; 4 = ‘hardly any trust’) and (2) ‘To what extent do you perceive the members of Congress who work on this issue to be trustworthy?’ (1 = ‘to a very high extent’; 9 = ‘to no extent’). Issue-specific trust questions were chosen to minimize spill-over effects from one issue to the other (for similar measures, see Bøggild Reference Bøggild2016). The two measures were rescaled and added to form an index (α = 0.86) ranging from 0 (no trust) to 1 (maximum trust).
To measure polarization of policy attitudes, participants were asked about their attitudes on each issue. Following the drilling vignette, they were asked: ‘Given this information, to what extent do you oppose or support drilling for oil and gas off the Atlantic Coast and in the Arctic?’ (1 = ‘strongly support; 7 = ‘strongly oppose’) Following the air traffic controllers vignette, they were asked: ‘Given this information, to what extent do you oppose or support allowing private firms to be in charge of air traffic controllers?’ (1 = ‘strongly support; 7 = ‘strongly oppose’, for similar measures, see Druckman, Peterson and Slothuus Reference Druckman, Peterson and Slothuus2013). Attitude polarization was calculated as the difference in attitudes between Republicans and Democrats (including leaners) and recoded to range from −1 (Republicans strongly support stance of Democratic Party, Democrats strongly support stance of Republican Party) over 0 (no difference) to 1 (Republicans strongly support stance of Republican Party, Democrats strongly support stance of Democratic Party).
To measure affective polarization, two different kinds of items were used, reflecting standard approaches in the literature (Lelkes Reference Lelkes2016, 401–402). First, participants were presented with a 101-point feeling thermometer asking them to indicate how warm or cold they felt toward the Democrats and the Republicans who are working on the issues. Secondly, participants were asked to indicate how well the words ‘intelligent’, ‘mean’ and ‘selfish’ describe the two groups (1 = ‘describes them extremely well’; 5 = ‘does not describe them’). In both cases, affective polarization was calculated for partisans (including leaners) as the difference between in- and out-party ratings. These two measures were then rescaled and added to form an index (α = 0.81) ranging from −1 (strong negative feelings about own party, strong positive feelings about opposing party) over 0 (indifference) to 1 (strong positive feelings about own party, strong negative feelings about opposing party).
To minimize respondent fatigue, it was important not to ask too many similar-sounding questions. Therefore, only questions about policy attitudes were included after both issues. In contrast, respondents had to answer questions about affective polarization and trust only once when completing the survey. For half the participants, the trust questions followed the first issue description, and the affective polarization questions followed the second; for the other half, the affective polarization questions followed the first issue description, and the trust questions followed the second.Footnote 11
Manipulation Check
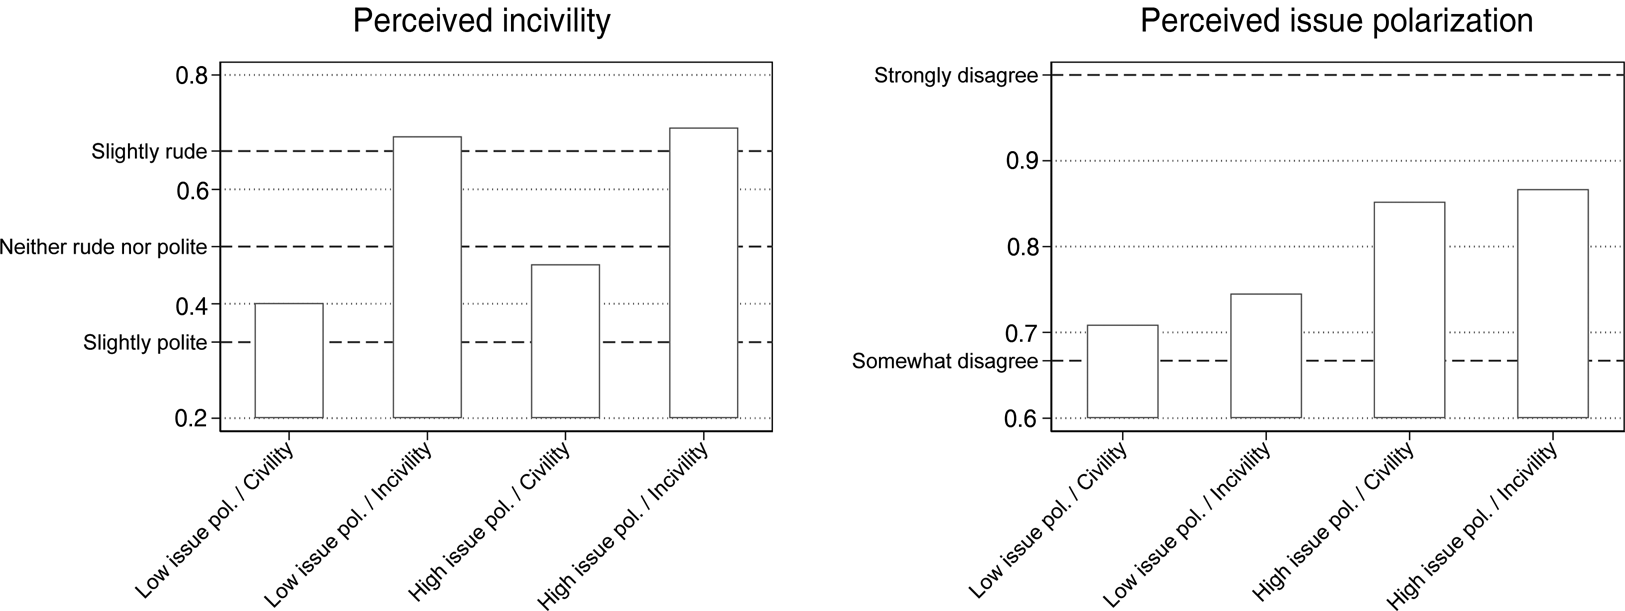
To ensure that each dimension of conflict was manipulated separately, the survey also contained items measuring perceived issue polarization and perceived incivility on each issue. To measure the former, participants indicated on a four-point scale how much the Democrats and Republicans agree or disagree on each issue, regardless of the tone of the debate. To measure the latter, participants indicated on a seven-point scale how rude or polite the debate concerning each issue was, regardless of how much the parties agree or disagree.
Average ratings across the issues are presented in Figure 2, which shows that the stimulus material succeeded in manipulating each dimension of conflict separately. The only substantial differences in perceived issue polarization are between the high- and low-polarization conditions, and the only substantial differences in perceived incivility are between the incivility and civility conditions. Furthermore, we also see that while the civility treatment contained complimentary statements, it was not overly strong; average perceived incivility in the civil conditions is 0.44, placing it close to the middle of the scale.
Manipulation check
Note: y-axis labels correspond to the survey question labels.

Results
As there were no discernible interaction effects between the two dimensions of conflict on any outcome, I present only the average effects of changing levels of issue polarization and incivility. Furthermore, the results are not broken down by issue or party identification (see Appendix A11),Footnote 12 nor do they contain comparisons with the benchmark condition (discussed in more detail below).
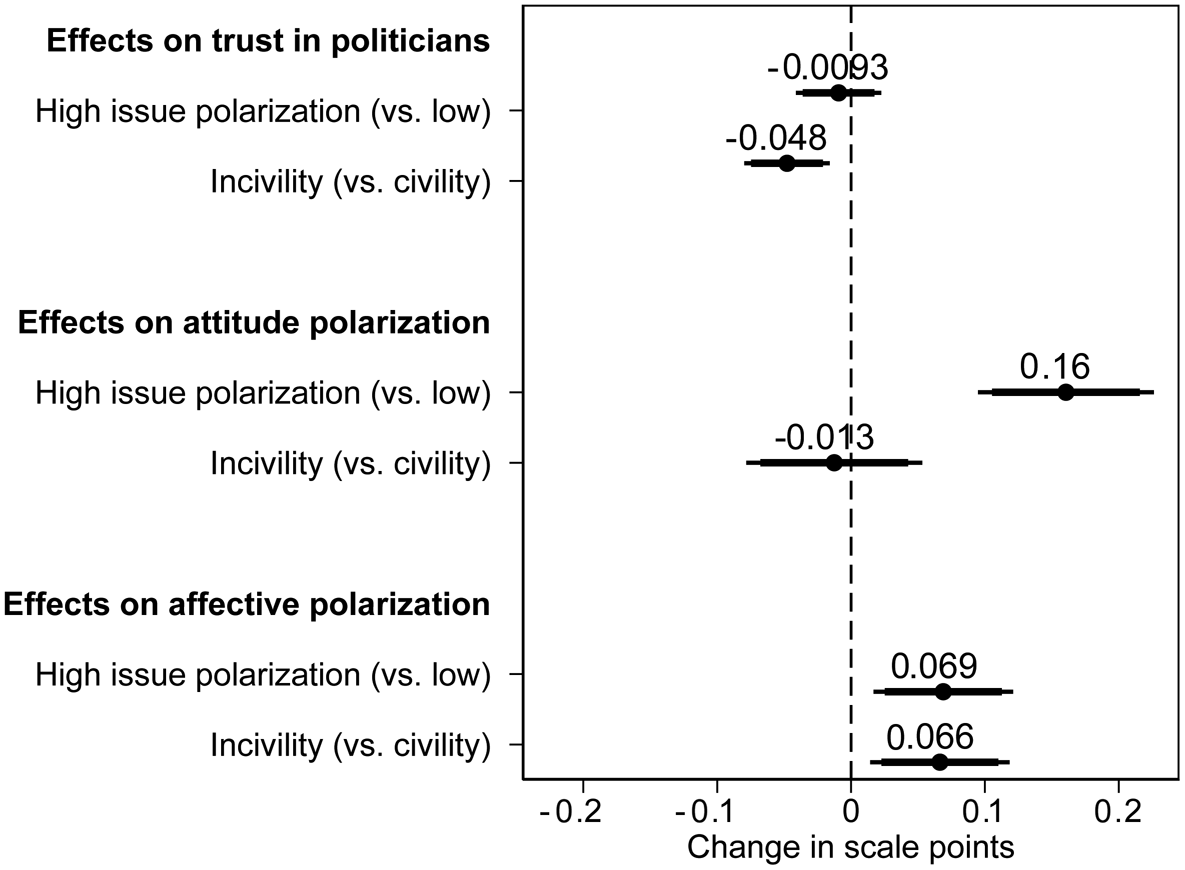
In the top part of Figure 3, the effects on trust in politicians (on both issues pooled) are shown. Trust in politicians is, on average, 0.05 scale points (p = 0.003) lower for participants in the uncivil conditions compared to those in the civil conditions. This effect is small in size, but nevertheless indicates clear support for Hypothesis 1A.Footnote 13
Effects of incivility and issue polarization in main study
Note: OLS regression coefficients (see Appendix A5). Error bars represent 90 and 95 per cent confidence intervals.
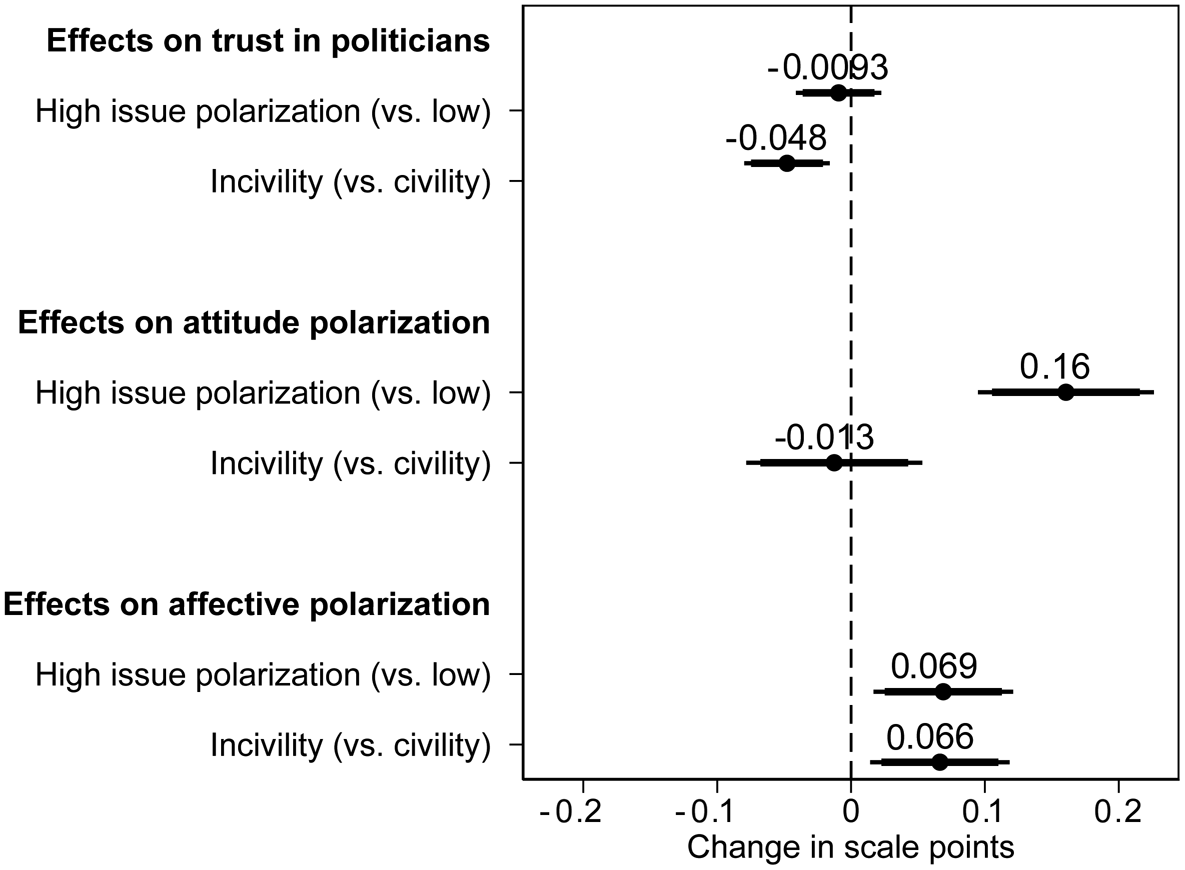
However, the same cannot be said for Hypothesis 1B. Although there is a slight negative tendency, trust is not affected by the level of issue polarization at conventional levels of statistical significance (p = 0.568). Furthermore, the effect of incivility is statistically different from the effect of issue polarization at an α level of 0.1 (p = 0.097, Wald test). It thus seems that the tone of debate affects confidence in politicians, but the actual size of the disagreement between the parties is not important.
In the middle part of Figure 3, the effects on attitude polarization (averaged across both issues) are shown. It is clear that the level of civility has no substantial or statistically significant effect on the degree of polarization among partisans. At −0.01 scale points (p = 0.708), the average difference between the civil and uncivil conditions is very close to zero. However, there is strong support for Hypothesis 2B. At 0.16 scale points, the difference between the low and the high issue polarization conditions is both sizeable and statistically significant (p < 0.001). Perhaps surprisingly, the two dimensions of elite conflict thus have distinct effects on both trust in politicians and polarization in terms of attitudes. This contrasts with the pattern in the literature in which incivility and issue polarization often appear to affect citizens in rather similar ways.
However, the effects do not differ on all outcomes. Looking at the bottom part of Figure 3, we see that both dimensions of conflict have small but statistically significant effects on affective polarization. The effect of changing the level of incivility is around 0.07 scale points (p = 0.013),Footnote 14 and the effect of changing the level of issue polarization is also around 0.07 scale points (p = 0.010). It thus seems that affective polarization is created by both heightened incivility and increasing substantive disagreement.
Generalizability of Findings: Three Follow-Up Studies
The generalizability of any one study is limited, and replication using different approaches is needed to establish how far results can travel (Aronson et al. Reference Aronson1990, 82). To test the robustness and reach of the results, three follow-up studies have been conducted in which (1) stronger incivility is added to the vignettes, (2) metacommentary is removed from the vignettes and (3) non-experimental data are used.
Follow-up Study 1: Using Stronger Incivility
Some researchers distinguish between different kinds or levels of incivility with varying strength. Specifically, Sobieraj and Berry (Reference Sobieraj and Berry2011) argue that regular incivility should be distinguished from outrage, which is a harder variant involving efforts to provoke a visceral response from the audience. Similarly, Gervais (Reference Gervais2015) distinguishes between insulting language, extremizing language and histrionics, where the last category is the most potent.
Given this research, a crucial concern is whether my results would be different if the incivility used had been stronger. For instance, the lacking effect on attitude polarization might be the result of the quotes not being sufficiently strong to elicit the anger that triggers such polarization. Of course, saying that opponents have ‘rotten intentions’ is not polite, but given the current political climate, many participants have probably heard worse, and those in the uncivil conditions rated the debate as only ‘slightly rude’ in the manipulation check.
To ensure that the results are not dependent on using a mild incivility, the experiment was replicated in a slightly modified version using a sample from Amazon's Mechanical Turk (n = 1,346)Footnote 15 in early July 2017. The experimental setup was identical to the one described above except that the name calling in the vignettes was harsher. For instance, opponents were referred to as ‘evil’ instead of ‘bad’ and as ‘stupid’ instead of ‘incompetent’ (see Appendix A3). The debate was rated as ‘rude’ in the manipulation check, and scale reliabilities for the dependent measures were again high (α trust = 0.87, α affective polarization = 0.78).
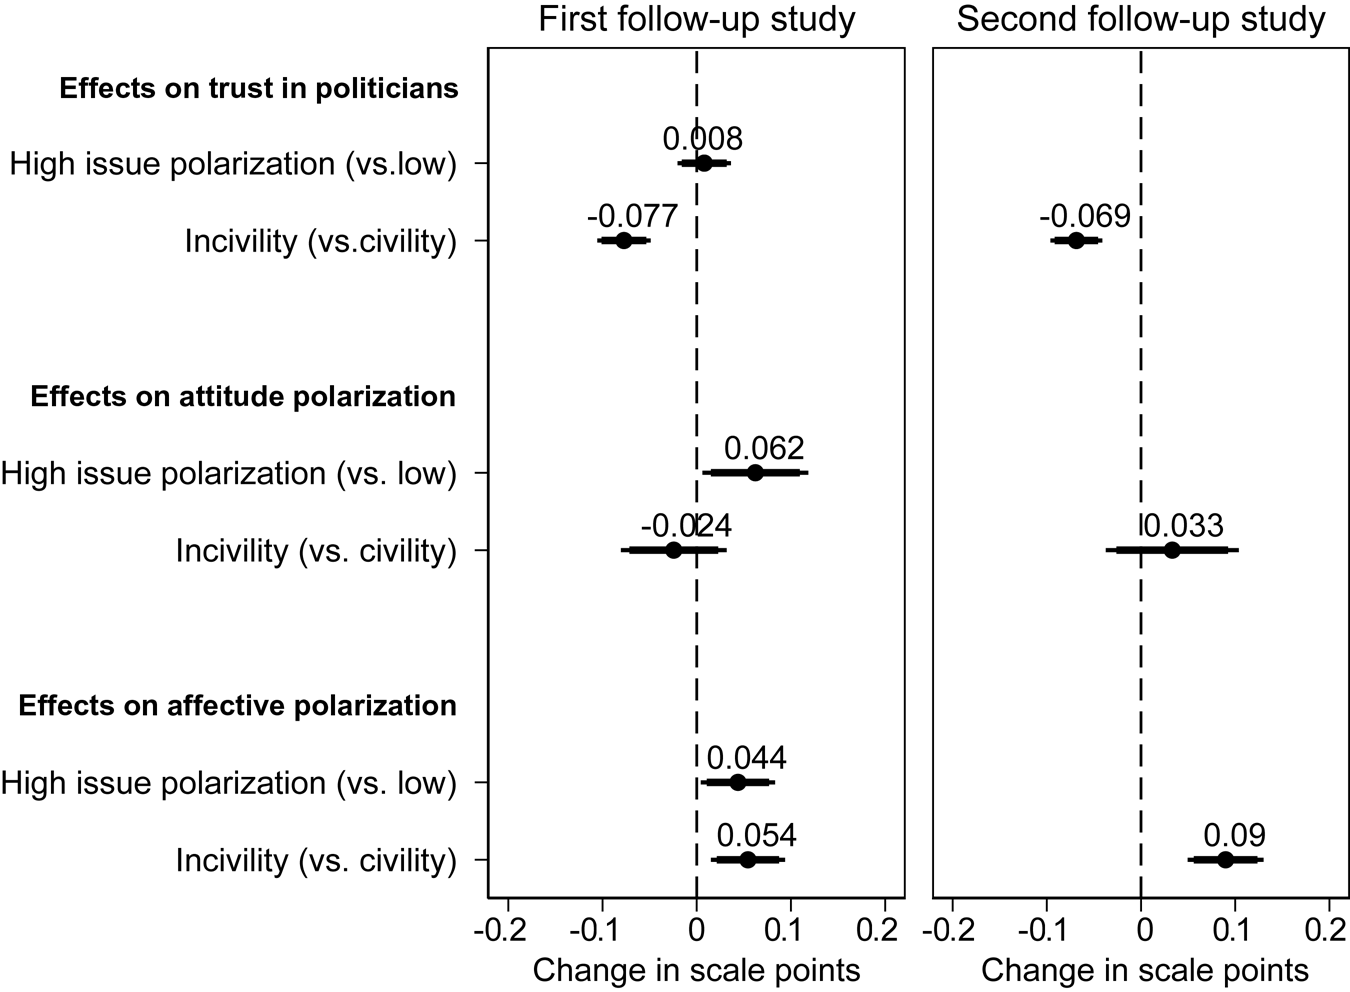
The results are shown in the first panel of Figure 4. Again, we see that issue polarization creates attitude polarization among partisans, but the level of incivility has no significant effect. We also see that trust in politicians is affected by the level of incivility but not by the level of issue polarization, and that both aspects of conflict create affective polarization.
Results from experimental follow-up studies
Note: OLS regression coefficients (see Appendix A5). Error bars represent 90 and 95 per cent confidence intervals.

Follow-up Study 2: Removing Metacommentary
In the experiments presented thus far, perceived incivility was manipulated not only by giving participants quotes attributed to leading politicians, but also by informing them that the debate had been either ‘very harsh’ or ‘quite respectful’. While such metacommentary might be common in news stories, it has seldom been included in prior experiments (for exceptions, see Mutz Reference Mutz2015, 184–189; Paris Reference Paris2017), and there is a risk that its presence might alter the effects. In particular, the evaluative character of the metacommentary might detach participants from the otherwise arousing statements, making it harder for incivility to affect policy attitudes.
To ensure that the results are not dependent on including metacommentary, the experiment was again replicated in a modified version using a sample from Amazon's Mechanical Turk (n = 1,118)Footnote 16 in early March 2019. The experimental setup differed from the setup in the first follow-up study in three regards. First, the vignettes included no metacommentary. Instead, participants were merely presented with ‘excerpts from the debate’, which consisted of expanded versions of the quotes from the first follow-up study (see Appendix A3 for the vignettes). Secondly, only the level of incivility was manipulated in this experiment. The level of issue polarization was described as moderately high to all respondents, and the experiment included no benchmark condition. Thirdly, to make the survey shorter, participants were only exposed to a description of one issue – drilling for oil and gas. The dependent measures were the same as in the prior experiments, and scale reliabilities were again high (α trust = 0.87, α affective polarization = 0.81).
The results are shown in the second column of Figure 4. Again, we see that going from civil to uncivil debate increases affective polarization and decreases trust in politicians, but there is still no discernible effect on attitude polarization. The coefficient is small and not statistically significant. Of course, the confidence interval is somewhat wide, partly because the underlying test is interactional. However, the coefficient remains small and insignificant (b = 0.02, p = 0.294) if the interactional test is abandoned in favor of comparing mean partisan attitude extremity (that is, the extent to which partisans support the position of their party on a scale from 0 to 1) in the two conditions.
Follow-up Study 3: Leaving the Experimental Setting
The last important concern to address involves the stylized nature of the experiments. It might be argued that, even if the two dimensions of conflict affect citizens differently in experiments, they are unlikely to do so in the real world as it is hard for people to distinguish between the level of civility and issue polarization in a less stylized setting. After all, most people do not pay close attention to politics, and they might mistake name calling for actual disagreement.
To address this concern, a survey was conducted on Amazon's Mechanical Turk (n = 510) in early May 2017. The purpose of this non-experimental follow-up study was to see whether natural variation in perceived incivility and perceived issue polarization predict the three outcomes in the same way as in the experiments. Thus the survey contained no vignettes, and the independent variables were instead measured.
Perceived incivility was measured using a modified version of the multi-item manipulation check used by Mutz and Reeves (Reference Mutz and Reeves2005). Specifically, respondents were asked to describe the tone of discussions among politicians using five word pairs (rude/polite, agitated/calm, emotional/unemotional, hostile/friendly and quarrelsome/cooperative) arranged on nine-point scales (see Appendix A13 for the full wording). Answers were rescaled and added to form an index (α = 0.90) ranging from 0 (minimum perceived incivility) to 1 (maximum perceived incivility).
Perceived issue polarization was measured following Westfall et al. (Reference Westfall2015). Respondents placed the Democrats and Republicans in Congress on seven-point scales on three partisan issues – defense spending, regulation of businesses to protect the environment, and guaranteed jobs and income (see Appendix A13). Perceptions of polarization were calculated by subtracting the position of the Democrats from the position of the Republicans. The differences on the three issues were added to form an index (α = 0.70) ranging from −1 (Democrats extremely conservative, Republicans extremely liberal) over 0 (no difference) to 1 (Democrats extremely liberal, Republicans extremely conservative).
For dependent variables, the survey also included measures of trust in politicians, attitude polarization and affective polarization. These were quite similar to the questions used in the experiments; the biggest difference was that policy attitudes were now concerned with the three issues mentioned instead of drilling and air traffic controllers (see Appendix A13). Scale reliabilities were again high (α trust = 0.88, α affective polarization = 0.80, α policy attitudes = 0.77).
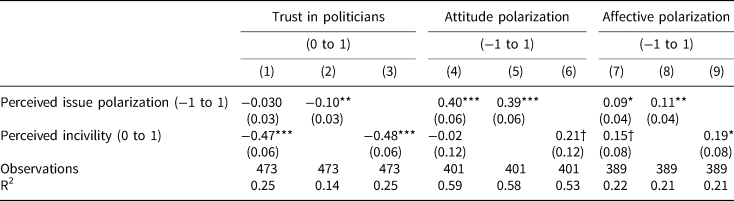
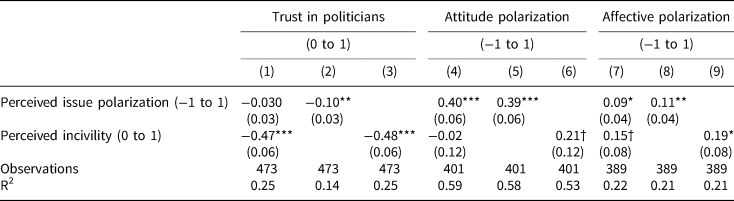
Table 1 shows ordinary least squares (OLS) regression coefficients from models in which perceived levels of conflict (along with relevant controls) are used to predict these outcomes. The main results are in Columns 1, 4 and 7 in which perceived incivility and issue polarization are simultaneously included in the models. These results replicate the patterns found in the experiments. Perceived incivility has a statistically significant effect on trust in politicians, but perceived issue polarization does not. Conversely, perceived issue polarization has a significant effect on attitude polarization, but incivility does not. Both dimensions of conflict have an effect on affective polarization.
Effects of perceived incivility and perceived issue polarization
Note: OLS regression coefficients. Robust standard errors in parentheses. All models include controls for partisan identity strength, political interest, social trust, and economic evaluations (see Appendix A13), but results are robust to not including these. ***p < 0.001, **p < 0.01, *p < 0.05, †p < 0.10
Furthermore, the results also highlight why we should control for incivility when examining the effects of issue polarization and vice versa. Both dimensions of conflict appear to affect all three outcomes when included separately. Only when included in the same model do their unique effects become apparent.
Comparison with Benchmark Condition
The purpose of the factorial experiments was to create four ‘states of the world’ with different degrees of civility and issue polarization and to examine how moving between these affects the outcomes. However, as many scholars also value being able to compare such hypothetical states of the world to ‘our own world’, a benchmark condition was added to both the main study and the first follow-up study (see, for example, Gaines, Kuklinski and Quirk Reference Gaines, Kuklinski and Quirk2007, 8–9). Participants in this condition read only the first vignette paragraph, which provided them with no information about civility or issue polarization.
Before turning to the discussion, this section briefly compares levels of trust, attitude polarization and affective polarization in the benchmark condition to the factorial conditions. To ease presentation, data from the main study and the follow-up study are pooled, but the split results look quite similar (see Appendix A12).
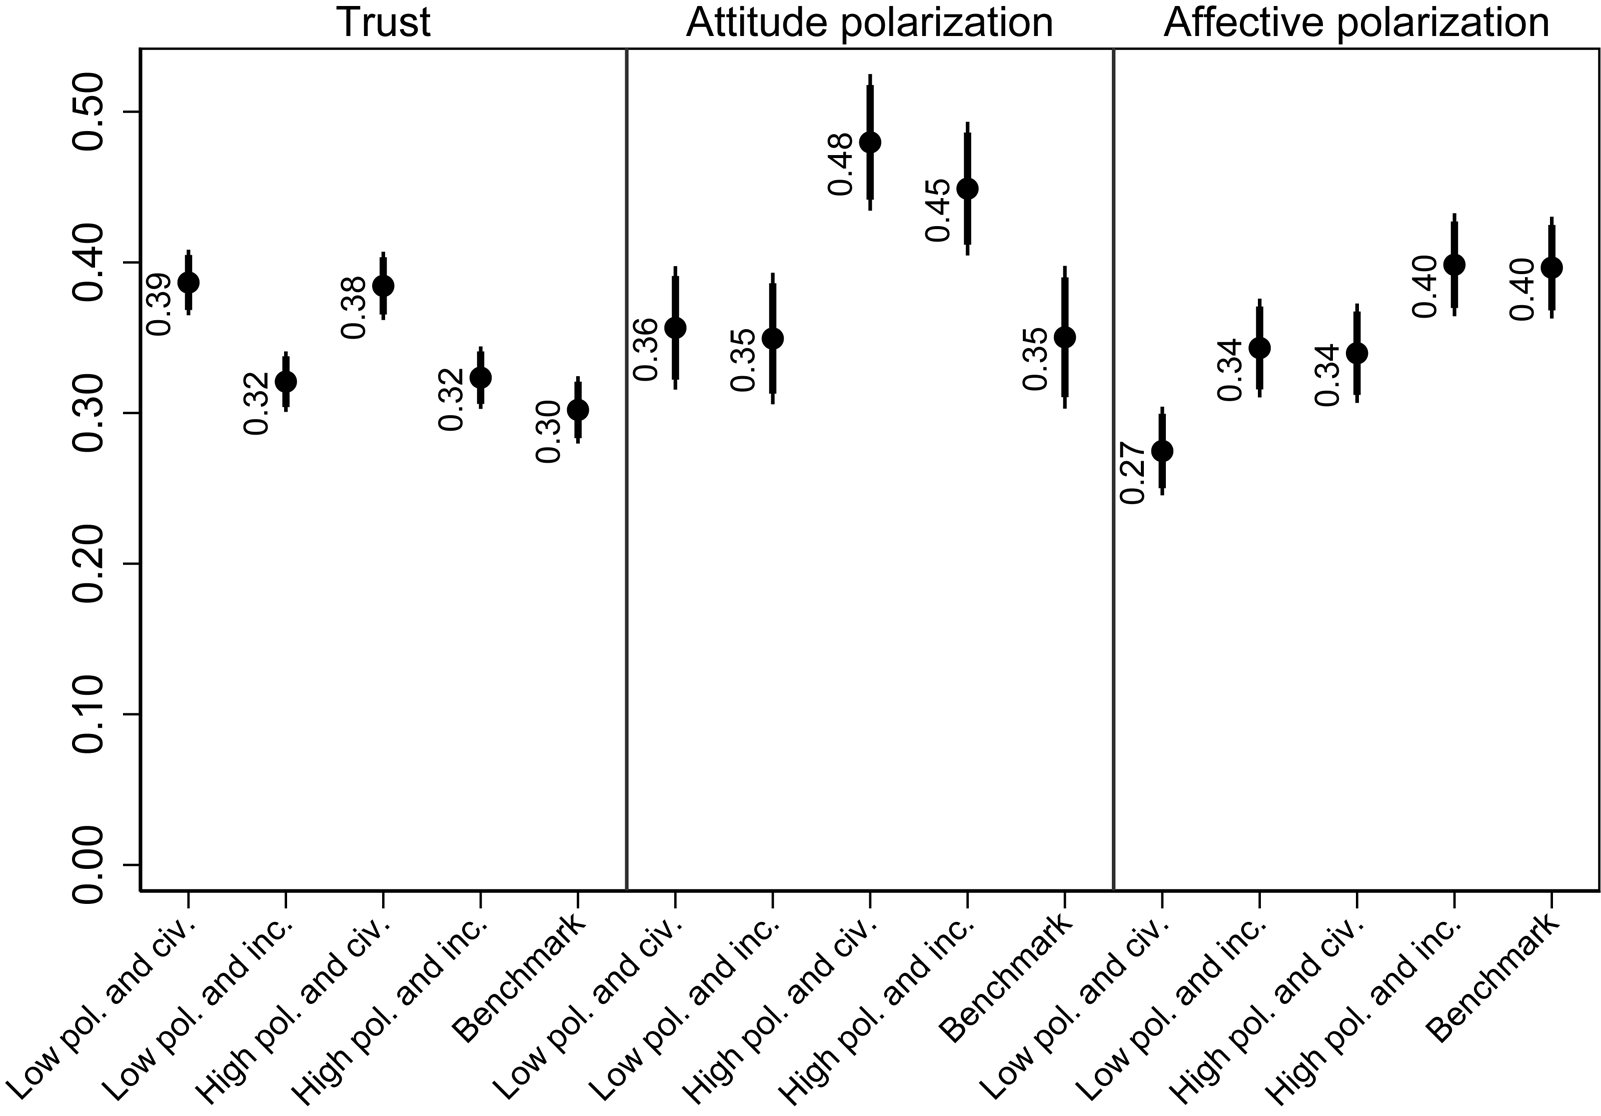
Looking at Figure 5, the perhaps most interesting pattern is found in the first and third panels. Here, we see that civility appears to raise trust and lower affective polarization, while incivility keeps participants at the levels at which they already are. Thus, it seems to be the civil and not the uncivil treatment driving the results. While this does not change the conclusion that going from civil to uncivil debate has negative consequences, it is important to keep in mind when interpreting the results. It implies that Americans are currently not likely to lose further trust in politicians or to become more affectively polarized by uncivil rhetoric, but that more civil debate might reduce these phenomena. What might explain this – perhaps surprising – pattern?
Factorial conditions compared to benchmark condition
Note: average levels of trust in politicians (scale from 0 to 1), average levels of attitude polarization (scale from −1 to 1), and average levels of affective polarization (scale from −1 to 1). Error bars are 90 and 95 per cent confidence intervals.
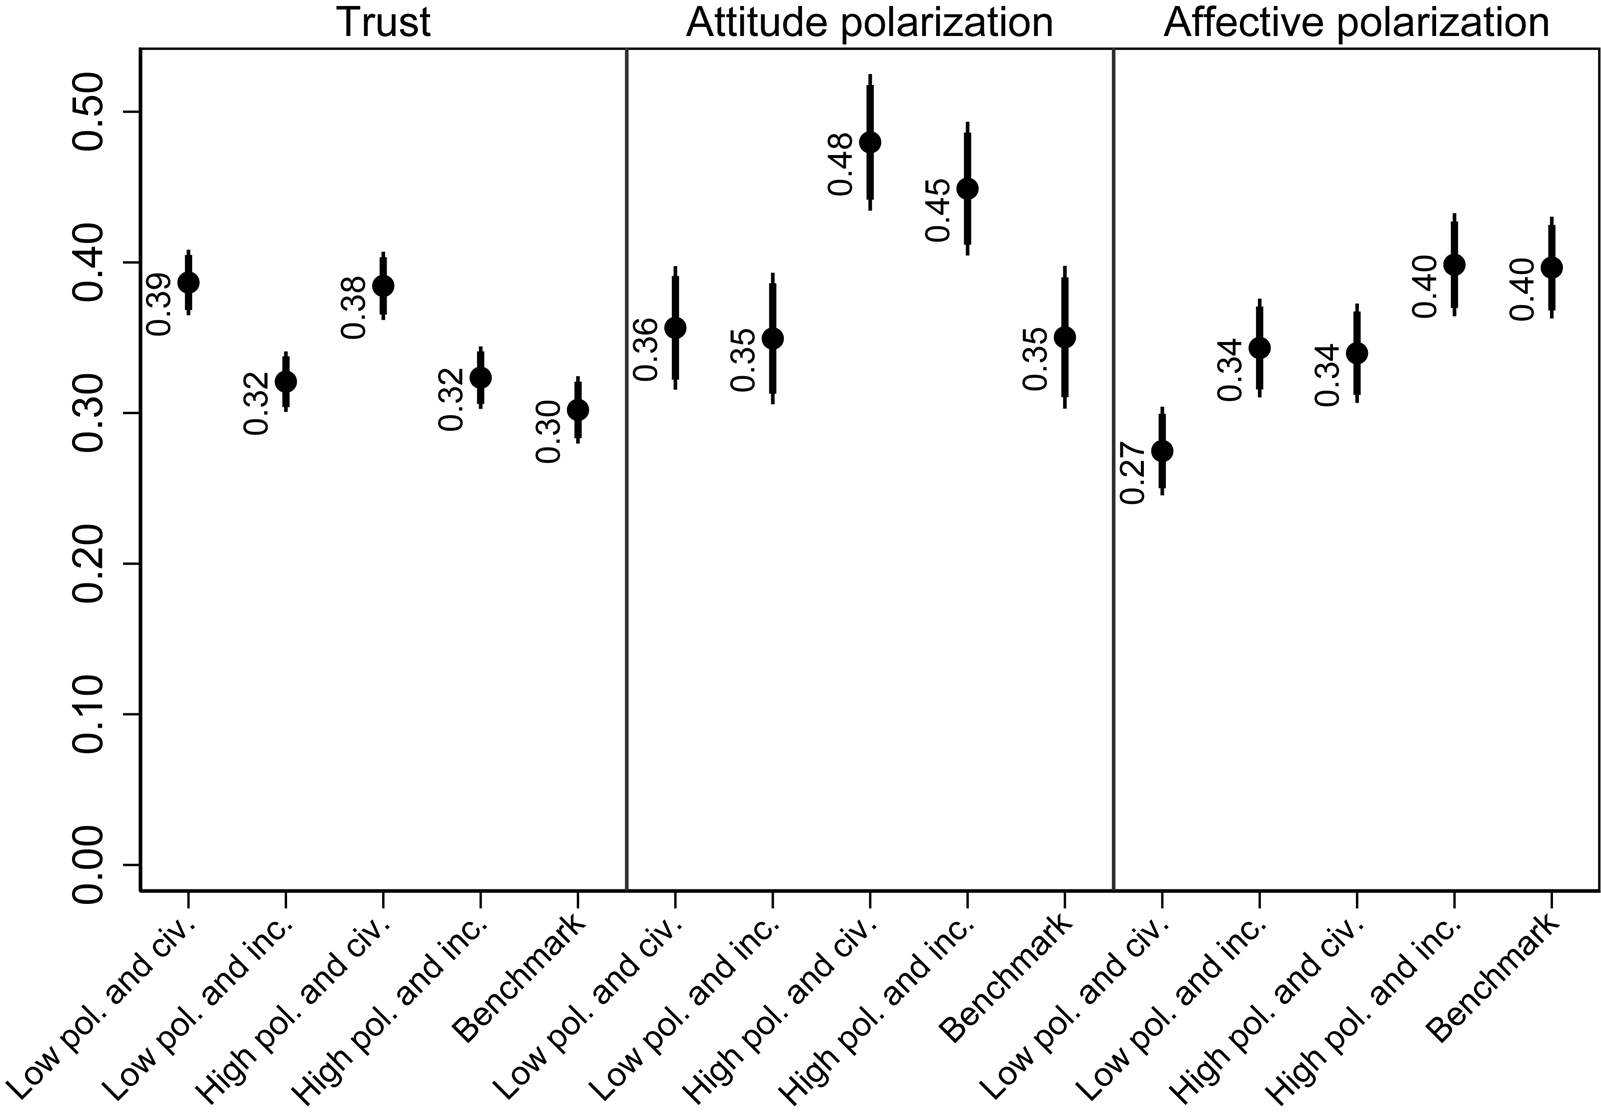
One potential explanation is that participants might be pretreated (see, for example, Slothuus Reference Slothuus2016). Given the current political climate, many have probably been exposed to much uncivil rhetoric outside the experiment, and if they already believe that politicians are uncivil, additional incivility will not move their opinions. As Lamberson and Soroka (Reference Lamberson and Soroka2018) explain, ‘when news has been consistently bad, negative information no longer stands out’. Conversely, civil debate might seem quite uncommon or surprising, which might enable it to move attitudes more easily. Support for this potential explanation can be found in the non-experimental follow-up study. Here, average perceived incivility was no less than 0.72 (scale from 0 to 1), indicating that people do indeed expect politicians to behave uncivilly. In sum, the inability of incivility to move opinions might be a consequence of citizens already perceiving it to be widespread.
Why Distinct Effects?
As described in the theory section, there are reasons to expect both dimensions of conflict to affect all outcomes. Thus, it is surprising that the level of issue polarization did not affect trust in politicians, and that the level of incivility did not affect attitude polarization. Why were Hypotheses 1B and 2A not supported? Before concluding, I discuss possible explanations.
Starting with Hypothesis 1B, one initial possibility to consider is whether issue polarization's lack of effect on trust is due to a mismatch between the vignettes and the measures of trust. That is, trust was measured using questions that did not refer to all members of Congress, but instead to the members ‘who work on this issue’. However, the issue polarization manipulation simply referred to ‘Democrats’ and ‘Republicans’ in Congress, and a skeptic might argue that this lack of specificity discourages participants from using the information when answering the trust questions. In contrast, the incivility manipulation contained quotes from individual politicians, which might make this information seem more relevant when deciding how much to trust the members ‘who work on this issue’. However, while this explanation has intuitive appeal, it does not fit well with the overall pattern of results. In particular, issue polarization was capable of influencing affective polarization, though the items measuring this outcome also referred to those ‘who work on this issue’ (see Appendix A8). Furthermore, the trust measures in the observational study referred simply to ‘politicians in Congress’, but the results were the same. This makes it unlikely that the lacking support for Hypothesis 1B is a methodological artifact.
Rather, the results should perhaps make us reconsider whether citizens see issue polarization as unambiguously negative. The starting point for many scholars is that citizens are generally moderate (for example, King Reference King, Nye, Zelikow and King1997), but recent studies have questioned this assumption, arguing that citizens might be moderate when averaging across issues, but more extreme when looking at each individual issue (Broockman Reference Broockman2016; Treier and Hillygus Reference Treier and Hillygus2009). Accordingly, citizens might value polarization to the extent that it improves representation (see Ahler and Broockman Reference Ahler and Broockman2018). Furthermore, even when the parties move away from their preferred standpoints, citizens might value issue polarization for other reasons, offsetting the negative effect. For instance, citizens might value being presented with an actual political choice. Before the era of polarization, political scientists certainly thought it was important to have clear and divergent platforms (for example, APSA 1950), and Miller (Reference Miller1974, 963–964) even suggested that a lack of perceived party differences might hurt trust in government.
Turning to Hypothesis 2A, the question is why the level of incivility did not affect attitude polarization. One possible explanation is that the level of incivility does not alter people's motivation to follow their party when both sides are behaving equally bad or good, which is what I and many others focus on (for example, Forgette and Morris Reference Forgette and Morris2006; Mutz Reference Mutz2007; Mutz Reference Mutz2015). That is, people might become more loyal when the other party starts to behave uncivilly, since this triggers anger at the opposition (Gervais Reference Gervais2015; Gervais Reference Gervais2019), but when their own party takes part in the mudslinging, it might produce mixed feelings. This explanation would fit with recent work by Druckman et al. (Reference Druckman2018) who find that uncivil media content polarizes attitudes when it comes from an other-party source but depolarizes attitudes when it comes from a same-party source. The main challenge to this hypothesis is that if incivility from one side is canceling out the effect of incivility from the other, it is surprising that is not the case with regards to affective evaluations. However, I still consider it a fruitful avenue for future studies to compare the effects of one- and two-sided incivility.
Concluding Remarks
This article consistently shows that the level of incivility and the level of issue polarization are not just conceptually different dimensions of elite polarization; they also have distinct effects on citizens. This finding has clear implications for future studies. The nature of elite polarization has been debated in recent years. While I am not the first to propose that issue polarization should be distinguished from incivility, the results demonstrate why this distinction should be taken seriously when studying opinion formation. The two aspects of elite polarization have distinct effects because they provide citizens with different types of information; it is therefore important that researchers do not confound them. When designing experiments, this can be achieved by following three recommendations. First, researchers should avoid words and phrases that signal something about the level of conflict along both dimensions when designing treatment material. Secondly, as participants might infer something about the level of conflict on one dimension from the level of conflict on the other, researchers should consider including information about the level of conflict along both dimensions.Footnote 17 Thirdly, and most importantly, researchers should include post-treatment measures to establish that each dimension is manipulated independently of the other. Only then can concerns about confounding be ruled out.
Furthermore, the results also have normative implications. For instance, among the findings that might be regarded as positive, we see that trust in politicians is affected by the tone of the debate, but issue polarization has no effect on this outcome. The fact that citizens can cope with strong political disagreement without losing faith in their elected politicians is good news for those who believe that issue polarization is a valuable good in a democracy, and for those trying to improve the level of civility in public debate, hoping it might reduce political alienation.
However, the results also show that polarization in terms of policy attitudes is created solely by issue polarization, and that both types of elite conflict create affective polarization. Partisan divides among citizens are largely a function of how much the parties substantively disagree, and making debates more civil will do little to bridge them. Having parties with distinct ideological platforms is thus a state of affairs that cannot be attained without a rise in polarization and animosity among partisans, no matter how civil the debate becomes. To the proponents of the responsible party model – who have traditionally argued in favor of presenting citizens with clear political alternatives (for example, APSA 1950) – this might be regarded as bad news. It also shows that ‘disagreeing without being disagreeable’ – a mantra advocated by politicians ranging from Reagan to Obama – is not enough to bridge partisan divides in the electorate. Politics matter, and tensions between ordinary Republicans and Democrats will persist unless the parties agree more on substantive issues.
Supplementary material
The data, replication instructions, and the data's codebook can be found at https://doi.org/10.7910/DVN/YFFNSX and online appendices at: https://doi.org/10.1017/S0007123419000760.
Acknowledgements
The author thanks Martin Bisgaard, Hajo Boomgaarden, Jamie Druckman, Lasse Laustsen, Matt Levendusky, Diana Mutz, Morten Pettersson, Rune Slothuus, Rune Stubager and the anonymous reviewers for their helpful comments. Furthermore, I acknowledge support from the Danish Council for Independent Research through a Sapere Aude grant to Rune Slothuus (DFF-4003-00192B).