Introduction
The reasons why countries establish a welfare state are manifold. Without denying any of the traditional explanations, such as class coalitions and an ageing population (Baldwin Reference Baldwin1990; Lindert Reference Lindert2004), we are interested in the particular impact of inequality. The recent literature views the level of inequality as an important factor in explaining why some countries grew into welfare states while others did not (Espuelas Reference Espuelas2015; Moffitt et al. Reference Moffitt, Ribar and Wilhelm1998; Rothstein and Uslaner Reference Rothstein and Uslaner2005).
To view the level of inequality as an important factor in the rise of the welfare state may seem counterintuitive. The impressive fall in inequality that accompanied the emergence of the welfare state in many Organisation for Economic Co-operation and Development (OECD) countries during the third quarter of the twentieth century led most of us to view the welfare state as an institution designed for redistribution. In a nutshell, the old stance views growing inequality as the mother of redistribution from the rich to the poor, which is what many would perceive as the fundamental principle of the welfare state. The median voter theorem, which posits that a majority of voters will support redistribution if the median voter's income is below the mean, backs this preconceived idea (Alesina and Rodrik Reference Alesina and Rodrick1994; Meltzer and Richard Reference Meltzer and Richard1981; Persson and Tabellini Reference Persson and Tabellini1994).Footnote 1
However, a historical glance at the record of welfare states and their income distribution dispels the notion that the welfare state was pursued for purely egalitarian reasons (Esping-Andersen and Myles Reference Esping-Andersen, Myles, Salverda, Nolan and Smeeding2009). More recent literature argues that there is in fact an opposite cause and effect mechanism between inequality and the rising welfare state (Barth and Moene Reference Barth and Moene2009; Bénabou Reference Bénabou2000; Lindert Reference Lindert2004). A unifying element in this literature is the argument that high levels of inequality hamper redistribution policies, which implies that welfare states emerged only in countries that already had quite low levels of prefiscal inequalities. History reveals a Robin Hood Paradox in which “redistribution from rich to poor is at least present when and where it seems most needed” (Lindert Reference Lindert2004: 15). As Espuelas (Reference Espuelas2015) puts it, unequal countries are locked into an “inequality trap,” with inequality as the main obstacle for redistributive policies.
The corollary of the view that small prefiscal inequalities vary positively with redistribution policies is that countries that would turn into welfare states had always been equal or had witnessed an early narrowing of previously high inequality levels. The overarching aim of this paper is to bring this idea to bear on the emergence of the so-called universal welfare state—in our case Sweden, a typical example of a welfare state that has had, at least since the beginning of the 1970s until very recently, an almost uniquely flat income distribution in comparison with other countries. Our first task is to establish what happened to the evolution of inequality before the end of the 1950s, the time when the design and range of the redistributive policies made Sweden the very model of a generous and universal welfare state (Esping-Andersen Reference Esping-Andersen1990). We review the previous evidence of income distribution (Bentzel Reference Bentzel1952; Gustafsson and Johansson Reference Gustafsson and Johansson2003; Roine and Waldenström Reference Roine and Waldenström2008; Spånt Reference Spånt1975, Reference Spånt, Klevmarken and Lybeck1981) and add new pieces of inequality evidence based on market incomes. Within- and between-sector wage inequalities show a remarkable reduction of inequality from the mid-1930s to the end of the 1940s. Hence, we disprove the assumption that Sweden has always been equal and instead view the development of the 1930s and 1940s as pivotal in reducing the previously high inequality levels (Bergh Reference Bergh2009; Rothstein and Uslaner Reference Rothstein and Uslaner2005). Besides examining the Swedish case, we also briefly review how inequality developed in Norway, Finland, and Denmark—three additional examples of universal welfare states. Additionally, Espuelas (Reference Espuelas2015) shows that Latin America can work as a counter case, where a very high level of inequality hampered the establishment of a welfare state.
The timing of the Swedish inequality decline to which this paper testifies bears some resemblance to Piketty's (Reference Piketty2014) evidence on wealth and top income shares across a sample of today's rich countries, which shows that inequality was high well until the end of the 1920s and declined in the 1930s and 1940s. However, in contrast to his focus on wealth and top income shares, we place more emphasis on the evolution of the wage structure, which steers the searchlight of our investigation toward changes in labor market institutions and collective actions instead of the general laws of capitalism that Piketty posits (Acemoglu and Robinson Reference Acemoglu2015; Donado and Wälde Reference Donado and Wälde2012; Swenson Reference Swenson2002). Arguably, the inequality decline in market incomes for vast swathes of the labor force had important implications for the emergence of universal and income-related social policies in the 1950s; the development of workers’ relative remunerations affected their willingness to either espouse or militate against the principles underpinning the welfare state.
If high levels of inequality really hampered the establishment of the welfare state, as the evidence leads us to believe, our second task is to uncover what mechanism could possibly have linked equality and the welfare state together. What mechanism allows equal countries to pursue policies aiming at redistribution, or, what mechanism prevents unequal countries to do the same? We suggest that trust is what makes inequality an impediment to the implementation of universal social policies aiming at redistribution. The level of trust a society musters correlates inversely with the level of inequality. Social scientists argue that trust is of special importance for the emergence of the Scandinavian model because of its underlying principles of welfare distribution.Footnote 2 Welfare states that combine generous yet universal benefits run an increasing risk of free-riding and of eroding tax morals. The solution to this collective action dilemma is trust, which bolsters efficient institutions and slashes the costs of free-riding and misuse of public goods. Taxpayers bear the burden of high taxes only if they are convinced that other taxpayers make the same commitment. The literature calls a social trap a situation in which—owing to a lack of trust—individuals act independently, although joint benefits through cooperation would exceed individual benefits. Public policies, as an example of collective effort, do not gain support because trust is lacking (Espuelas Reference Espuelas2015; Rothstein Reference Rothstein2005; Rothstein and Uslaner Reference Rothstein and Uslaner2005). Only if high inequality were reduced first would trust levels grow.
The paper shows that equality indeed predated the universal welfare state. We suggest that increasing trust as a consequence of decreasing inequality—and, in addition, institutional formations and political coalitions—was, among other factors, the key to unlocking the social trap that eventually made the Scandinavian welfare state possible. The paper endorses a dynamic view of trust in the sense that trust arises endogenously as a concomitant to changes in the underlying fundamentals like income inequality and redesigned institutional frameworks.
The Swedish Welfare State
We need to establish the definition of the welfare state on a tangible and pertinent characteristic. Our brief review therefore focuses on the road toward the establishment of the redistributive policies known as income-related benefits that would form the backbone of the social-democratic welfare state (Esping-Andersen Reference Esping-Andersen1990). In Sweden, that road begins around the turn of the nineteenth century and ends in the late 1950s.
Although still predominately rural, Sweden stood on the threshold of massive industrialization and urbanization in the 1890s, when the government introduced public support for the various voluntary sickness funds run by labor unions.Footnote 3 In times of sickness and old age, urban workers lacked the kind of support that farms and families had provided in rural settings. Modernization called for a social security system sufficiently flexible and sustainable to cater to the needs of mobile wage earners.
A reformed version of sickness insurance came about in 1910. This early model of health insurance was far from universal; it was voluntary, small in size, and income related. The path toward a universal solution proved long and complicated. In 1937, the Social Democratic minister Gustav Möller appointed a committee (Socialvårds-kommitén) with the aim of designing universal and compulsory health insurance. Möller espoused the principle of universalism: everybody's right to benefit, regardless of class, occupation, or gender. He refused the idea of earnings-related benefits. The final design of the health insurance came about in 1955, when the Social Democrats, in alliance with the Peasant Party, launched a model that made benefits universal (flat-rate benefits) and earnings related. The system comprised wage earners and excluded the self-employed.
A universal, flat-rate pension system appeared in 1948. The benefits were modest but still sufficient to liberate many of the retired from being dependent on the poor-relief system. The new pension system had outstanding redistribution effects because it significantly raised the income levels of the neediest in society. The supplementary income-related pensions on top of the flat-rate universal scheme appeared in 1958, based on the earnings of the 15 top-earning years. Pension benefits now mirrored white-collar workers’ higher earnings, which made the workers less dependent on supplementary pension schemes provided by their employers.
From the very beginning (1892), labor unions handled unemployment insurance. Instead of endorsing universal, compulsory unemployment insurance—a solution preferred in many other countries—Sweden adhered to the so-called Ghent system, which required membership in an unemployment insurance fund for eligibility. Public support for unemployment funding was low until the 1940s because of disagreement on stipulated terms between labor unions and the government. As the labor unions gathered political influence in the 1930s and 1940s, the government granted them conditions that would meet their requirements. Despite the high rate of unionization in Sweden a great share of workers remained, and still remain, outside the insurance system; to the present day, Sweden has no universal unemployment insurance.
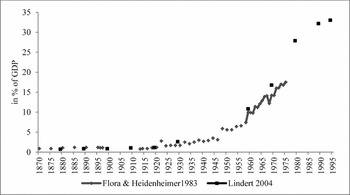
Even though the Swedish journey toward a welfare state began early in the twentieth century, the mature version of it did not emerge until the late 1950s. Therefore, noteworthy increases in social transfers did not take place until the early post–World War II era. Figure 1 shows the share of social transfers relative to gross domestic product (GDP) as a quantitative approximation of the Swedish welfare programs. It remains below 3 percent until 1930, increases slowly in the 1930s and 1940s, and jumps to 10 percent in the late 1950s. From 1960 to 1990, the spending share surges from 10 to 30 percent. The conspicuously large share of GDP that the welfare state swallows has given the so-called Swedish model a great deal of attention (Lindert Reference Lindert2004: ch. 11).
Social transfers percentages of GDP, 1870–1990. Sources: Lindert (Reference Lindert2004: 13); Flora et al. (Reference Flora1983: 429).

In sum, the intellectual origin of the Swedish welfare state springs from discussions in the 1930s and 1940s (Lundberg and Åmark Reference Lundberg and Åmark2001: 160–64). The actual implementation occurred in three phases: the first with the introduction of universal flat-rate benefits in the early 1950s, the second with the extension of earnings-related benefits at the end of the 1950s, and the third with the expansion of the public sector in the 1960s and the 1970s (Olsson Reference Olsson1990). From the end of the 1950s, the principles of income security and universality form the backbone of the Swedish welfare state. Although policy discussions started much earlier, beginning in the late 1950s the substance of the Swedish welfare state conformed to Esping-Andersen's (Reference Esping-Andersen1990) archetype of the universal model.
Besides what our brief review has listed so far, there is a whole package of social policies such as universal health care, universal education, or laws that regulate the labor market (such as workers’ right to unionize or the eight-hour working day) that distinguishes the rise of the welfare state in Sweden. Strong incentives for female labor force participation and a redistributive tax policy are additional features that accompanied the rise in social spending. These policies evolved gradually and most likely exerted an impact on the evolution of inequality. The focus on the actual introduction of the earnings-related benefits, however, makes our search for changes in the level of inequality more focused. The next section therefore seeks to establish what happened to the evolution of inequality in the first half of the twentieth century.
The Evolution of Inequality
Previous Research
Researchers know quite well about the distribution of disposable household income in recent times owing to the existence of comparable data, for instance, as gathered in the Luxemburg Income Study. Previous research on inequality for the period of interest here, namely the first half of the twentieth century, consists of scattered pieces of evidence that nevertheless point to an early equality revolution.
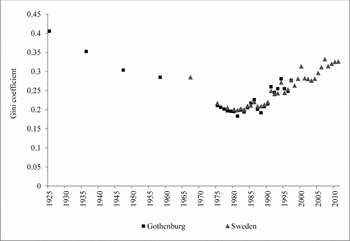
Our first long-run indicator of inequality is Gustafsson and Johansson's (Reference Gustafsson and Johansson2003) study of Gothenburg, in which they draw on preserved tax records for 1925, 1936, 1947, and 1958. It points to important changes in Gini coefficients, representing equivalent disposable incomes. In 1925, the Gini was 0.41 and in 1958 it was 0.28, hence a remarkable decline in the spread of household incomes. This study is limited to the city of Gothenburg and may therefore miss countrywide patterns. That is why figure 2 contrasts Gustafsson and Johansson's Gothenburg Gini coefficients from 1925 to 2010 with national ones from 1967 to 2010. To translate the size of the Gothenburg Gini in 1925 to something more tangible, we may contrast it with today's standard across OECD countries. In the mid-2000s, only Turkey and Mexico had Ginis above 0.4. Most people would probably conceive of these two countries as unequal. Sweden and Denmark were the only countries with Ginis below 0.25 (OECD 2008: 25). To contrast today's coefficients with evidence of early-twentieth-century Ginis is fraught with difficulties because there are only fragmentary pieces of evidence at our disposal (Milanovic et al. Reference Milanovic, Lindert and Williamson2011: table 2).
Gini coefficients of Gothenburg and Sweden, disposable household incomes, 1925–2011. Sources: Gothenburg, 1925–58: Gustafsson and Johansson (Reference Gustafsson and Johansson2003: 198, table 3); Gothenburg and Malmö, 1975–97: the data underlying figure 1 in Gustafsson and Johansson (Reference Gustafsson and Johansson2003) provided by the authors; Sweden, 1975–2011: http://www.scb.se/Pages/TableAndChart____163550.aspx.

In the Gothenburg study, Gustafsson and Johansson (Reference Gustafsson and Johansson2003) also differentiate the change in the Gini coefficient by income source in 1925–58. They conclude that changes in capital incomes and taxes explain most of the fall in inequality. What stands out from their investigation is that the relative income growth of the top deciles was brought to a halt. Real capital incomes decreased and the share of gross incomes taxed away increased, both by a factor of three. In addition, the growth of earnings was slower for the top deciles than for the average.
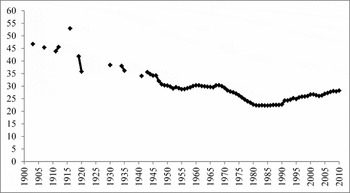
The local study of Gothenburg anticipates what our second source of long-term inequality evidence—top income shares—manifests, namely, that a marked reduction of top income earners’ share took place before the 1950s (Roine and Waldenström Reference Roine and Waldenström2008, Reference Roine, Atkinson and Piketty2010). The top income shares are based on tax returns going back to the early days of the modern Swedish tax system in 1892. The tax returns enable the authors to construct an unbroken series of top income shares up to the present day. The series yields long-term characteristics of certain aspects of income distribution but fails to provide information on the distribution patterns for layers other than top income earners (Autor Reference Autor2014; Lindert Reference Lindert2014; Milanovic Reference Milanovic2011: 26ff). What matters for our investigation is that a major inequality drop occurs before the 1950s (figure 3). From the turn of the century until 1920, the share of top incomes goes down from about 45 percent to about 35 percent. The interwar years do not indicate further dramatic changes, while a precipitous fall brings the level down to 30 percent in the aftermath of World War II. Roine and Waldenström (Reference Roine and Waldenström2008, Reference Roine, Atkinson and Piketty2010) differentiate the overall drop in the top share into wages, capital incomes, and business incomes. Declines in top income earners’ share of capital incomes play the most important role in the overall contraction in 1912–35, while slower growth rates of wages and smaller capital incomes explain by equal measure the contraction in 1935–51, whereas declining business incomes in the 1970s bring down the overall share to an all-time low at the end of the period 1950–80. The importance of wages in the overall drop of the top share from 1935 to 1951 indicates that wage earners other than those in the top 10 percent of income distribution were catching up, which prompts an examination of labor market outcomes at large.
Top 10 percent (P90-100) income shares, 1903–2010.Source: Roine and Waldenström (Reference Roine, Atkinson and Piketty2010: 307).

Bentzel's (Reference Bentzel1952) and Spånt's (Reference Spånt1975, Reference Spånt, Klevmarken and Lybeck1981) investigations of the early income distribution in 1930–76 constitute our third category of inequality evidence. Spånt (Reference Spånt1975) traces the development of individual market incomes before taxes and transfers from 1951 to 1976. He finds evidence that inequality decreases slowly, owing to equalization of women's incomes, at the same time as men's income patterns remain unchanged.Footnote 4 In a pioneering study of Swedish income distribution, Bentzel (Reference Bentzel1952) reveals two important characteristics of the 1930s and the 1940s by utilizing primary (tax assessed) income. First, the distribution of incomes across sectors (broadly defined) is quite stable. For instance, no noteworthy change occurs in the functional distribution of incomes.Footnote 5 Second, the spread of market and disposable incomes declines. He uses the maximum equalization percentage, which indicates the percentage of total income that has to be taken from those above average income to bring about a complete equalization of incomes.Footnote 6 For household primary incomes, the percentage goes from 41 in 1935 to 34 in 1948, and for household disposable incomes, from 37 in 1935 to 28 in 1948. Bentzel (Reference Bentzel1952) explains the compression of household disposable incomes patterns inter alia by changes in the tax system. Spånt (Reference Spånt, Klevmarken and Lybeck1981) confirms Bentzel's conclusion that the income distribution narrows between 1935 and 1951. Drawing on tax-assessed incomes for males, he computes the maximum equalization percentage, which declines from 39 to 25. Hence, the compression of the income distribution owes to an equalization of labor market outcomes.
New Evidence on Inequality by Labor Market Outcomes
To add to the picture painted by our review of previous inequality evidence, we tap into the great supply of official wage statistics from as far back as the 1920s to build up inequality measures of labor market outcomes. Wages classified by sectors, industries, and labor categories give insights into income patterns for the great majority of people who would either support or militate against the underlying principles of the welfare state. The universal design of the redistributive policies has in addition the greatest impact on wage earners because they pay the taxes needed for economic redistribution, they suffer from losses owing to free-riding behavior and other inefficiencies, and they are susceptible to changes in their employment status because benefits are income related. This provides the justification for our focus on labor's distribution of earnings instead of the distribution of wealth whose underlying components and rate of change at large bear little weight in most workers’ portfolios.
The official wage statistics for manufacturing workers came into being in 1913, although our series begins in 1921 when the Social Board enlarged the sample of industries (Prado Reference Prado, Edvinsson, Jacobsson and Waldenström2010). The Social Board collected data by requesting firms to provide information on wages and other closely related issues in surveys. It extracted from a single firm the total sum paid out as wages during one year and divided this sum by the number of working hours, days, or workers (the average number of workers on a number of paydays, e.g., once a week). The coefficients of variation for industrial workers that are based on male average hourly earnings incorporate the effects of reductions in working hours.Footnote 7 We also use the official wage statistics of agricultural workers. Between 1865 and 1945 they were published in the official statistics of agriculture and record wages of day workers, farm servants, and contract workers by county. In 1938 the wage statistics of agricultural workers entered Statistics Sweden's official wage statistics. They contain detailed classifications of workers’ professional characteristics, but lack the geographical dimension.
Our first within-sector inequality measure is the annual coefficient of variation across the entire sample of manufacturing industries, calculated as
 $CV = \frac{\sigma }{\mu }$
, with σ as the standard deviation and µ as the mean. A distinguished feature of nearly all kinds of official statistics is intertemporal heterogeneity. In our case, it implies that the number of industries ranges from 42 to 67 between 1921 and 1967. There are two ways in which the investigator may handle the problem of intertemporal heterogeneity. First, the investigator may allocate each industry to groups of industries (9–10 branches) and compute the coefficient of variation across these branches. This was the approach in previous studies of the evolution of the wage structure within the manufacturing industry (Lundh Reference Lundh2002: 203; Prado Reference Prado, Edvinsson, Jacobsson and Waldenström2010). Second, to recognize, as we do, that the aggregation of industries into branches distorts a measure that purports to track the spread of wages over time. Aggregation may make part of the variance slip away because it remains concealed in the groups of industries, the constituent components of the aggregate measure. The true magnitude of interindustry variation over time is what we are keen to assess. Therefore, we solve the problem of intertemporal inconsistency by computing the coefficient of variation for those industries that appear in the official statistics during at least two consecutive years. This gives us several overlapping subperiods. We then splice each subperiod without paying attention to the actual level of the coefficient of variation, which gives us an index series that tracks the movement of variation over time (cf. Bowley Reference Bowley1895; Feinstein Reference Feinstein1990). In the final step, we establish the actual level of the coefficient of variation for a benchmark year (1967) in which we have access to a large sample of industries (67), and use the spliced index series to demonstrate the movement of variation over the entire era.
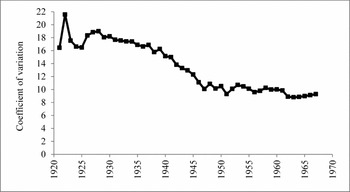
The result of our efforts appears in figure 4, which plots the annual coefficient of variation from 1921 to 1967. The interindustry wage differentials start declining in the beginning of the 1930s. The decline accelerates as the 1930s come to an end. In the 1940s the coefficient of variation completely collapses. It falls from 16 to 10 between 1939 and 1947. Its additional contraction until 1967 is modest. The magnitude of this equalization of wage differentials across industries is dramatic and has major implications for our interpretation of the wage structure. The significance of this observation depends on the relative size of the manufacturing industry in the 1940s. Sectoral shares of employment show that the manufacturing industry surpasses agriculture as the largest sector in terms of employment in the 1940s. Therefore, our evidence of interindustry wage differentials in the mid-twentieth century carries significant weight.
Interindustry wage differentials (CoV), 1921–67.Sources: Socialstyrelsen Sociala meddelanden (1921–28); Socialstyrelsen SOS Lönestatistisk årsbok (1929–51); Statistiska centralbyrån SOS Löner (1952–67).

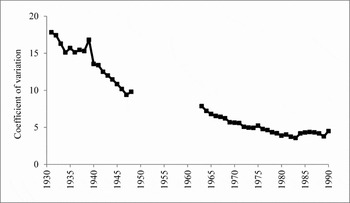
Interregional wage differentials, another measure of within-sector inequality, present a similar story. In 1931, the Social Board began reporting average wage levels of manufacturing workers by county. The spatial dimension of manufacturing wages disappeared from the Social Board's publication in 1948, but reappeared in 1963. Figure 5 displays the evolution of the coefficient of variation across the 25 counties.Footnote 8 It bears a striking resemblance to figure 4 showing interindustry wage differentials. The series of interregional wage differentials starts to decline at the end of the 1930s. Between the years 1938 and 1948, the coefficient of variation diminishes from 15 to 10. In addition, it continues on its downward trajectory in the 1950s and 1970s and remains at a level of about 4 percent in the 1980s.Footnote 9
Nominal intercounty wage differentials (CoV) of manufacturing workers, 1931–90.Sources: Socialstyrelsen SOS Lönestatistisk årsbok (1931–1948); Statistiska centralbyrån SOS Löner (1963–1990).

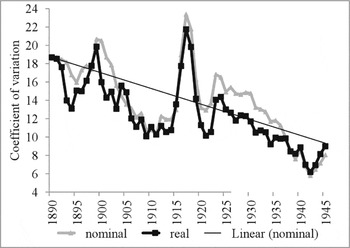
Regional wage-differentials for day workers in agriculture, another intersector inequality measure, show a similar tendency of decline in the first half of the twentieth century (figure 6). We cannot tell whether the downward trajectory extended into the post–World War II era because the information on agricultural wages by county ceases to exist in 1945. What our data allow us to confirm is a slight tendency toward smaller interregional wage differentials among day workers’ wages. This manifests itself during two episodes, the first in the late nineteenth and early twentieth century, and the second from about 1930 to 1940, whether or not nominal wages are deflated by regional-specific cost-of-living indices.Footnote 10
Coefficient of variation in nominal and real wages in 24 Swedish counties, 1860–1940.Note: For sources and construction, see appendix table A.1 and section 4 in Enflo et al. (Reference Enflo, Lundh and Prado2014).

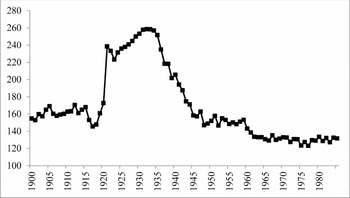
Our final inequality measure pertains to the evolution of the urban/rural wage ratios in the period 1900–85, our measure of between-sector inequalities.Footnote 11 Hourly wages for unskilled workers in the engineering industry are divided by rural day workers’ wages to yield a comparison between two groups of workers whose skill requirements are similar.Footnote 12 In addition, the series of day workers’ wages is adjusted for reductions in working hours. Figure 7 indicates that an era of equally favorable conditions for agriculture and the engineering industry in the decade preceding the outbreak of World War I was followed by remarkable shifts of fortunes, favoring first industrial and then agricultural workers. A noteworthy sequence of events begins in 1915, first when the ratio drops, and then when it soars to an unprecedented order of magnitude. In 1921, industrial workers earned 138 percent more than agricultural workers. After 1933, the ratio begins to decline slowly until 1940, when it completely collapses during World War II. During the war, agricultural workers recaptured what they had lost since the beginning of World War I. In comparison to the estimated wage gap in 1915 of 55 percent, the size of the wage gap comes full circle by the end of the era; in 1950 it stands at 52 percent. The ratio then largely remains static until 1985.
The urban/rural wage ratio in Sweden, 1900–85.Note: For sources and construction, see appendix in Lundh and Prado (Reference Lundh and Prado2015). One hundred corresponds to equal wages between agricultural day workers and the engineering industry.

Inequality in the Remote Past
The evidence of inequality that we have brought to the fore corroborates the view that Swedish equality was established quite late and calls into question the literature suggesting that either Sweden has always been equal or that its transition to equality took place in the very remote past (Bergh Reference Bergh2009: 35ff; Rothstein and Uslaner Reference Rothstein and Uslaner2005). That Sweden earned a reputation for being particularly equal stems above all from two recent episodes of marked compression of the income distribution, the first of which occurs between 1935 and 1950, and the second toward the end of the 1960s and the 1970s. In the 1980s, inequality levels reached an all-time low with a Gini coefficient of 0.2 (Björklund and Jäntti Reference Björklund and Jäntti2011).
Rothstein and Uslaner (Reference Rothstein and Uslaner2005) argue that equality has deep roots in Swedish society. They dredge up the old argument that Swedish equality can be traced to agrarian institutions, as the doyen of Swedish economic history Eli F. Heckscher (Reference Heckscher1954: ch. 2) once remarked that Swedish and Norwegian peasants were not kept shackled by the forces of feudalism that permeated most of continental Europe. Swedish peasants had their own standing in the parliament until 1867 and were legally independent. The egalitarian structure of the Swedish agricultural sector left an indelible mark on the future design of welfare institutions, they conclude. While there are no reasons to dispute the evidence that some agricultural institutions in Sweden evolved differently, recent phenomena speak directly to the issues of social structures and inequality. We would like to point out four features that challenge the idea that Sweden was particularly equal even in the late nineteenth century.
The first feature follows up on the argument that egalitarian institutions in agriculture formed the basis for Swedish equality in the twentieth century. In the course of the nineteenth century, the increase in population led to the rapid growth of the landless and semilandless groups. Large-scale land clearance provided employment for these groups until the last quarter of the nineteenth century, and the emergence of labor-intensive industrialization henceforth absorbed a significant portion. They made up a growing class of low-paid proletarians who, by their sheer number, probably made the lower tail of the income distribution wider. A smaller share of the landless would in addition end up as contract workers (statare) on large estates (Gadd Reference Gadd, Myrdal and Morell2011: 140–43; Söderberg Reference Söderberg1987, Reference Söderberg, Brenner, Kaelble and Thomas1991). Swedish emigration rates were among the highest in Europe in the late nineteenth century as a reaction to a high United States to Sweden real wage ratio and a pattern of inversely related long swings in the Atlantic economy (Eurenius and Bohlin Reference Eurenius and Bohlin2010). Admittedly, the mass emigration may have solved some of the pauperization problem that plagued the countryside, as the Swedish economist Knut Wicksell argued.
The second feature is a corollary of the first and concerns the distribution of land holding in agriculture. In an investigation into the distribution of wealth as reflected in land holding across communities in two Asian and three European countries in the late eighteenth and early nineteenth century, Scania (a county in southern Sweden) stands out for being particularly unequal. About half of the families in Scania did not own land, and the richest 5 percent owned 36 percent of all land (Bengtsson et al. Reference Bengtsson, Campbell and Lee2004: 87–90). Furthermore, Frankema (Reference Frankema2009: 213–17) calculates Gini indices for land inequality. If we list the Ginis of all countries in ascending order, Sweden ranks as number 18 of 44 in 1919. With a Gini of 57.3, the Swedish distribution of land holding was quite close to the average of 61, but far from being especially equal.
The third feature attests the concentration of ownership in Swedish industry, which by international standards is skewed. The large concentration of ownership, in particular among manufacturing industries with an inclination toward exports, emerged when industrialization gained pace at the end of the nineteenth century (Glete Reference Glete1987, Reference Glete1994; Stevenson Reference Stevenson1974).
The fourth feature reminds us that there is nothing exceptional about Sweden as a provider of equal political, social, and economic rights in the late nineteenth and early twentieth century. By contrast, Sweden was not a forerunner of the introduction of universal suffrage (last among the Nordic countries), and Sweden lagged behind in the provision of higher education (Lindert Reference Lindert2004: ch. 5). While mass (secondary) schooling, for instance, came about in early-twentieth-century America (Goldin Reference Goldin1999), its adoption in Sweden did not occur until the interwar years.
Inequality beyond the Swedish Setting
Sweden is not the only country whose welfare state design fits into Esping-Andersen's (Reference Esping-Andersen1990) definition of social democratic. Therefore, we broaden our view by offering a brief examination of Norway and Denmark, two other clear-cut cases of social-democratic welfare state designs, and Finland, a latecomer that completes the Scandinavian mirror.Footnote 13 Can we identify a similar equality revolution before the establishment of the welfare state in these countries?
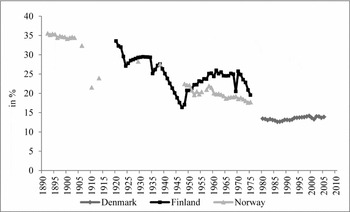
We make use of the World Top Income Database, which provides income shares of different income groups in a sample of countries. Regrettably, the Norwegian data contain gaps in our study period, and the Danish data do not begin until 1970. We fill these gaps with complementary information. Figure 8 shows the development of income shares held by the upper 5 percent. We use this indicator of upper income shares to get a sense of the inequality developments. The very first impression is that inequality diminishes in all four countries prior to World War II. Each country shows some particularities as briefly summarized in the following text.
Top 5 percent (P95–100) income shares in Denmark, Finland, and Norway, 1892–2005.Source: Alvaredo et al. Reference Alvaredo, Atkinson, Piketty and Saez 2015 .

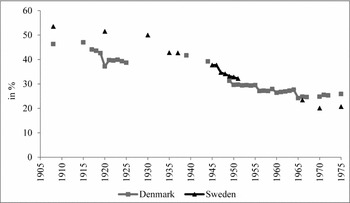
After World War I, Finland has an inequality level close to the Swedish. The interwar years bring a significant drop in inequality until 1949. Jäntti et al. (Reference Jäntti, Riihelä, Sullström, Tuomala and Atkinson2010) use tax statistics as well as the few available Gini coefficients to reinforce the impression that a reduction of inequality occurs before the 1950s. Flora (Reference Flora1988) attributes the decrease in inequality to the solidarity wage policy and the government's control of wages and prices. Compared to the other countries, the inequality decline in Finland appears sharp. The Norwegian case shows a trend similar to that of the other Scandinavian countries, even though some gaps split the series. At the beginning of the twentieth century, the share held by the upper 5 percent was much higher than after World War II. A reduction of inequality took place before the Norwegian government launched the most important social reforms (ibid.: 121–23). For Denmark, we rely on evidence of the top 1 percent wealth shares. The distribution of wealth shares in Denmark accords very well with the Swedish (figure 9). Furthermore, previous research strengthens the impression of falling Danish inequality before the 1950s (Ohlsson et al. Reference Ohlsson, Roine, Waldenström and Davies2008).
Top 1 percent (P99–100) wealth shares in Denmark and Sweden, 1908–75.Source: Ohlsson et al. (Reference Ohlsson, Roine, Waldenström and Davies2008: table 1).

In general, all countries demonstrate an overall decline in the top income and wealth shares. At the same time as the top earners lost income shares, the main winner was the middle class. It could increase its income shares especially between 1930 and 1950. The bottom 60 percent also improved or at least maintained their shares at the expense of the top 10 percent. The outcome was a marked compression of income patterns, which is particularly visible in Sweden and Denmark (Kraus Reference Kraus, Flora and Heidenheimer1981: 195ff).
In a broader perspective, the drop in the inequality level was outstanding in the Scandinavian countries. Although the factors responsible for the fall in inequality may differ among the four countries in our sample, economic egalitarianism predated the enactment of those principles that underpin the Scandinavian welfare state model.
We should notice that the Swedish decline in inequality measured by top income earners share of total income follows a pattern similar to those of other developed countries. The top decile goes down in Anglo-Saxon countries, Continental Europe, and Japan particularly during the 1940s. If we focus on the top percentile, the inequality decline until 1950 was somewhat steeper in Sweden, France, and Japan. Most of these rich countries would in one form or another develop welfare states. The inequality decline of the top decile share in the emerging countries came about decades later (Piketty Reference Piketty2014: ch. 9).
Additionally to the Scandinavian evidence, which indicates that income patterns leveled before the welfare state appeared, unequal Latin America may serve as counterexample. The top 0.1 percent income share in Argentina in 1932 was 7.52 in comparison to 4.82 in Sweden and 4.35 in Norway. The corresponding share of social spending in relation to GDP was zero in Argentina and about 3 percent in Scandinavia (Espuelas Reference Espuelas2015). Subsequently, high inequality in Latin American countries persisted and in some cases even increased to exorbitant magnitudes (Alvaredo et al. Reference Alvaredo, Atkinson, Piketty and Saez2015), and the redistributive welfare state, not surprisingly perhaps, has not seen the light of day.Footnote 14 This inverse correlation between the two variables does not establish causality; however, to explain why inequality hampers redistributive policies, we need a further factor that links these two indicators together.
Unlocking the Social Trap
As Espuelas (Reference Espuelas2015) shows, unequal countries are less likely to set up a welfare state because inequality is a feature that undermines espousal of redistribution policies. In particular, the rise of the Scandinavian welfare state, relying as it does on generous benefit levels and encompassing characteristics, takes as a necessary requisite an egalitarian structure of society. To justify why a reduction in inequality is important for the rise of the welfare state, we introduce the factor of trust.
Zaheer et al. (Reference Zaheer, McEvily and Perrone1998: 142) define trust as an expectation of a partner's reliability with regard to his or her obligations. In a welfare state context, this definition implies, for instance, that taxpayers obey tax regulations and recipients claim benefits according to entitlements. The tax burden in the Scandinavian countries weighs heavily compared to countries with the liberal or conservative models. To collect the required taxes, it takes either a very efficient, even draconian, state apparatus or citizens that on voluntary grounds pay taxes in compliance with regulations (Rothstein Reference Rothstein2009). The voluntary trustworthiness may consist of moral obligations and, which matters for the present context, the belief that other people also obey the rules by paying their stipulated share of taxes (Jensen and Svendsen Reference Jensen and Svendsen2011). In a social-democratic welfare state, everyone, though in particular the middle class and the wealthy, must accept that taxed incomes and wealth are channeled to public investments or spent by the lower classes (Bjørnskov and Svendsen Reference Bjørnskov and Svendsen2012). With high trust levels, a society achieves this acceptance through the conviction among its citizens that contributions are collected, and benefits are redistributed, in a fair manner.
Recent research shows that trusting populations are willing to vote for extensive welfare spending notwithstanding the risk of free-riding behavior (Jensen and Svendsen Reference Jensen and Svendsen2011; Nannestad Reference Nannestad2008). It also shows that the Nordic countries have had relatively low levels of corruption, which might have increased trust in and willingness to economic redistribution through welfare state policies (Frisk Jensen Reference Frisk Jensen2013). We may exemplify the risk of free-riding as decision making based on available information. Some benefits depend on whether people live together or if they have supplementary incomes besides public transfers. This kind of information is asymmetric, shut off from the bureaucrats’ view, which tempts recipients to overuse public resources. Trust provides a moral constraint on selfish behavior and solves the free-rider problems that otherwise would undermine the universal welfare state (Bjørnskov and Svendsen Reference Bjørnskov and Svendsen2012). Hence, trust solves the social dilemma that otherwise would have involved severe efficiency losses (Nannestad Reference Nannestad2008: 428). Barth et al. (Reference Barth, Moene and Willumsen2014) argue furthermore that political support for the Scandinavian welfare state depends on small income differences across workers. Broadening the definition of the welfare state beyond economic redistribution, they suggest that social insurances, health care, and education are normal goods that consequentially gain stronger support as average income increases and income inequality decreases.
While arguing that equality and hence high trust levels are necessary, if not sufficient, preconditions for the economic redistribution within the universal welfare state, we do not disagree with the idea that the welfare state spurs trust. Instead, the relation between trust and the welfare is endogenous; causation runs both ways, which silhouettes the universal welfare state against the conservative and liberal models. The universal welfare state creates trust through various channels (Rothstein Reference Rothstein2009). First, in the universal system everyone pays and everyone receives. This encompassing characteristic explains why the universal welfare state gives rise to cross-class fraternity and fosters high levels of trust. Second, because means-tested programs play a minor role in the universal welfare state, the risk of being subjected to discretionary, bureaucratic treatment diminishes. In addition, there is no shame in drawing on public resources because it is common in society. It implies that there is no stigma attached to needy welfare recipients.
Contribution-based benefits on which the conservative model rests do not serve to diminish class differences. Its principle that primary welfare responsibilities lie within the family stimulates within group solidarity (Goodin et al. Reference Goodin, Headey, Muffels and Dirven1999: 51–55). That is why it is highly dependent on particularistic trust, like trust within the family. To explain the impact of trust on the conservative welfare state, we may distinguish between general and particularistic trust. Countries with conservative welfare state models display much lower levels of general trust than Scandinavian countries (Jensen and Svendsen Reference Jensen and Svendsen2011).
Because the liberal model targets only the poor, most people look with suspicion at the welfare state that requires from them a significant proportion of their income and wealth. In addition, entitlement rules are strict and social rights modest. Poor people who claim their rights to benefit run the risk of being stigmatized, which widens the gap between them and the middle to upper classes. The poor rely on the state while the rich rely on the market, which entails a dual class structure. What follows is a lack of social cohesion that breeds mistrust (Kumlin and Rothstein Reference Kumlin and Rothstein2005). Hence, the liberal model does not require a compressed income pattern and does not presuppose high levels of trust.
Trust, Inequality, and Institutional Changes
Measuring Trust
Recent research uses several different trust measures, such as surveys (Beugelsdijk and van Schaik Reference Beugelsdijk and van Schaik2005; Bjørnskov and Svendsen Reference Bjørnskov and Svendsen2012), experiments (Naef and Schupp Reference Naef and Schupp2009), and anthropological observations (Nannestad Reference Nannestad2008).Footnote 15 Historical studies that cannot draw on surveys or use experiments may use instrumental variables, such as the average density of voluntary organizations (Bjørnskov Reference Bjørnskov2006; Putnam Reference Putnam2000), or exemplify institutional changes associated with trust, such as education (Delhey and Newton Reference Delhey and Newton2005; Leigh Reference Leigh2006). As Putnam (Reference Putnam2000) has shown, education has a great positive effect on social trust in the United States and some other Western countries. Education not only increased in Sweden across the interwar years (Ljungberg and Nilsson Reference Ljungberg and Nilsson2009), but it also increased in countries other than those that developed comprehensive welfare states. Lee (Reference Lee2013) mentions ethnic homogeneity and the share of Protestants (see also Nannestad Reference Nannestad2008) as possible proxies, extended by linguistics and climate variables suggested by Bergh and Bjørnskov (Reference Bergh and Bjørnskov2011). While in Sweden the share of Protestants is high and ethnic fractionalization is low,Footnote 16 these variables fail to explain any change in trust levels.
The fact that trust levels established by surveys since the 1980s appear static over time for most countries has made some inclined to consider high trust a resource endowment. By inference, if we identified the cultural traits and other exogenously determined country-specific characteristics associated with high trust levels, we could predict the size and design of any country's welfare state (ibid.). We disapprove of this peculiar notion. Instead, we view trust levels as informal institutions; besides formal institutions, they form what North (Reference North1990) and his followers call the rules and constraints devised to structure human interactions. The essence of the massive literature on institutions and economic growth boils down to the importance of changes in formal and informal institutions; the necessary institutional changes enable societies to undergo a transition from one kind of equilibrium to another. True, changes in informal institutions are often incremental, and what the literature coins path dependence thwarts abrupt shifts in values and attitudes. Still, Acemoglu and Robinson (Reference Acemoglu and Robinson2012) instance various “nonincremental” changes in countries’ formal and informal institutions that have either propelled or impeded long-term economic development.
Authors concur that inequality is one of the most reliable predictors of historical trust levels (Rothstein Reference Rothstein2009; Uslaner Reference Uslaner2002: 186). The level of trust is negatively correlated with inequality; low levels of trust go hand in hand with high levels of inequality. Jordahl (Reference Jordahl, Svendsen and Haase Svendsen2009) lists two causal mechanisms that tie inequality and trust together. First, people who belong to the same socioeconomic group tend to trust each other more than people who are split by large gaps in income, skill levels, and professional characteristics. Second, inequality may lead to struggles for public goods. In a welfare state context, a struggle for resources is particularly troublesome because it feeds into free-riding and thereby erodes the moral foundation on which the distribution of public goods rests.
Against the idea that equality creates trust stands the notion that trust is sticky and path dependent (Bjørnskov and Svendsen Reference Bjørnskov and Svendsen2012). Rothstein and Uslaner (Reference Rothstein and Uslaner2005) take a very pessimistic stance as to whether a factor affecting trust could make it grow. To explain why Sweden appears to have had high trust levels before the welfare state came into being, they purport to prove that Sweden has always been equal. We agree with them that the formation of universal policies was predicated on low levels of inequality, but we disagree that equality stemmed from ancient egalitarian structures. Instead, the inequality evidence that we have marshaled illustrates that Sweden was relatively unequal in the 1920s but experienced a true equality revolution in the 1930s and 1940s. As our Swedish review shows, and as compelling evidence from the economic history literature testifies, the level of inequality has undergone major changes (Atkinson et al. Reference Atkinson, Piketty, Saez, Atkinson and Piketty2010; Fogel Reference Fogel2000; Morrison Reference Morrisson, Atkinson and Bourguignon2000).
However, that trust went up as inequality levels went down cannot be but a preliminary conjecture. In the United States the massive increase in inequality has run parallel to decreasing trust.Footnote 17 This negative correlation does not imply causation, of course; nothing excludes the possibility that an additional factor, like surging immigration, affects both inequality and trust. Moreover, inequality has gone up in other welfare state countries too but without being accompanied by decreasing trust. The responsiveness of trust to changes in inequality probably depends on various factors. Because the universal welfare state fosters social trust, we cannot expect that the increase in inequality since the early 1980s necessarily has given rise to a proportional decrease in social trust. Universal welfare state policies act as a check against a very elastic supply of trust (Rothstein Reference Rothstein2009). In the past, trust levels were probably more susceptible to changes in inequality because welfare depended solely on wages and benefits in kind.
So far we have suggested that social trust levels in Sweden responded positively to declining inequality, as these variables appear to correlate inversely today, when trust levels are known (Jordahl Reference Jordahl2007; Uslaner Reference Uslaner2002). We admit though that besides this indirect route to establish historical trust levels there is very little we can do within the scope of this paper to assess precisely the presurvey dimension of trust. Instead, we would like to add examples of social and political processes that show the interconnection of inequality, trust, and institutional changes promoting collective consciousness.
Trust against the Institutional Background
To substantiate our idea that trust did increase from the 1920s to the 1950s in Sweden, the following exemplifies four political and institutional developments that may have been propitious for social cohesion and trust breeding.
The first concerns the transition from conflicts to quiescence of trade and labor union actions. The Swedish labor markets in the 1920s were conflict ridden by international standards (Shorter and Tilly Reference Shorter and Tilly1974: 333). Most of the protracted conflicts concerned wage conditions because labor unions were dissatisfied with the real wage gains they made in the 1920s and 1930s. Unions voted to strike for pay increases, and employers responded by deploying their most fearful weapon: mass, multiemployer lockouts (Swenson Reference Swenson2002). The repeated conflicts hint that the negotiating parties in the labor markets held each other in contempt, and that mistrust and antagonism were, most probably, deeply entrenched (Hamark Reference Hamark2014; Isacson Reference Isacson1987). The nadir of Swedish labor market conflict occurred in Ådalen in May 1931, when the military opened fire against striking workers. Further cooperation between the parties LO (the Swedish Trade Union Confederation) and SAF (the Swedish Employers’ Confederation) seemed ever more remote as LO withdrew from the labor peace committee set up in 1929, which was made up of leading representatives from labor and management and some government appointees. It was against this backdrop of tension in the labor markets that the march toward the Saltsjöbad accord—inarguably one of the pillars of the Swedish model—began in the latter half of the 1930s.
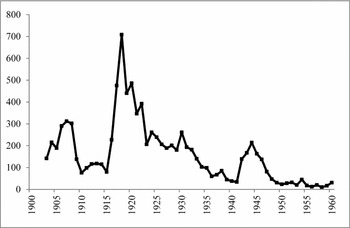
The Saltsjöbad accord was a landmark in the search for an institutional solution to the costly conflicts that plagued the Swedish labor markets. Rothstein (Reference Rothstein2005: 188) calls it the “hidden agenda of trust” and attaches great importance to it in spurring higher trust levels. The accord had nothing to do with future real-wage gains; instead, it provided the formal regulations of the negotiating process. The importance of the accord lies foremost in that it embodies a spirit of trust and cooperation, which contrasts with the previous regime of mistrust and bitterness. The aim of the accord was to bring down the number of labor market conflicts, and it achieved that aim by a wide margin (figure 10). We surmise that the march toward sharply diminished wage differentials across the entire manufacturing industry in the 1930s and 1940s (section 3, figure 4) tempered workers’ eagerness to fight for higher real-wage gains. The compression of wage differentials was instrumental in raising the relative level of nominal wages in the lowest-paid industries (known as β-convergence). We argue that the Saltsjöbad accord marks a discontinuity in the relationship between employers and employees in the labor market. The fact that the number of conflicts diminished sharply by the accord's implementation provides us with the first evidence that trust levels in Swedish society were on the rise.Footnote 18
Number of stoppages (lockouts and strikes) in Sweden 1903–60.Source: www.historia.se.

A contrasting view from Brazil, whose abysmal inequality and trust records set it apart, serves to underline the importance of labor market developments for social coherence.Footnote 19 From Estado Novo (1937), post–World War II Brazil inherited a highly centralized and corporatist system of industrial relations that would set the stage for relations between industrialists and labor in decades to come (Colistete Reference Colistete2007). Centralization may provide an institutional bulwark against high strike frequency (Ross and Hartman Reference Ross and Hartman1960). Despite the institutionalized arena, relations between the two camps remained hostile and antagonistic, heralding the military coup in 1964. In Brazil, communist and other left-wing groups pursued an agenda for workers’ betterment and social reforms; and employers, in constant fear of social unrest and under sway of the US anticommunist foreign policy, did not consider the leftist labor unions trustworthy partners. Instead, employers pursued antilabor policies on the shop floor and rallied at the political level against redistribution and legislation aimed at improved working conditions (Colistete Reference Colistete2001). Moreover, the scarce evidence of inequality indicates that incomes became more concentrated in the hands of capitalists (Tolipan and Tinelli Reference Tolipan and Tinelli1975). The conflict-ridden labor market environment of Brazil precluded a contract based on trust and mutual understanding. Needless to add, several additional factors impeded the emergence of a generous welfare state in Brazil and other Latin American countries (Haggard and Kaufman Reference Haggard and Kaufman2008). Still, the deficiency of solid labor market institutions that undergird trust breeding and social cohesion comes a long way in explaining why Brazil never developed anything near a universal welfare state.
The second example is the formation of stable class coalitions between the Peasant Party and the Social Democrats. The two parties formed a coalition in 1933 centered on policies to fight unemployment and shield the agricultural sector from falling prices in the world market (Morell Reference Morell2001: 78ff; Nyman Reference Nyman1944). The deal between the two would pave the way for additional regulations of prices of agricultural output in line with the interest of the Peasant Party and open the door for an active labor market policy, which ranked high on the agenda of the Social Democrats. The agreement would furthermore establish the foundation for long-term cooperation between the two parties across a wide range of political areas. It marks the beginning of a long-lasting era in which the Social Democrats would ascend to the throne of Swedish politics, manifested through a sustainable rise in their share of the vote (from 30–40 percent in 1911–28 to 40–53 percent in 1932–88). It also marks the end of the political turmoil of the 1920s when political power shifted several times.
Still, the utmost importance of the agreement for the interpretation of trust and inequality lay in its potential to bridge the astounding gap in the relative standing of industrial and agricultural workers. Asymmetric responses to the market upturns and downturns of product prices during World War I and its aftermath, in addition to an eight-hour working day reform that sidestepped agriculture, brought the urban-rural hourly earnings gap to an all-time high by the end of the 1920s. Yet the gap began to shrink rapidly from the mid-1930s down to the end of the 1940s, when it returned to its pre–World War I order of magnitude. The reduction in intersectoral inequality brought the two largest groups of workers closer, through political coalitions, institutional formation, and income convergence, which may have created a feeling of fraternity and a shared fate.
Besides the two political and institutional factors, we suggest a third factor that may have bred trust in the 1940s—namely, that the hardships people endured during World War II forced groups of people closer to one another. True, Sweden was not among the belligerent countries, which means that the privations experienced by the Swedish people pales in comparison with those of most other European countries. Still, the impending danger that overshadowed life set the stage for social relations that would be conducive to the creation of trust. As young males were called up for military service, female workers filled the vacuum and performed labor duties that traditionally had been the sole preserve of male workers (Åmark Reference Åmark and Christiansen2006; Svensson Reference Svensson1996). Women previously accustomed to household work, in particular maids, made their first entrance into an arena where they would become acquainted with other female workers from across various socioeconomic strata of the population; boundaries were crossed and bonds previously unthinkable were established. Additionally, more than a million males were called up for military duties during six years. They were forced to coexist under ordinary conditions where previous attributes such as age, social class, and education no longer conferred any privileges (Dahlberg Reference Dahlberg1983: 89). Class society ceased to exist, at least for a while.
Adversity, imposed as in this case on people from a foreign power, may under certain conditions bring a nation together. To deal efficiently with the imminent problems of war mobilization, political parties and interest groups prioritized cooperation before confrontation. The coalition government—led by the Social Democratic party leader Per Albin Hansson, which was formed in December of 1939 and resigned in July of 1945—enjoyed widespread support, which was apparent by the election in 1940 when it achieved an astounding 53.8 percent of the vote—the peak in Social Democrat ascendancy (Hadenius Reference Hadenius1995). In contrast to the war-ravaged countries and those plagued by strong internal frictions, Sweden pursued a trajectory of trust breeding through institutional formation, political coalitions, and compression of income differentials in a peaceful environment. The foundation of the welfare state was established at the beginning of the 1950s, thanks in part to a fortuitous combination of circumstances.
Our fourth historical example of growing trust concerns Swedish voters’ inclination to allow the state to assume greater responsibility for welfare distribution. Rothstein (Reference Rothstein2011: ch. 6) asks the pertinent question of what made the working classes mobilize support for protection against sickness and provision of pensions by the state. In short, widespread support for assigning the state the main responsibility of welfare distribution is quality of government, which implies above all impartiality in the exercise of public authority. The most significant reforms regulating civil servants’ employment contracts and wielding of power occurred in the 1860s and 1870s, which formed the basis for quality of government. A similar development occurred in Denmark between the 1840s and 1860s (Frisk Jensen Reference Frisk Jensen2013). The state was thus prepared to assume the overall responsibility for welfare distribution.
The somewhat belated introduction of universal suffrage provides us with an indicative gauge of the extent to which the Swedish population trusted the state, namely, the evolution of election turnouts. In the election for parliament of 1921 the turnout reached 54 percent, meager also in an international perspective. The turnout then increased steadily throughout the 1920s, 1930s, and 1940s, leveled off at about 80 percent in the 1950s, and reached an astounding 90 percent in the 1970s (Hadenius Reference Hadenius1995: 273). The bulk of this massive increase in turnout took place in the interwar years, which is indicative of the growing trust and willingness to hand over welfare responsibilities to the state.
Conclusions
To consider the welfare state an institution designed primarily to narrow gaps in disposable income is a perspective that fails to appreciate the importance of inequality as a factor affecting its design. To confirm the view that egalitarianism is an essential requisite for a particular design of the welfare state, we need to identify a true inequality revolution in a country with a Scandinavian kind of welfare state that predates the emergence of the universal principles of welfare distribution. Or we should conclude, as some previous research suggests, that inequality levels have always been low in countries with this kind of welfare state design.
We examined at length the previous evidence of income distribution in Sweden, a country known for ambitious social policies and narrow income gaps, and considered by many as the prototype of a social-democratic welfare state. Previous evidence shows that relatively high inequality levels prevailed until at least the end of the 1920s. Then an impressive reduction took place until about 1950. Among the usual suspects, conditions in the labor markets appear to explain much of the reduction. We strengthen the view of income leveling in Sweden, in general, and wage convergence, in particular, by constructing new interindustry and between-sector inequality measures of labor market outcomes. Our new evidence bears testimony to a remarkable contraction of wage differentials across industries and sectors from 1935 to 1950, which contradicts the assertions that Scandinavian egalitarianism belongs to the very remote past. Thus, inequality levels were reduced before the redistributing policies of the welfare state emerged, and changes in the labor markets appear to have been responsible for much of that reduction. Our brief review of Denmark, Norway, and Finland shows a similar inequality reduction before the welfare state appeared on the stage.
Discussions about income-related benefits started long before the actual implementation of them in the 1950s. Hence, the policy discussions progressed simultaneously with the inequality decline. The parallel developments indicate that support for universal policies, with its risks of free-riding behavior, grew as inequality declined. Our evidence and line of argument imply a counterfactual question: Would a welfare state like the Swedish one have really developed in a very unequal society? Previous cross-country evidence shows that redistributive policy developed more easily in countries that were previously more egalitarian. We add further evidence buttressing that inequality is a necessary but by no means sufficient condition for the rise of a universal welfare state.
What makes the level of inequality important for the formation of the welfare state is trust, a social phenomenon that recent research considers a necessary prerequisite for the Scandinavian model of welfare distribution. Without trust, the problems of free-riding and misuse of public goods would be insurmountable. Inequality, however, is a social characteristic that gives rise to mistrust and prevents welfare distribution policies in accordance with universal principles from being established. Countries plagued by a much skewed income distribution are imprisoned in a vicious circle, a social trap, which frustrates all attempts to establish policies aiming at redistribution. Once established, the universal welfare state brought forth and sustained the high trust levels that come out in recent cross-country surveys. In these, the Scandinavian countries overachieve.
To understand why some countries unlocked the social trap, the relationship between trust and inequality cannot be modeled as an independent variable (inequality) affecting a dependent variable (trust). If we recognized that causation runs both ways, we would open the door for a dynamic view of trust in which institutions, trust, and inequality interact. We bring support to this dynamic view of rising trust levels before the rise of the welfare state in the 1950s by epitomizing four institutional and political developments—for instance, the march toward peaceful settings in the labor markets in the 1930s, manifested above all through the Saltsjöbad accord, and the coalitions between the Social Democrats and the Peasant Party—that illustrate the interplay among inequality, institutions, and trust.
The income compression and the trust breeding sociopolitical processes underline the importance in viewing trust as elastic; it is receptive to institutional setups, distribution of power, and short-term changes in the relative incomes of different worker groups. If we were correct in our identification of the forces that unlocked the social trap in Sweden in the 1930s and the 1940s and that paved the way for the universal welfare state, we would deliver a hopeful message to those countries that struggle to end corruption, boost trust levels, and enact social policies to undercut social injustice. The dynamics of socioeconomic change and the importance of trust building from above imply that the key to unlocking the social trap is at the disposal of these countries.