


%20--%3e%3c!DOCTYPE%20svg%20PUBLIC%20'-//W3C//DTD%20SVG%201.0//EN'%20'http://www.w3.org/TR/2001/REC-SVG-20010904/DTD/svg10.dtd'%3e%3csvg%20version='1.0'%20id='Layer_1'%20xmlns='http://www.w3.org/2000/svg'%20xmlns:xlink='http://www.w3.org/1999/xlink'%20x='0px'%20y='0px'%20width='64px'%20height='64px'%20viewBox='5.5%20-3.5%2064%2064'%20enable-background='new%205.5%20-3.5%2064%2064'%20xml:space='preserve'%3e%3cg%3e%3ccircle%20fill='%23FFFFFF'%20fill-opacity='0'%20cx='37.785'%20cy='28.501'%20r='28.836'/%3e%3cpath%20fill='%23595959'%20d='M37.441-3.5c8.951,0,16.572,3.125,22.857,9.372c3.008,3.009,5.295,6.448,6.857,10.314%20c1.561,3.867,2.344,7.971,2.344,12.314c0,4.381-0.773,8.486-2.314,12.313c-1.543,3.828-3.82,7.21-6.828,10.143%20c-3.123,3.085-6.666,5.448-10.629,7.086c-3.961,1.638-8.057,2.457-12.285,2.457s-8.276-0.808-12.143-2.429%20c-3.866-1.618-7.333-3.961-10.4-7.027c-3.067-3.066-5.4-6.524-7-10.372S5.5,32.767,5.5,28.5c0-4.229,0.809-8.295,2.428-12.2%20c1.619-3.905,3.972-7.4,7.057-10.486C21.08-0.394,28.565-3.5,37.441-3.5z%20M37.557,2.272c-7.314,0-13.467,2.553-18.458,7.657%20c-2.515,2.553-4.448,5.419-5.8,8.6c-1.354,3.181-2.029,6.505-2.029,9.972c0,3.429,0.675,6.734,2.029,9.913%20c1.353,3.183,3.285,6.021,5.8,8.516c2.514,2.496,5.351,4.399,8.515,5.715c3.161,1.314,6.476,1.971,9.943,1.971%20c3.428,0,6.75-0.665,9.973-1.999c3.219-1.335,6.121-3.257,8.713-5.771c4.99-4.876,7.484-10.99,7.484-18.344%20c0-3.543-0.648-6.895-1.943-10.057c-1.293-3.162-3.18-5.98-5.654-8.458C50.984,4.844,44.795,2.272,37.557,2.272z%20M37.156,23.187%20l-4.287,2.229c-0.458-0.951-1.019-1.619-1.685-2c-0.667-0.38-1.286-0.571-1.858-0.571c-2.856,0-4.286,1.885-4.286,5.657%20c0,1.714,0.362,3.084,1.085,4.113c0.724,1.029,1.791,1.544,3.201,1.544c1.867,0,3.181-0.915,3.944-2.743l3.942,2%20c-0.838,1.563-2,2.791-3.486,3.686c-1.484,0.896-3.123,1.343-4.914,1.343c-2.857,0-5.163-0.875-6.915-2.629%20c-1.752-1.752-2.628-4.19-2.628-7.313c0-3.048,0.886-5.466,2.657-7.257c1.771-1.79,4.009-2.686,6.715-2.686%20C32.604,18.558,35.441,20.101,37.156,23.187z%20M55.613,23.187l-4.229,2.229c-0.457-0.951-1.02-1.619-1.686-2%20c-0.668-0.38-1.307-0.571-1.914-0.571c-2.857,0-4.287,1.885-4.287,5.657c0,1.714,0.363,3.084,1.086,4.113%20c0.723,1.029,1.789,1.544,3.201,1.544c1.865,0,3.18-0.915,3.941-2.743l4,2c-0.875,1.563-2.057,2.791-3.541,3.686%20c-1.486,0.896-3.105,1.343-4.857,1.343c-2.896,0-5.209-0.875-6.941-2.629c-1.736-1.752-2.602-4.19-2.602-7.313%20c0-3.048,0.885-5.466,2.658-7.257c1.77-1.79,4.008-2.686,6.713-2.686C51.117,18.558,53.938,20.101,55.613,23.187z'/%3e%3c/g%3e%3c/svg%3e)
%20--%3e%3c!DOCTYPE%20svg%20PUBLIC%20'-//W3C//DTD%20SVG%201.0//EN'%20'http://www.w3.org/TR/2001/REC-SVG-20010904/DTD/svg10.dtd'%3e%3csvg%20version='1.0'%20id='Layer_1'%20xmlns='http://www.w3.org/2000/svg'%20xmlns:xlink='http://www.w3.org/1999/xlink'%20x='0px'%20y='0px'%20width='64px'%20height='64px'%20viewBox='5.5%20-3.5%2064%2064'%20enable-background='new%205.5%20-3.5%2064%2064'%20xml:space='preserve'%3e%3cg%3e%3ccircle%20fill='%23FFFFFF'%20fill-opacity='0'%20cx='37.637'%20cy='28.806'%20r='28.276'/%3e%3cg%3e%3cpath%20fill='%23595959'%20d='M37.443-3.5c8.988,0,16.57,3.085,22.742,9.257C66.393,11.967,69.5,19.548,69.5,28.5c0,8.991-3.049,16.476-9.145,22.456%20C53.879,57.319,46.242,60.5,37.443,60.5c-8.649,0-16.153-3.144-22.514-9.43C8.644,44.784,5.5,37.262,5.5,28.5%20c0-8.761,3.144-16.342,9.429-22.742C21.101-0.415,28.604-3.5,37.443-3.5z%20M37.557,2.272c-7.276,0-13.428,2.553-18.457,7.657%20c-5.22,5.334-7.829,11.525-7.829,18.572c0,7.086,2.59,13.22,7.77,18.398c5.181,5.182,11.352,7.771,18.514,7.771%20c7.123,0,13.334-2.607,18.629-7.828c5.029-4.838,7.543-10.952,7.543-18.343c0-7.276-2.553-13.465-7.656-18.571%20C50.967,4.824,44.795,2.272,37.557,2.272z%20M46.129,20.557v13.085h-3.656v15.542h-9.944V33.643h-3.656V20.557%20c0-0.572,0.2-1.057,0.599-1.457c0.401-0.399,0.887-0.6,1.457-0.6h13.144c0.533,0,1.01,0.2,1.428,0.6%20C45.918,19.5,46.129,19.986,46.129,20.557z%20M33.042,12.329c0-3.008,1.485-4.514,4.458-4.514s4.457,1.504,4.457,4.514%20c0,2.971-1.486,4.457-4.457,4.457S33.042,15.3,33.042,12.329z'/%3e%3c/g%3e%3c/g%3e%3c/svg%3e)
Introduction
Bacterial antimicrobial resistance (AMR) was estimated to be directly attributable to 1.27 million deaths and associated with 4.95 million deaths worldwide in 2019; 141,000 attributable and 569,000 associated deaths occurred in the World Health Organization Region of the Americas. Reference Murray, Ikuta and Sharara1,Reference Robles Aguilar, Han and Gerbaudo2 In the United States, the Centers for Disease Control and Prevention (CDC) estimated more than 2.8 million antimicrobial-resistant infections and more than 35,000 deaths annually in 2019. 3 National analyses also documented substantial healthcare costs associated with multidrug-resistant infections among hospitalized patients, and among adults aged 65 years or older these infections were associated with an estimated $1.8 billion in healthcare costs, 10,509 deaths, and 434,507 inpatient days in 2017. Reference Nelson, Hatfield and Wolford4,Reference Nelson, Hyun, Jezek and Samore5
Older adults are a priority population for AMR surveillance because comorbidity, healthcare exposure, indwelling devices, recurrent antibiotic exposure, and transitions across acute, postacute, and community settings concentrate infection and resistance risk. Reference Nelson, Hyun, Jezek and Samore5,Reference Wolford, McCarthy and Baggs6 Yet facility- and isolate-centered reports provide limited context on the underlying microbiology-tested population. In large electronic health record (EHR) networks, temporal changes may also reflect changing testing intensity, specimen mix, care setting, or network composition.
Priority AMR phenotypes differ in organism ecology, specimen distribution, healthcare association, and infection-prevention implications. A pooled metric can therefore obscure differences among methicillin-resistant Staphylococcus aureus (MRSA), vancomycin-resistant Enterococcus spp. (VRE), extended-spectrum beta-lactamase phenotype/proxy (ESBL), carbapenem-resistant Enterobacterales (CRE), carbapenem-resistant Pseudomonas aeruginosa (CRPA), and carbapenem-resistant Acinetobacter spp. (CRAB). 7
We used Epic Cosmos, a multi-institutional US EHR aggregation platform, to characterize phenotype-specific AMR positivity, temporal trends, and associations with care setting and area-level social vulnerability among microbiology-tested adults aged 65 years or older from 2016 through 2025. Reference Tarabichi, Frees and Honeywell8,Reference Noel, Saleem and Eggleston9
Methods
Study design and reporting
We conducted a retrospective serial cross-sectional analysis of phenotype-specific microbiology-tested records in Epic Cosmos from January 1, 2016, through December 31, 2025. Reporting followed the Strengthening the Reporting of Observational Studies in Epidemiology (STROBE) framework. Reference von Elm, Altman and Egger10
Data source and cohort construction
We included adults aged 65 years or older from the 50 US states and District of Columbia with eligible susceptibility-tested records for 1 of 6 AMR phenotypes. For each patient, phenotype, and calendar year, we retained the first eligible tested record; a patient could therefore contribute no more than 1 record per phenotype per year. Cosmos masks healthcare-system and facility identities. The highest available anonymous organizational unit was the clinical department/location identifier, which was used to describe contributing locations and cluster standard errors but was not interpreted as a hospital. Because these identifiers were not validated as one-to-one facility identifiers, a stable-facility cohort could not be constructed reliably. Cohort construction is shown in Supplementary Tables S1A-S1B and Figure S1.
Phenotype definitions and denominators
Phenotype-specific denominators were records tested for the relevant organism-antimicrobial combination; AMR-positive records met the corresponding operational resistance or nonsusceptibility definition (Supplementary Table S2). 11,12 For CRE, imipenem-only resistance did not qualify Proteus mirabilis, P. penneri, P. vulgaris, or Morganella morganii, and Providencia spp. were outside the finalized CRE species set. Qualifying carbapenems for the specified Proteus/Morganella organisms were meropenem, doripenem, ertapenem, or meropenem-vaborbactam.
ESBL was analyzed as an operational phenotype/proxy, not confirmed enzyme production, because confirmatory testing and MIC-level adjudication were not uniformly available. Phenotype screening is most directly interpretable for Escherichia coli, Klebsiella pneumoniae/K. oxytoca, and P. mirabilis; broader Enterobacterales third-generation-cephalosporin nonsusceptibility was retained as a proxy.
Covariates
Covariates were calendar year, age group, sex, race, ethnicity, primary payer, care setting, specimen group, patient state, clinical location, and Social Vulnerability Index (SVI). Cosmos supplied the 2020 CDC/Agency for Toxic Substances and Disease Registry overall SVI percentile linked to the patient’s recorded residential ZIP code. We used fixed national cut points: Q1 < 0.20, Q2 0.21–0.40, Q3 0.41–0.60, Q4 0.61–0.80, and Q5 > 0.80. Missing categorical values were retained as explicit categories. Race and ethnicity were interpreted as social markers, not biological causes. 13
Statistical analysis
We summarized tested and AMR-positive records, unique patients, encounters, anonymous clinical locations, and positivity by phenotype and subgroup. Wilson 95% confidence intervals (CIs) were calculated for annual positivity. Annual tested volumes and contributing-location counts were reported to characterize expansion of the observable network.
For each phenotype, aggregated Poisson log-link models used the log tested-record count as an offset to estimate adjusted positivity ratios (APRs). Reference Zou14,Reference McNutt, Wu, Xue and Hafner15 Covariate cells were defined by calendar year, age, sex, race, ethnicity, payer, SVI, care setting, specimen group, state, and clinical location. Models included all covariates and state fixed effects; robust standard errors were clustered by clinical location. Clinical-location fixed effects were not included because of memory and sparsity constraints. The models adjusted observable case mix and accounted for within-location correlation but did not eliminate bias from locations entering or leaving the network.
Pearson dispersion was calculated as Pearson χ2 divided by residual degrees of freedom. P values were exploratory and not multiplicity adjusted; interpretation emphasized APRs, 95% CIs, and consistency across phenotypes.
Sensitivity analyses
Sensitivity analyses grouped same-patient, same-phenotype records within 30 days as 1 case; retained only the first-ever patient-phenotype record across the full period; restricted to inpatient/emergency records; excluded laboratory-only records; or restricted to records with nonmissing SVI. Additional analyses counted intermediate results as AMR-positive, expanded the ESBL denominator, and restricted MRSA to clinical specimens. Binary screening tests without organism-specific antimicrobial susceptibility testing did not qualify, but susceptibility records generated for surveillance could not be identified consistently. Three calendar periods were also summarized (Supplementary Table S5A).
Results
Cohort and phenotype-specific denominators
The primary analysis included 21,427,196 first patient-phenotype-year tested records from 7,750,830 patients and 57,108 anonymous clinical locations (Table 1). Phenotype-specific positivity was 43.5% for MRSA, 29.6% for ESBL, 19.0% for CRAB, 6.0% for CRPA, 4.1% for VRE, and 0.4% for CRE.
Phenotype-specific tested records and antimicrobial resistance positivity

Table 1. Long description
A table with six rows and six columns comparing antimicrobial resistance positivity across different phenotypes. The columns are labeled Phenotype, Primary tested denominator, Tested records, AMR-positive records, Unique patients, and Positivity, percent. The rows are labeled with different phenotypes: MRSA, VRE, ESBL, CRE, CRPA, and CRAB. Each row provides specific data for the tested records, AMR-positive records, unique patients, and positivity percentage for each phenotype. For example, MRSA has 1,423,712 tested records, 619,049 AMR-positive records, 1,231,632 unique patients, and a positivity of 43.5 percent.
Note. Tested records include AMR-positive and susceptible/non-AMR records for each phenotype-specific organism–antimicrobial denominator. AMR, antimicrobial resistance; CRAB, carbapenem-resistant Acinetobacter spp.; CRE, carbapenem-resistant Enterobacterales; CRPA, carbapenem-resistant Pseudomonas aeruginosa; ESBL, extended-spectrum beta-lactamase phenotype/proxy; MRSA, methicillin-resistant Staphylococcus aureus; VRE, vancomycin-resistant Enterococcus spp.
Tested volumes and contributing clinical locations increased for every phenotype (Table 4; Supplementary Table S4). From 2016 to 2025, ESBL tested records increased from 390,232 to 1,502,632 and locations from 11,637 to 32,893; CRE records increased from 348,806 to 1,409,361 and locations from 10,957 to 32,223. Growth was also evident for MRSA, VRE, CRPA, and CRAB.
Antimicrobial resistance positivity by patient, care-setting, and specimen characteristics

Table 2. Long description
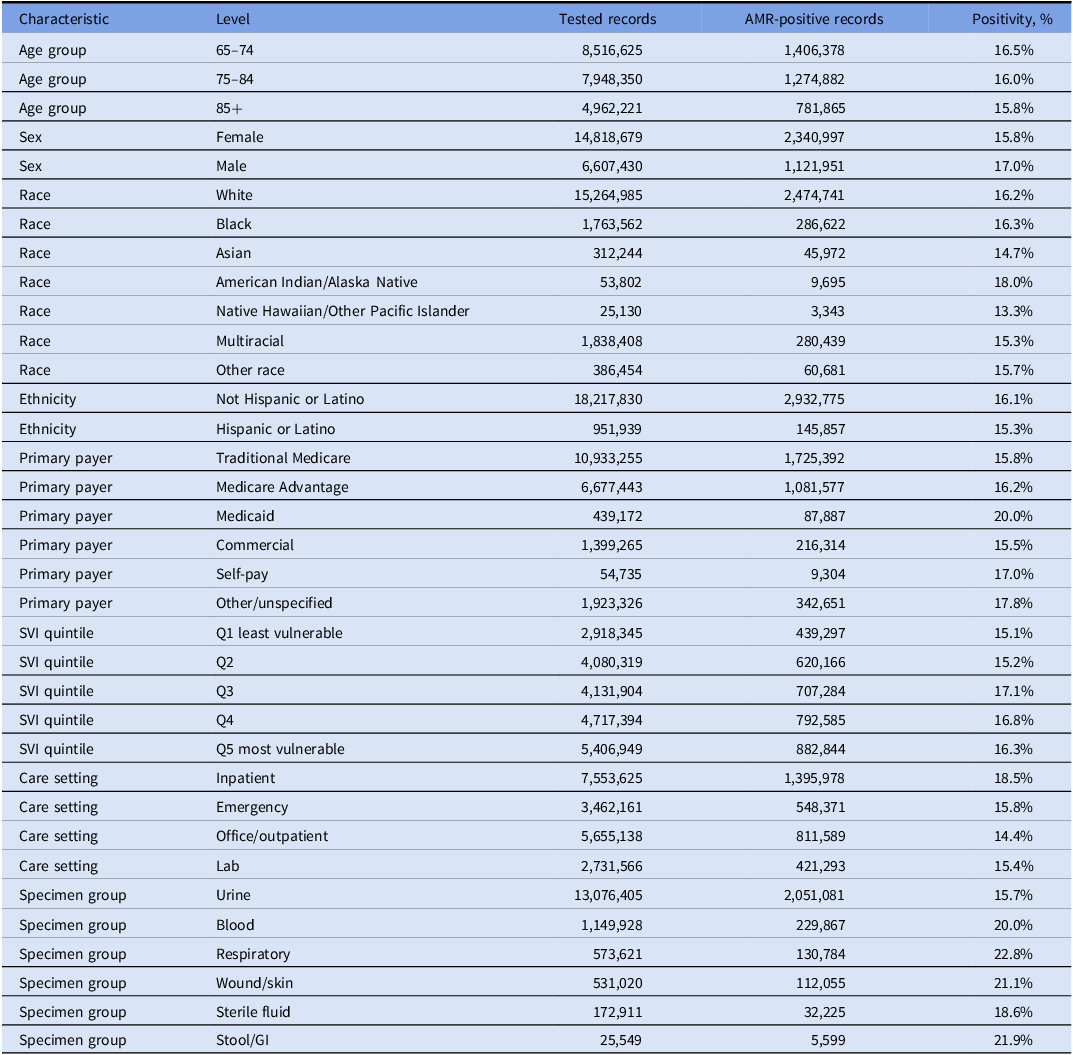
The table presents data on antimicrobial resistance (AMR) positivity across various characteristics, including age group, sex, race, ethnicity, primary payer, care setting, and specimen group. It has 30 rows and 5 columns. The columns are labeled Characteristic, Level, Tested records, AMR-positive records, and Positivity, %. The table lists different levels for each characteristic, such as age groups (65-74, 75-84, 85+), sex (female, male), race (white, black, Asian, etc.), ethnicity (not Hispanic or Latino, Hispanic or Latino), primary payer (Traditional Medicare, Medicare Advantage, Medicaid, etc.), care setting (inpatient, emergency, office/outpatient, lab), and specimen group (urine, blood, respiratory, wound/skin, sterile fluid, stool/GI). Each row provides the number of tested records, AMR-positive records, and the positivity percentage for each characteristic level.
Note. Denominators are first patient-phenotype-calendar-year tested records across the 6 primary phenotypes. These cross-phenotype summaries describe the composition of the tested-record data set and are not a pooled AMR prevalence measure. Missing/unknown categories were retained analytically but are not displayed. The larger number of records from female patients largely reflects urine-dominant testing. AMR, antimicrobial resistance; GI, gastrointestinal; SVI, Social Vulnerability Index.
Selected adjusted positivity ratios for antomicrobial resistance phenotype positivity

Table 3. Long description
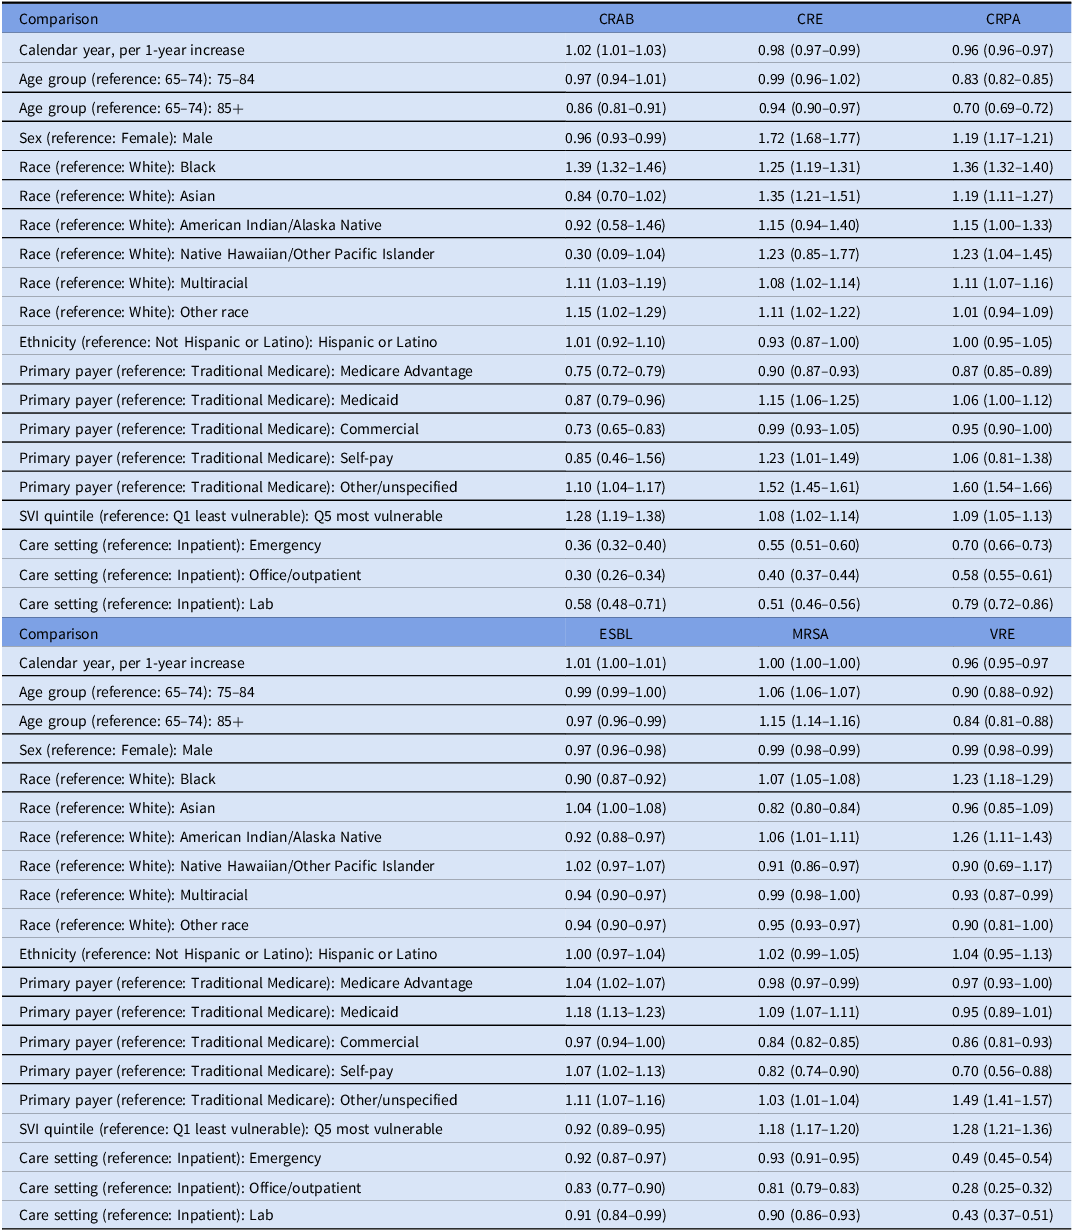
The table compares adjusted positivity ratios for different antimicrobial resistance phenotypes across various factors. It has 3 sections, with the first section focusing on CRAB, CRE, and CRPA, the second on ESBL, MRSA, and VRE, and the third on additional comparisons. Each section lists factors such as calendar year, age group, sex, race, ethnicity, primary payer, SVI quintile, and care setting. The table provides specific ratios and confidence intervals for each factor. For example, the ratio for CRAB increases by 1.02 per year, while for CRE and CRPA, it decreases by 0.98 and 0.96 per year, respectively. The table also shows variations based on age, sex, race, and other factors.
Note. Values are adjusted positivity ratios (95% CIs) from phenotype-specific Poisson models with a tested-record offset, state fixed effects, specimen adjustment, and clinical location-clustered robust standard errors. Reference categories are shown; full model output is provided in Supplementary Table S7. P values were exploratory and not multiplicity adjusted. CI, confidence interval; CRAB, carbapenem-resistant Acinetobacter spp.; CRE, carbapenem-resistant Enterobacterales; CRPA, carbapenem-resistant Pseudomonas aeruginosa; ESBL, extended-spectrum beta-lactamase phenotype/proxy; MRSA, methicillin-resistant Staphylococcus aureus; SVI, Social Vulnerability Index; VRE, vancomycin-resistant Enterococcus spp.
Expansion of phenotype-specific tested records and contributing anonymous clinical locations, 2016 versus 2025

Table 4. Long description
A table comparing phenotype-specific tested records and clinical locations between 2016 and 2025. The table has six rows and seven columns. The columns are labeled Phenotype, 2016 tested records, 2016 clinical locations, 2016 positivity percent, 2025 tested records, 2025 clinical locations, and 2025 positivity percent. The phenotypes listed are CRAB, CRE, CRPA, ESBL, MRSA, and VRE. Row 1: CRAB, 2,556, 1,201, 20.8 percent, 9,153, 4,509, 19.8 percent. Row 2: CRE, 348,806, 10,957, 0.5 percent, 1,409,361, 32,223, 0.4 percent. Row 3: CRPA, 39,265, 5,693, 8.6 percent, 179,341, 20,135, 5.1 percent. Row 4: ESBL, 390,232, 11,637, 30.2 percent, 1,502,632, 32,893, 31.8 percent. Row 5: MRSA, 76,798, 7,572, 45.3 percent, 221,961, 21,277, 45.2 percent. Row 6: VRE, 71,714, 6,856, 6.2 percent, 255,347, 21,448, 3.5 percent.
Note. Clinical locations are anonymous EHR department/location identifiers and should not be interpreted as hospitals or healthcare systems. Tested records equal unique patients within each phenotype-year by construction of the first patient-phenotype-calendar-year analytic unit. AMR, antimicrobial resistance; CRAB, carbapenem-resistant Acinetobacter spp.; CRE, carbapenem-resistant Enterobacterales; CRPA, carbapenem-resistant Pseudomonas aeruginosa; EHR, electronic health record; ESBL, extended-spectrum beta-lactamase phenotype/proxy; MRSA, methicillin-resistant Staphylococcus aureus; VRE, vancomycin-resistant Enterococcus spp.
Organism, setting, and specimen context
Among AMR-positive records, Escherichia coli (70.2%), Klebsiella pneumoniae (17.6%), and Proteus mirabilis (2.0%) accounted for 89.8% of ESBL phenotype/proxy records. Leading CRE groups were Enterobacter cloacae complex (30.6%), K. pneumoniae (25.6%), and E. coli (20.3%) (Supplementary Table S3).
Positivity was higher in inpatient records (18.5%) than emergency (15.8%), office/outpatient (14.4%), or laboratory records (15.4%) (Table 2). Respiratory, stool/gastrointestinal, wound/skin, and blood records had higher unadjusted positivity than urine records; urine nevertheless accounted for 61.0% of tested records and 59.2% of AMR-positive records.
Temporal trends
From 2016 to 2025, VRE positivity declined from 6.2% to 3.5%, CRPA from 8.6% to 5.1%, and CRE from 0.5% to 0.4%; MRSA remained broadly stable, ESBL decreased through 2018 and then increased to 31.8%, and CRAB varied (Figure 1). Adjusted annual APRs were 1.02 (95% CI, 1.01–1.03) for CRAB, 0.98 (0.97–0.99) for CRE, 0.96 (0.96–0.97) for CRPA, 0.96 (0.95–0.97) for VRE, and approximately null for ESBL and MRSA (Table 3).
Annual antimicrobial resistance phenotype positivity among adults aged 65 years or older in a US electronic health record network, 2016–2025. Points and lines show positivity percentages among first patient-phenotype-calendar-year tested records; error bars show Wilson 95% confidence intervals. Background bars show relative tested-record volume within each phenotype panel. AMR, antimicrobial resistance; CI, confidence interval; CRAB, carbapenem-resistant Acinetobacter spp.; CRE, carbapenem-resistant Enterobacterales; CRPA, carbapenem-resistant Pseudomonas aeruginosa; ESBL, extended-spectrum beta-lactamase phenotype/proxy; MRSA, methicillin-resistant Staphylococcus aureus; VRE, vancomycin-resistant Enterococcus spp.

Adjusted associations and sensitivity analyses
Compared with SVI Q1, Q5 had higher adjusted positivity for MRSA (APR, 1.18; 95% CI, 1.17–1.20), VRE (1.28; 1.21–1.36), CRE (1.08; 1.02–1.14), CRPA (1.09; 1.05–1.13), and CRAB (1.28; 1.19–1.38), but lower ESBL positivity (0.92; 0.89–0.95) (Figure 3). In adjusted models, noninpatient settings generally had lower positivity than inpatient settings (Figure 2).
Selected adjusted associations with antimicrobial resistance phenotype positivity. Points and horizontal lines show adjusted positivity ratios and 95% confidence intervals; the dashed vertical line marks a ratio of 1.0. AMR, antimicrobial resistance; APR, adjusted positivity ratio; CI, confidence interval; CRAB, carbapenem-resistant Acinetobacter spp.; CRE, carbapenem-resistant Enterobacterales; CRPA, carbapenem-resistant Pseudomonas aeruginosa; ESBL, extended-spectrum beta-lactamase phenotype/proxy; MRSA, methicillin-resistant Staphylococcus aureus; SVI, Social Vulnerability Index; VRE, vancomycin-resistant Enterococcus spp.

Adjusted antimicrobial resistance positivity ratios by Social Vulnerability Index quintile. Q1, the least vulnerable quintile, is the reference; Q5 is the most vulnerable quintile. AMR, antimicrobial resistance; APR, adjusted positivity ratio; CI, confidence interval; CRAB, carbapenem-resistant Acinetobacter spp.; CRE, carbapenem-resistant Enterobacterales; CRPA, carbapenem-resistant Pseudomonas aeruginosa; ESBL, extended-spectrum beta-lactamase phenotype/proxy; MRSA, methicillin-resistant Staphylococcus aureus; SVI, Social Vulnerability Index; VRE, vancomycin-resistant Enterococcus spp.

Figure 3. Long description
Six line graphs show the adjusted positivity ratio for different types of bacterial resistances across social vulnerability index quintiles. Panel A: CRAB. The y-axis represents the adjusted positivity ratio ranging from 0.9 to 1.4, and the x-axis represents the Social Vulnerability Index quintiles from Q1 to Q5. The graph shows an increasing trend in the adjusted positivity ratio from Q1 to Q5. Panel B: CRE. The y-axis ranges from 0.95 to 1.15, and the x-axis represents the Social Vulnerability Index quintiles. The graph shows a slight increase in the adjusted positivity ratio from Q1 to Q5. Panel C: CRPA. The y-axis ranges from 0.90 to 1.15, and the x-axis represents the Social Vulnerability Index quintiles. The graph shows a moderate increase in the adjusted positivity ratio from Q1 to Q5. Panel D: ESBL. The y-axis ranges from 0.90 to 1.10, and the x-axis represents the Social Vulnerability Index quintiles. The graph shows a fluctuating trend with a peak at Q3 and a decrease at Q5. Panel E: MRSA. The y-axis ranges from 0.95 to 1.20, and the x-axis represents the Social Vulnerability Index quintiles. The graph shows a consistent increase in the adjusted positivity ratio from Q1 to Q5. Panel F: VRE. The y-axis ranges from 0.90 to 1.30, and the x-axis represents the Social Vulnerability Index quintiles. The graph shows an increasing trend in the adjusted positivity ratio from Q1 to Q5.
Sensitivity analyses generally preserved phenotype rankings. Inpatient/emergency restriction increased positivity for most phenotypes; clinical-specimen-only MRSA positivity was 43.2%. Counting intermediate results as positive most visibly increased CRE (0.4% to 0.9%) and CRPA (6.0% to 9.8%). Pearson dispersion was minimal for 5 phenotypes and substantial for CRAB (5.52), warranting additional caution for CRAB estimates (Supplementary Table S6).
Discussion
In this large EHR-based analysis of microbiology-tested older adults, AMR positivity and temporal patterns differed substantially by phenotype, care setting, specimen group, and area-level vulnerability. MRSA and ESBL had the highest phenotype-specific positivity; VRE and CRPA declined; and SVI associations were directionally heterogeneous. These findings favor phenotype-specific interpretation rather than a pooled AMR metric.
The observable Cosmos network expanded during the study. Tested volumes and contributing anonymous clinical locations increased for every phenotype, so annual estimates may reflect both within-location change and changes in the mix of locations, patients, settings, specimens, and testing practices. Facility and healthcare-system identities were masked, and clinical-location identifiers were not validated as one-to-one facility identifiers; a stable-facility cohort could therefore not be constructed reliably. Our models adjusted observed case mix and clustered by location, but these steps do not remove network-composition bias.
Our results address positivity among tested records rather than infection incidence and therefore differ from national burden studies. Jernigan et al estimated 622,390 multidrug-resistant infections among hospitalized US patients in 2017, with MRSA and ESBL-producing Enterobacterales accounting for 52% and 32%, respectively. Reference Jernigan, Hatfield and Wolford16 The high MRSA and ESBL positivity in our tested population is directionally consistent, while the 43.2% clinical-specimen MRSA estimate also overlaps 2022 NHSN AR Option values. 17 CDC reported pandemic-era increases in several hospital-onset resistant infections, 18 whereas our mixed-setting older-adult population showed declining VRE and CRPA and stable MRSA. Differences may reflect setting, specimen and screening mix, operational definitions, stewardship and infection-prevention practices, and the evolving contributing network.
ESBL requires particular caution. Escherichia coli, Klebsiella pneumoniae, and Proteus mirabilis accounted for 89.8% of ESBL phenotype/proxy records, but third-generation-cephalosporin nonsusceptibility in other Enterobacterales may reflect AmpC or other mechanisms rather than confirmed ESBL production. 11,12 The later ESBL increase is consistent with continuing US concern and Emerging Infections Program data showing predominantly E. coli and frequent community association. Reference Duffy, Karlsson and Reses19 CRE remained uncommon after applying the corrected species-specific imipenem rule; the leading E. cloacae complex group may include ertapenem-only resistance from noncarbapenemase mechanisms, which could not be distinguished in the extract. Reference Rankin, Stahl and Sabour20 CRAB estimates were less precise because of the smaller denominator and substantial overdispersion.
Higher SVI was associated with higher adjusted positivity for 5 phenotypes but lower ESBL positivity. Prior studies have linked socioeconomic disadvantage with community-associated MRSA, multidrug-resistant Enterobacterales, pneumococcal resistance, and resistant outpatient urine cultures. Reference Chan, Westgard and Romasco21–Reference Mohanty, Ye, Sheets and Gupta25 The inverse ESBL association may reflect differential outpatient urine-culture density, community-onset exposure pathways, travel, Reference Cars and Melhus26 and the composition of the phenotype/proxy rather than lower biological risk in more vulnerable communities. Race, ethnicity, payer, and SVI estimates remain social-context associations and should not be interpreted as biological or causal effects.
This study has limitations. First, the evolving EHR network and masked facility identities precluded a valid stable-facility analysis; temporal patterns may therefore reflect network composition as well as within-location change. Encounters, cultures, and outcomes outside participating Epic organizations were not observed. Second, the data did not consistently distinguish clinical infection from colonization or surveillance testing, and urine dominated the tested population. Third, ZIP-level 2020 SVI is less granular than census-tract linkage, may mask within-ZIP heterogeneity, and may not represent residence at each encounter. Fourth, operational phenotype definitions depended on available EHR interpretations and did not uniformly include MIC adjudication, enzyme confirmation, or carbapenemase testing. Fifth, models did not include patient or clinical-location fixed effects, CRAB was overdispersed, missing categorical values were modeled explicitly rather than imputed, and multiple comparisons were exploratory. Outcomes and treatment appropriateness were outside this study.
Strengths include the large, multi-year tested population; inclusion of multiple critical- and high-priority phenotypes; explicit phenotype-specific denominators; specimen, setting, and SVI context; and transparent reporting of annual tested volume and contributing locations. EHR-derived surveillance may complement facility antibiograms and established surveillance by describing tested populations across settings, but trends from an expanding network should be interpreted cautiously and not as national incidence or population burden.
Supplementary material
The supplementary material for this article can be found at https://doi.org/10.1017/ash.2026.10878
Data availability statement
The data underlying this article were accessed through Epic Cosmos under institutional permissions and cannot be shared publicly because of data-use agreements. Aggregated outputs supporting the findings are provided in the tables and supplementary material.
Use of artificial intelligence tools. OpenAI ChatGPT (OpenAI; accessed May–August 2026) was used for language editing and refinement. It was not used to generate or analyze study data or make independent scientific interpretations. All outputs were reviewed and edited by the authors, who take full responsibility for the content.
Author contributions
M.A.M.: conceptualization, methodology, data curation, formal analysis, investigation, writing – original draft, and writing – review and editing. K.A.: conceptualization, methodology, quantitative and statistical modeling review, validation, supervision, and writing – review and editing. D.S.: methodology, quantitative and statistical modeling review, validation, supervision, and writing – review and editing. D.N.: clinical and microbiological interpretation, validation, and writing – review and editing. C.N.: methodology, validation, supervision, and writing – review and editing.
Financial support
None reported.
Competing interests
The authors declare none.
Ethics statement
This analysis used de-identified Epic Cosmos data under institutional permissions and did not constitute human-subjects research; institutional review board approval and informed consent were not required.




 Open access

