I. INTRODUCTION
With the increasing demands for miniaturization, high performance, and high reliability in electronic packaging, solder bumps are expected to be less than 10 μm in size and the current density through each solder bump could reach 104 to 105 A/cm2. Reference Jung and Yu1 In addition, current crowding tends to occur in the line-to-bump configuration in flip chip packages and the current density in the current crowding regions of solder bumps can be 10 to 20 times higher than the nominal value, which may lead to a serious Joule heating effect during solid–solid electromigration (S–S EM). Reference Chen, Tong and Tu2 Consequently, solder bumps may melt locally though the bumps might still maintain their initial shape due to the surface tension and protection from the underfill. Therefore, the S–S EM transforms into liquid–solid EM (L–S EM). Reference Lin, Hu, Tsai, Kao and Tu3 Since the diffusivity of atoms in liquid is several orders of magnitude faster than that in solid, Reference Cahoon4 the interfacial reaction and the failure mechanism during L–S EM will be significantly different. Huang et al. Reference Huang, Zhang, Zhao and Zhou5–Reference Huang, Zhang, Zhao and Yang8 reported that an abnormal diffusion behavior of Zn atoms occurred in Cu/Sn-9Zn/Cu and Cu/Sn–9Zn/Ni interconnects during L–S EM, which was induced by the positive effective charge number of Zn rather than the back-stress. Gu and Chan Reference Gu and Chan9 reported that two separate Bi-rich layers formed at the anode during L–S EM at 140 °C, but only one Bi-rich layer formed in the case of S–S EM at 75 °C. Liao et al. Reference Liao, Chung and Chen10 characterized the preferential Pb migration toward the anode in eutectic Sn–Pb molten solder during L–S EM, and the effective charge number of Pb was calculated to be −2.7, which is one order of magnitude lower than the value of −47 for self-EM in bulk Pb. Huang et al. Reference Huang, Tsai, Lin and Kao11 identified that the dissolution rate of the cathode Cu in Cu/Sn–3.5Ag/Cu interconnects during L–S EM was one order of magnitude faster than that during S–S EM. Since the damage to solder interconnects induced by L–S EM is more serious than that induced by S–S EM, the fundamental aspects of L–S EM are of interest.
Sn–52In (wt.%) eutectic solder, an alternative to the traditional Sn–Pb solders due to its lower melting temperature (120 °C), better wettability, higher ductility, and longer fatigue life, Reference Chuang, Yu, Chang and Wang12 has been used in temperature-sensitive components, optoelectronics modules, step soldering processes, and thin printed wiring boards. However, local melting of Sn–52In solder might occur in service due to its low melting temperature and pronounced Joule heating effect, which makes the L–S EM be a serious reliability issue. Moreover, both In and Sn can react with under bump metallizations to form interfacial intermetallic compounds (IMCs). A previous study on the S–S EM behavior of Cu/Sn–52In/Cu interconnects under 2.8 × 10⁴ A/cm2 at 80 °C showed that Sn and In atoms migrated in opposite directions, i.e., Sn atoms preferentially migrated toward the anode while In atoms migrated along the opposite direction toward the cathode. Reference Daghfal and Shang13 However, no attention seems to be paid to the L–S EM behavior in Cu/Sn–52In/Cu interconnects though it might induce a serious reliability issue.
The conventional approach by examining solder interconnects underwent different EM conditions cannot reveal the dynamical evolution of microstructure in the solder interconnects, especially for L–S EM. In the present study, synchrotron radiation real-time imaging technology was used to in situ observe the microstructural evolution of Cu/Sn–52In/Cu interconnects during EM for a better understanding of the interfacial reactions under electron current stressing. The migrations of Sn, In, and Cu atoms were discussed in terms of diffusion flux.
II. EXPERIMENTAL PROCEDURES
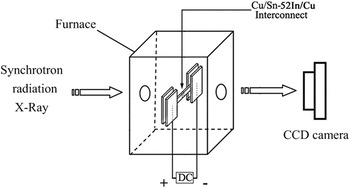
The line-type Cu/Sn–52In/Cu interconnects were prepared by immersion soldering at 260 °C for 10 s. To identify the consumption kinetics of the Cu substrate, polished Cu plates were electroplated with Au films of 5 μm in thickness as markers, followed with Cu films of 50 μm in thickness. The EM specimens were prepared in the same way as described in the previous study. Reference Chen, Huang and Zhou14 The cross-section of the line-type interconnects was 500 μm × 100 μm and the Sn–52In solder between the two Cu films was 200 μm in thickness. To prevent the liquid solder from leaking, a heat resisting organic film was coated on the solder surface. The S–S EM experiments were conducted under a current density of 2.0 × 10⁴ A/cm2 in silicone oil at an ambient temperature of 72 °C, and the actual temperature of the Sn–52In solder was 90 ± 2 °C due to Joule heating. Figure 1 shows the schematic of the L–S experimental configuration. The L–S EM experiments were conducted under a current density of 2.0 × 10⁴ A/cm2 in a specially designed furnace at an ambient temperature of 130 °C, and the actual temperature of the Sn–52In solder was 150 ± 2 °C. The temperature was monitored by a fine K-type thermocouple, which was placed in close proximity to the solder interconnect. The beginning of the L–S EM was defined as the state at which the solder started melting. After the L–S EM experiments, the solder interconnects were cooled down to room temperature.
Schematic of the L–S EM experimental configuration.

The synchrotron radiation real-time imaging experiments were carried out at the beam line BL13W1 of the Shanghai Synchrotron Radiation Facility (SSRF). A charged couple device camera with a resolution ratio of 0.37 μm/pixel and an exposure time of 4 s/frame was used to catch and collect the images. The microstructure of the Cu/Sn–52In/Cu interconnects after the EM experiments was examined using a scanning electron microscope (SEM) equipped with an energy dispersive x-ray (EDX) spectrometer.
III. RESULTS
A. Microstructure of the as-soldered interconnects
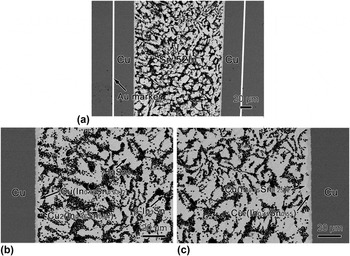
Figure 2 shows the SEM images of the cross-section of an as-soldered Cu/Sn–52In/Cu interconnect. A light-colored background dispersed with dark-colored regions was observed in the solder. EDX analyses identified that the light-colored background is Sn-rich phase with 79.2 at.% Sn, i.e., InSn4 (γ phase) while the dark regions are an In-rich phase with 73.9 at.% In, i.e., In3Sn (β phase). Two IMC layers formed at each interface, i.e., Cu2(In0.46Sn0.54) and Cu(In0.77Sn0.23)2 with 0.73 μm and 2.00 μm thickness, respectively.
SEM images of an as-soldered Cu/Sn–52In/Cu interconnect: (a) macrograph, (b) Cu/Sn–52In interface and (c) Sn–52In/Cu interface.

B. Microstructural evolution in the Cu/Sn–52In/Cu interconnects during S–S EM
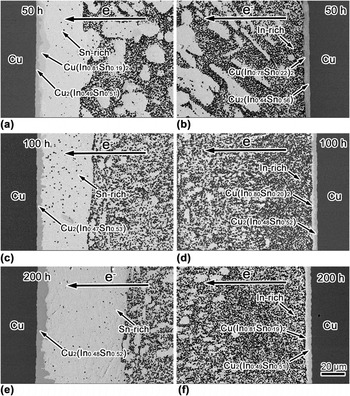
Figure 3 shows the SEM images of the Cu/Sn–52In/Cu interconnects during S–S EM at 90 °C. After 50 h, a thick Sn-rich layer formed at the anode and an In-rich layer formed at the cathode while the remained solder in between was still a mixture of Sn-rich and In-rich phases. With increasing S–S EM time, both the Sn-rich and In-rich layers at the interfaces continuously grew, indicating that the segregation between Sn and In atoms occurred. At the anode, after 50 h, the two interfacial IMCs were identified as Cu2(In0.49Sn0.51) and Cu(In0.81Sn0.19)2 with thicknesses of 3.15 μm and 3.57 μm, respectively; after 100 h, the Cu(In,Sn)2 IMC dissolved leaving only the Cu2(In0.47Sn0.53) IMC layer with a thickness of 4.97 μm; after 200 h, the thickness of the remained Cu2(In0.48Sn0.52) IMC layer increased to 7.70 μm. At the cathode, after 50 h, 100 h, and 200 h, the bilayer IMCs of Cu2(In,Sn) and Cu(In,Sn)2 had a total thickness of 4.53, 4.24, and 4.63 μm, respectively. Moreover, no obvious consumption of the cathode Cu was observed due to the low growth rate of the interfacial IMCs.
SEM images of the Cu/Sn–52In/Cu interconnects after S–S EM (2.0 × 10⁴ A/cm2, 90 °C) for various durations: (a) and (b) 50 h, (c) and (d) 100 h, and (e) and (f) 200 h.

C. Microstructural evolution in the Cu/Sn–52In/Cu interconnects during L–S EM
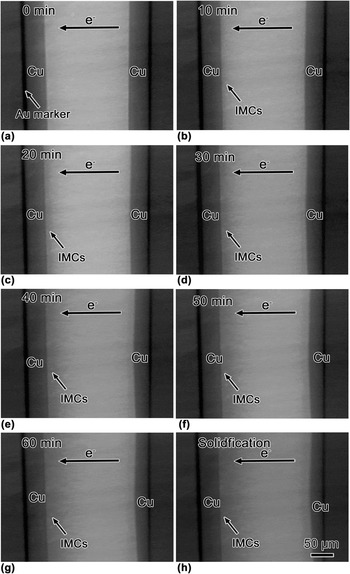
Figure 4 shows the synchrotron radiation images of a Cu/Sn–52In/Cu interconnect during L–S EM at 150 °C. As shown in Fig. 4(a), some bubbles were first observed in the Sn–52In solder, indicating the melting of the solder. After 10 min, a ruderal IMC layer formed at the anode while a thin, lamellar-like IMC layer formed at the cathode. After 20 min, many rod-like interfacial IMCs grew into the molten solder at the anode while the lamellar-like IMC layer remained thin at the cathode. Meanwhile, the cathode Cu was consumed markedly. With prolonged L–S EM time, the rod-like interfacial IMCs at the anode grew rapidly and penetrated into the molten solder while the interfacial IMC layer at the cathode remained thin. The consumption of the cathode Cu was significant whereas that of the anode Cu was not obvious even after L–S EM for 60 min. The interfacial IMC at the anode appears to be significantly thicker than that at the cathode throughout the in situ observation, indicating the occurrence of the polarity effect in the Cu/Sn–52In/Cu interconnect during L–S EM.
Synchrotron radiation images of the Cu/Sn–52In/Cu interconnect during L–S EM at 150 °C for various durations: (a) 0 min, (b) 10 min, (c) 20 min, (d) 30 min, (e) 40 min, (f) 50 min, (g) 60 min, and (h) after solidification.

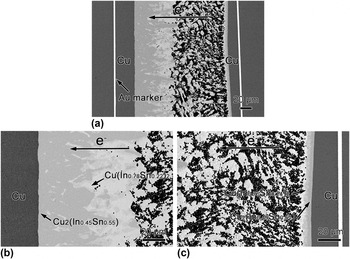
Figure 5 shows the SEM images of the Cu/Sn–52In/Cu interconnect after the L–S EM experiment. At the anode, the thick, dark-colored IMC layer close to the Cu was identified as Cu2(In0.45Sn0.55) while the irregular, light-colored IMC layer close to the solder was identified as Cu(In0.78Sn0.22)2. At the cathode, the thin IMCs also had a bilayer structure, i.e., the dark-colored Cu2(In0.49Sn0.51) close to the Cu substrate and the light-colored Cu(In0.76Sn0.24)2 close to the solder. In contrast to the case in S–S EM, no segregation between Sn and In atoms was evidenced at either the anode or the cathode.
SEM images of the Cu/Sn–52In/Cu interconnect after the L–S EM experiment (2.0 × 10⁴ A/cm2, 150 °C, 60 min): (a) macrograph, (b) anode interface, and (c) cathode interface.

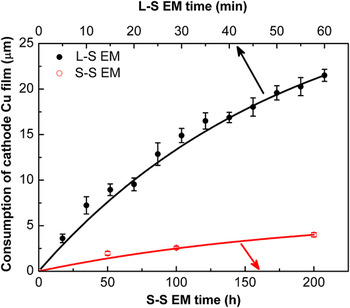
Figure 6 shows the consumption of the cathode Cu in the Cu/Sn–52In/Cu interconnects during L–S and S–S EM as a function of EM time. The consumption of the cathode Cu for both L–S and S–S EM exhibits a parabolic relationship with the EM time. However, the consumption rate of the cathode Cu during L–S EM is three orders of magnitude higher than that in the case of S–S EM.
Consumption of the cathode Cu in Cu/Sn–52In/Cu interconnects as a function of EM time.

IV. DISCUSSION
The Cu/Sn–52In/Cu interconnects displayed two distinguished features during S–S and L–S EM, i.e., the segregation of the Sn and In atoms during S–S EM while the significant consumption of the cathode Cu during L–S EM, which are discussed as follows.
A. Migration mechanisms of In and Sn atoms during EM
It is known that In has a negative effective charge number (Z*) and should diffuse in the same flowing direction of electrons, namely, from the cathode toward the anode. However, the In atoms in fact migrated from the anode toward the cathode during S–S EM. This can be explained by the EM-induced back-stress.
Considering the back-stress, the steady-state atomic diffusion flux J during S–S EM can be expressed as: Reference Gan and Tu15,Reference Conrad16
 $$J = {J_{{\rm{chem}}}} + {J_{{\rm{em}}}} + {J_{\rm{\sigma }}} = D{{\partial C} \over {\partial x}} + C{D \over {kT}}{Z^*}eE - C\Omega {D \over {kT}}{{\partial \sigma } \over {\partial x}}\quad ,$$
where J chem, J em, and J σ are the atomic fluxes induced by the chemical potential gradient, EM and back-stress gradient, respectively, D is the diffusivity, C is the atomic concentration, k is Boltzmann's constant, T is absolute temperature, e is the electronic charge, −∂σ/∂x is the back-stress gradient along the electron flowing direction, Ω is the atomic volume, and E is the electric field.
Figure 7 shows the schematic of the atomic fluxes and the microstructural evolution in the Cu/Sn–52In/Cu interconnects during EM. Figure 7(a) shows the schematic microstructure of the as-soldered interconnects. Figure 7(b) shows the In atomic diffusion fluxes at the anode and cathode interfaces during S–S EM, which can be derived as follows, respectively.
 $$J_{{\rm{anode}}}^{{\rm{In}}} = J_{{\rm{chem}}}^{{\rm{In}}} + J_{{\rm{em}}}^{{\rm{In}}} - J_{\rm{\sigma }}^{{\rm{In}}}\quad {\rm{,}}$$
 $$J_{{\rm{cathode}}}^{{\rm{In}}} = J_{{\rm{chem}}}^{{\rm{In}}} - J_{{\rm{em}}}^{{\rm{In}}} + J_{\rm{\sigma }}^{{\rm{In}}}\quad {\rm{,}}$$
where
 $J_{{\rm{anode}}}^{{\rm{In}}}$
is the In atomic flux toward the anode and
 $J_{{\rm{cathode}}}^{{\rm{In}}}$
is the In atomic flux toward the cathode.
Schematic of atomic fluxes in Cu/Sn–52In/Cu interconnects: (a) as-soldered, (b) S–S EM, and (c) L–S EM (where
 $J_{{\rm{chem}}}^{{\rm{In}}}$
,
 $J_{{\rm{em}}}^{{\rm{In}}}$
and
 $J_\sigma ^{{\rm{In}}}$
are the In atomic fluxes induced by chemical potential gradient, EM and back-stress gradient).

Equations (2) and (3) can be combined as:
 $$J_{{\rm{cathode}}}^{{\rm{In}}} - J_{{\rm{anode}}}^{In} = 2\left( {J_{\rm{\sigma }}^{{\rm{In}}} - J_{{\rm{em}}}^{{\rm{In}}}} \right) = 2{{CD} \over {kT}}\left( {{\Omega _{{\rm{In}}}}{{\partial \sigma } \over {\partial x}} - Z_{{\rm{In}}}^*e{E_{{\rm{In}}}}} \right)\quad {\rm{.}}$$
The apparent effective charge numbers of Sn and In during S–S EM are −18 and −11.5, respectively.
Reference Ho and Kwok17
Although both Sn and In atoms migrate toward the anode simultaneously, the driving force for the migration of Sn atoms should be higher, since the Z* value of Sn is larger than that of In. As a result, a back-stress from the anode to the cathode is generated by the directional migration of Sn atoms toward the anode, which tends to balance the forward EM flux and eliminate the net flux. According to Eq. (4), if
 ${{\partial \sigma } \mathord{\left/ {\vphantom {{\partial \sigma } {\partial x}}} \right. \kern-\nulldelimiterspace} {\partial x}} > {{Z_{{\rm{In}}}^* eE_{{\rm{In}}} } \mathord{\left/ {\vphantom {{Z_{{\rm{In}}}^* eE_{{\rm{In}}} } {\Omega _{In} }}} \right. \kern-\nulldelimiterspace} {\Omega _{In} }}$
holds, i.e.,
 $J_{{\rm{cathode}}}^{{\rm{In}}} - J_{{\rm{anode}}}^{{\rm{In}}} > 0$
, more In atoms would migrate to the cathode, which is consistent with the experimental results. Therefore, as the Sn atoms migrate toward the anode under electron wind force, the resulting back-stress drives the In atoms to migrate toward the cathode. Consequently, the interfacial IMCs at the anode transform from the initial [Cu2(In,Sn) + Cu(In,Sn)2] into Cu2(In,Sn) as a result of the depletion of In atoms, as shown in Figs. 3(a), 3(c) and 3(e).
However, there is no back-stress in liquid solder, and consequently J σ does not exist during L–S EM, as shown in Fig. 7(c). Therefore, the In atomic fluxes at the anode and cathode interfaces during L–S EM can be derived as follows, respectively.
 $$J_{{\rm{anode}}}^{{\rm{In}}} = J_{{\rm{chem}}}^{{\rm{In}}} + J_{_{{\rm{em}}}}^{{\rm{In}}}\quad {\rm{,}}$$
 $$J_{{\rm{cathode}}}^{{\rm{In}}} = J_{{\rm{chem}}}^{{\rm{In}}} - J_{{\rm{em}}}^{{\rm{In}}}\quad .$$
Equations (5) and (6) can be combined as:
 $$J_{{\rm{cathode}}}^{{\rm{In}}} - J_{{\rm{anode}}}^{{\rm{In}}} = - 2J_{{\rm{em}}}^{{\rm{In}}} = - 2{{CD} \over {kT}}Z_{{\rm{In}}}^*e{E_{{\rm{In}}}}\quad {\rm{.}}$$
Since the In atoms directionally migrate toward the anode during L–S EM, i.e.,
 $J_{{\rm{cathode}}}^{{\rm{In}}} - J_{{\rm{anode}}}^{{\rm{In}}} \lt 0$
, the Z* of In is still negative. Therefore, two factors, the absence of back-stress in liquid solder and the negative Z* of In, are considered to be critical for the directional migration of In atoms toward the anode during L–S EM. The In atomic flux is the major contributor to the growth of Cu–In IMCs, since In is the dominant diffusing species for the interfacial reaction in Cu/In system. With the directional migration of In atoms toward the anode during L–S EM, the Cu–In IMC layer at the anode will continuously grow. As a result, a significant polarity effect occurred, i.e., the IMCs growing continuously at the anode while becoming thinner at the cathode.
The effective charge number Z* of an atom in EM consists of two parts: Reference Huntington and Gron18
 $$Z^*{\rm{\ }} = {\rm{\ }}{Z_{{\rm{el}}}}{\rm{\ }} + {\rm{\ }}{Z_{{\rm{wd}}}}\quad ,$$
where Z el is the electrostatic charge number1 and Z wd is the charge number due to the electron wind force. Since Z el is positive while Z wd is negative, the moving direction of atoms during EM is determined by the sign of Z*. A model was used to calculate the Z wd for a liquid as follows: Reference Kumar, Howarth and Dutta19
 $${Z_{{\rm{wd,l}}}} \approx - {Z_{{\rm{el}}}}{{\Delta {H_{{\rm{m,l}}}}} \over {kT + \Delta {H_{\rm{f}}}}}{\left( {{{{m_0}} \over {m^*}}} \right)_{\rm{l}}}\quad {\rm{,}}$$
where ΔH
m,l is the activation energy for diffusion of liquid, ΔH
f is the latent heat of fusion, and m
0 and m* are the free-electron mass and the effective mobile electron mass. For simplicity, the m
0/m* is assumed to be 0.8. For In atoms,
 $\Delta H_{{\rm{m,l}}}^{{\rm{In}}}$
is 1.70 × 10⁻²⁰ J/atom
Reference Kumar, Howarth and Dutta19
and
 $\Delta H_f^{In}$
is 5.45 × 10⁻²¹ J/atom.
Reference Lin, Hu, Tsai, Kao and Tu3
Submitting these values into Eq. (9), Z wd equals to −3.6. According to Eq. (8), since Z el is +3, the Z* of In atoms equals to −0.6, i.e., |Z wd| > |Z el|, which is consistent with that in solid state. As a result, the In atoms are driven to migrate directionally toward the anode during L–S EM. Smolin and Frantsevich Reference Smolin and Frantsevich20 found that Z* is not a constant but a function of temperature, and the absolute value of Z* decreased with increasing temperature. Therefore, it is reasonable that the Z* of In atoms decreases rapidly at high temperatures during L–S EM. Huang et al. Reference Huang, Zhang, Zhao and Yang8 reported that the Z* of Zn is +0.63 during L–S EM; Kumar et al. Reference Kumar, Howarth and Dutta19 also reported that the absolute Z* values of Pb, Al, Bi, Ga, and Sn during liquid EM are much smaller than those during solid EM.
B. Migration mechanism of Cu atoms during EM
The migration of Cu atoms induced by L–S EM is from the cathode to the anode,
Reference Huang, Tsai, Lin and Kao11
which generates a Cu concentration gradient. Therefore, there exists a
 $J_{{\rm{chem}}}^{{\rm{Cu}}}$
caused by the chemical potential gradient of Cu against
 $J_{{\rm{em}}}^{{\rm{Cu}}}$
. The total Cu atomic flux
 $J_{{\rm{total}}}^{{\rm{Cu}}}$
can be expressed as:
 $$J_{{\rm{total}}}^{{\rm{Cu}}} = J_{{\rm{em}}}^{{\rm{Cu}}} - J_{{\rm{chem}}}^{{\rm{Cu}}} = C{D \over {kT}}Z_{{\rm{Cu}}}^*eE - D{{\partial C} \over {\partial x}}\quad {\rm{.}}$$
Since the Cu atoms continuously migrate from the cathode to the anode,
 $J_{{\rm{total}}}^{{\rm{Cu}}} > 0$
, and thus
 $J_{{\rm{em}}}^{{\rm{Cu}}} > J_{{\rm{chem}}}^{{\rm{Cu}}}$
. In other words, the diffusion of Cu atoms is due to the EM flux
 $J_{{\rm{em}}}^{{\rm{Cu}}}$
, which is greater than the chemical potential gradient flux
 $J_{{\rm{chem}}}^{{\rm{Cu}}}$
during L–S EM. In addition, the diffusivity of Cu atoms in liquid is two orders of magnitude faster than that in solid due to the low activation energy of self-diffusion in liquid.
Reference Cahoon4
This enables a small Z* to induce a large atomic flux
 $J_{total}^{{\rm{Cu}}}$
in Eq. (10), resulting in the more serious consumption of the cathode Cu during the L–S EM than during the S–S EM.
V. CONCLUSIONS
-
(1) During the S–S EM, the In atoms directionally migrate toward the cathode due to the back-stress induced by the preferential migration of the Sn atoms over the In atoms toward the anode, leading to the segregation of the Sn atoms at the anode while the In atoms at the cathode.
-
(2) During the L–S EM, the In atoms directionally migrate toward the anode due to the negative charge number (Z*) of In rather than the back-stress. The Z* of In in the Cu/Sn–52In/Cu interconnects is calculated to be −0.6.
-
(3) The polarity effect, evidenced by the IMCs growing continuously at the anode while becoming thinner at the cathode, is more significant during the L–S EM than the S–S EM. This is because not only the Cu atomic flux but also the In atomic flux is from the cathode to the anode during the L–S EM.
-
(4) The consumption of cathode Cu during both L–S EM and S–S EM follows a parabolic relationship with the EM time. However, the consumption rate of cathode Cu during the L–S EM is three orders of magnitude higher than that during the S–S EM, due to a significantly higher EM-induced flux
 $J_{{\rm{em}}}^{{\rm{Cu}}}$
in liquid in the former case.

ACKNOWLEDGMENTS
This work is supported by the National Natural Science Foundation of China under Grant Nos. 51475072 and 51171036, and the BL13W1 beam line of Shanghai Synchrotron Radiation Facility (SSRF).