INTRODUCTION
The ice sheet last glacial maximum (LGM), spanning approximately 26.5–19 ka, is the period of maximum global ice volume during the last glaciation (Clark et al., Reference Clark, Dyke, Shakun, Carlson, Clark, Wohlfarth, Mitrovica, Hostetler and McCabe2009). The LGM has been traditionally identified in global ice volume–influenced marine δ18O records (e.g., Shackleton, Reference Shackleton1977; Lisiecki and Raymo, Reference Lisiecki and Raymo2005). However, LGM ice extent may not relate well to individual ice lobes or alpine glacial volumes or ice margins, because the marine oxygen isotope record is primarily a reflection of global ice sheet volume. Instead, individual mountain ice systems reflect regional climatic influences on glacial mass balance related to ablation (melting) and accumulation (snowfall). Studying these smaller glacial systems can assist inference of regional climatic conditions not reflected in the global marine isotope record.
Most mountain glacial reconstructions rely primarily on the morphology and dating of moraines. However, these reconstructions may provide an incomplete view of the details of Marine Oxygen Isotope Stage 2 (MIS 2) climatic fluctuations and the glacial processes that characterized the period, let alone the corresponding climatic conditions. For example, as glacial margins advance, they overrun and recycle previously deposited sediments and landforms and reset the ice-marginal landscape, leaving a morphologic record of only the most recent and extensive advances (Kirkbride and Winkler, Reference Kirkbride and Winkler2012; Barr and Lovell, Reference Barr and Lovell2014; Chandler et al., Reference Chandler, Evans and Roberts2016). While detailed landform mapping can provide a strong basis for interpreting ice-margin processes (Evans and Benn, Reference Evans and Benn2004; Hubbard and Glasser, Reference Hubbard and Glasser2005; Bennett and Glasser, Reference Bennett and Glasser2009; Benn and Evans, Reference Benn and Evans2010), this is not possible for all areas. Additionally, age control for moraine sequences is commonly determined through cosmogenic radionuclide (CRN) exposure dating of clasts on the crest of the moraines (e.g., Licciardi and Pierce, Reference Licciardi and Pierce2008; Putnam et al., Reference Putnam, Schaefer, Denton, Barrell, Birkel, Andersen, Kaplan, Finkel, Schwartz and Doughty2013). The resultant chronology is thus limited to the final depositional event at the land surface, which may not record previous advances that are only preserved in buried stratigraphy (e.g., Shulmeister et al., Reference Shulmeister, Davies, Evans, Hyatt and Tovar2009, Reference Shulmeister, Thackray, Rieser, Hyatt, Rother, Smart and Evans2010).
Improved resolution of the timing and nature of glacial ice-margin positions can be obtained by combining geomorphologic mapping and age control with detailed studies of the sedimentology and stratigraphic architecture of glacial landforms in locations that offer well-exposed stratigraphic records (e.g., Spedding and Evans, Reference Spedding and Evans2002; Shulmeister et al., Reference Shulmeister, Davies, Evans, Hyatt and Tovar2009; Reinardy et al., Reference Reinardy, Leighton and Marx2013; Chandler et al., Reference Chandler, Evans and Roberts2016).
This study investigates the glacial stratigraphy of the South Fork Hoh River valley (SF Hoh), a formerly glaciated valley in the Olympic Mountains of northwestern Washington, USA (Fig. 1). The Olympic Mountains hosted extensive valley glaciers during several phases of Late Pleistocene glaciation (Thackray, Reference Thackray2001; Marshall, Reference Marshall2013; Staley, Reference Staley2015) and still maintain small glaciers in the headwater reaches of the major valleys. Today, the region experiences a humid climate influenced primarily by Pacific Ocean sea-surface temperature, which influences regional air temperature, precipitation, and wind patterns. Recently acquired LiDAR topographic data and detailed descriptions and dating of extensive stratigraphic exposures provide a detailed record of MIS 2 ice-marginal fluctuations in the SF Hoh.
(color online) The South Fork Hoh (SF Hoh) River valley and surrounding area. Exposures studied are labeled as sites A–J. Dashed lines indicate ice limits relevant to this study as mapped by Thackray (Reference Thackray2001). Elevations and hillshade derived from 30 m National Elevation Dataset Digital Elevation Model data (USGS, 2009) for main map and inset of northwestern Olympic Peninsula, Washington. The Hoh River and SF Hoh River and nearby towns referenced in the text are labeled. The approximate maximum extent of the Puget Lobe of the Cordilleran Ice Sheet is denoted by a dashed border, and MIS 4 and MIS 3 ice extents in the Hoh River valley and Queets River valley are also labeled.

This study describes the sedimentology and stratigraphic architecture of glacial sequences exposed in 10 large outcrop exposures (<30–150 m long and 10–30 m high) created by riverbank erosion to establish ice-margin positions and constrain the process and chronology of glacial advance and retreat of the SF Hoh valley glacier. Our findings document a dynamic ice margin from just before to immediately following the LGM, characterized by multiple periods of retreat and readvance.
Background and previous work
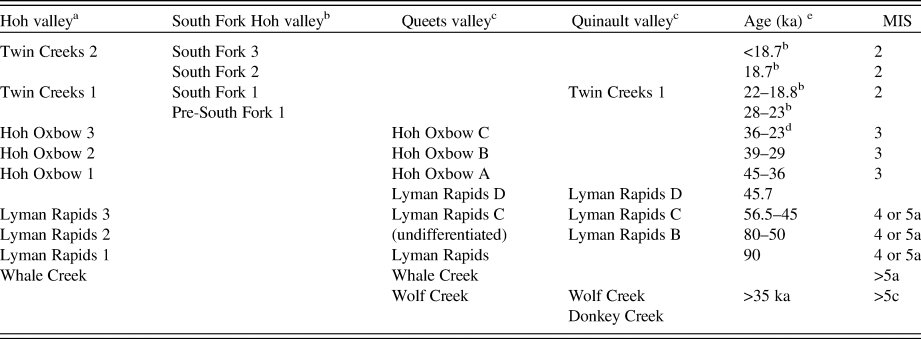
In general, mountain glacial records in the western United States are characterized by greatest Late Pleistocene ice extent during MIS 2. In contrast, the greatest Late Pleistocene ice volumes were during and before MIS 3 in the Olympic Mountains, and MIS 2 ice limits are markedly in upvalley positions. Here and in subsequent discussion, we use the formalized term Late Pleistocene to describe the period 126–12 ka, as per Head et al. (Reference Head, Aubry, Walker, Miller and Pratt2017). Thackray (Reference Thackray2001) documented major valley glacier advances on the western Olympic Peninsula through geomorphologic mapping, stratigraphic interpretation, and radiocarbon geochronology. Named moraine-outwash terrace units and inferred ice advances include Wolf Creek and Whale Creek, both of which geomorphologically and/or stratigraphically predate a prominent last interglacial shoreline and platform and therefore are older than MIS 5a. The Lyman Rapids moraine-outwash sequences are geomorphologically and stratigraphically younger than the last interglacial features and predate sediments dated to approximately 50 14C ka, and thus date to MIS 5, 4, and/or early MIS 3. The Hoh Oxbow (late MIS 3) and Twin Creeks (MIS 2) advances are dated with radiocarbon, and each was further differentiated into sequences of individual advances (Table 1). The pre–MIS 2 Late Pleistocene advances, within the Lyman Rapids and Hoh Oxbow sequences, were more extensive than the Twin Creeks I advance described here, which most closely correlates with the LGM (26–19 ka).
Glacial positions of the western Olympic Peninsula and associated ages compiled from previous work by Thackray (Reference Thackray2001), Marshall (Reference Marshall2013), Staley (Reference Staley2015), and Wyshnytzky et al. (Reference Wyshnytzky, Rittenour, Summa Nelson and Thackray2015).

a Named ice positions from Thackray (Reference Thackray2001).
b Wyshnytzky et al. (Reference Wyshnytzky, Rittenour, Summa Nelson and Thackray2015) and this study.
c Thackray (Reference Thackray2001); Staley (Reference Staley2015).
d Age of the Hoh Oxbow 3 ice position updated by Marshall (Reference Marshall2013), previously inferred to be 28–23 ka by Thackray (Reference Thackray2001).
e Age control by Thackray (Reference Thackray2001), except where noted.
Pollen assemblages from peat sequences exposed in the sea cliffs at Kalaloch (Fig. 1) and elsewhere in the area suggest mean July temperatures were 11°C–14°C between 20.5 and >48 cal ka BP (Florer, Reference Florer1972; Heusser, Reference Heusser1972, Reference Heusser1974; all 14C ages calibrated using Reimer et al. [Reference Reimer, Bard, Bayliss, Beck, Blackwell, Bronk and Buck2013]). Today, the mean July temperature is approximately 16°C (1931–2005; WRCC, 2012), implying relatively modest cooling of 2°C–5°C during MIS 2 and MIS 3. That estimate is generally consistent with local LGM cooling of at least 4°C estimated from fossil beetles (Ashworth, A., personal communication, 2019). The pollen assemblages suggest a transition from temperate rainforest to alpine tundra vegetation near sea level at 27.3 cal ka BP that lasted until 19.3 cal ka BP (Florer, Reference Florer1972) and cold temperatures between 22.7 and 11.5 cal ka BP (Heusser, Reference Heusser1974). This cold interval was punctuated by two periods of warmer temperatures, at approximately 25.8–22.8 and 21.8–21.1 cal ka BP (Heusser, Reference Heusser1974).
General correlation of the pollen-based temperature estimates with the glacial history of the Olympic Peninsula (Thackray, Reference Thackray2001) suggests that periods of maximum ice extent correspond with pre-LGM cool events but not with the periods of coldest temperatures. This suggests that variations in Pacific atmospheric moisture inflow may have been the dominant influence on glacial mass balance and ice extent of the Olympic Mountains (Thackray, Reference Thackray2001). Of significant note, the largest glacial advances in the Olympic Mountains able to be constrained by radiocarbon dating (the late MIS 3 Hoh Oxbow sequence) are roughly correlative with a Northern Hemisphere insolation maximum, when summer temperatures and ablation season melting are interpreted to have been greater than during MIS 2. These observations further suggest the importance of precipitation delivery in Late Pleistocene ice volumes in the Olympic Mountains.
The Olympic Peninsula MIS 2 mountain glacier record can be considered within the context of the MIS 2 history of the Cordilleran Ice Sheet and of mountain glaciers in the Cascade Range, incorporated into the broad period of extended ice known as the Fraser glaciation. The Cordilleran Ice Sheet originated in the Canadian Coast Ranges and Rocky Mountains and produced two major outlet lobes that filled the Puget Lowland and the Strait of Juan de Fuca, which lie to the east and north of the Olympic Peninsula, respectively. Following a brief warm period termed the Port Moody interstadial, dated to about 22.5–22.2 cal ka BP in southwest British Columbia (Hicock et al., Reference Hicock, Hobson and Armstrong1982), the ice sheet advanced south of the international border and into the Puget Lowland. The MIS 2 advance of the Puget Lobe, termed the Vashon stade, is well documented by a radiocarbon chronology developed by Porter and Swanson (Reference Porter and Swanson1998). They determined that the Puget Lobe advanced rapidly southward into the Puget Lowland (135 m/yr), reaching its terminus at approximately 17.0 cal ka BP or later (Borden and Troost, Reference Borden and Troost2001), where it stabilized for a short period of time (~100 yr) before rapidly retreating. The ice sheet readvanced during late glacial time (after approximately 14 cal ka BP) into the northern Puget Lowland during the Sumas Stade, which may have lasted until 11.2 ka (Clark and Clague, Reference Clark and Claguein press). Mountain glaciers in the western North Cascade Range, east of the Puget Lowland, advanced during the Evans Creek stade of the Fraser glaciation, with two advances dated to 30.3 and 19.5 cal ka BP (Riedel et al., Reference Riedel, Clague and Ward2010). Those two advances were separated by a period of recession, dated to approximately 24.9 cal ka BP.
Study area
The Olympic Mountains on the Olympic Peninsula of Washington lie on the northwestern edge of the contiguous United States (Fig. 1). The Olympic Peninsula is bound by the Puget Lowland to the east, the Pacific Ocean to the west, the Strait of Juan de Fuca to the north, and the Chehalis River valley to the south. The western Olympic Peninsula has a maritime climate dominated by the influence of westerly atmospheric flow and Pacific Ocean sea-surface temperature and atmospheric pressure variability. Southwesterly and westerly winds deliver peak precipitation in the fall and winter, whereas northwesterly and westerly winds influence a summer dry season (Spicer, Reference Spicer1986). The mean annual precipitation in Forks, Washington, is approximately 3 m/yr (Station: Forks 1 E, 1931–2005; WRCC, 2012). These humid maritime conditions support a temperate rainforest in the western Olympic Peninsula. The Olympic Mountains rise higher than 2400 m (Mount Olympus), with precipitation in the mountains reaching as high as 5 m/yr (LaChapelle, Reference LaChapelle1959, Reference LaChapelle1960; Spicer, Reference Spicer1986).
The high peaks of the Olympic Mountains host 184 modern glaciers (Riedel et al., Reference Riedel, Wilson, Baccus, Larrabee, Fudge and Fountain2015). Notable glaciers include the extensively monitored Blue Glacier (e.g., Conway et al., Reference Conway, Rasmussen and Marshall1999; Rasmussen et al., Reference Rasmussen, Conway and Hayes2000), which is the largest in volume (0.016 km3), and the Hoh Glacier, which is the longest (4.93 km). Both glaciers lie in the headwaters of the Hoh River (Fig. 1). During Pleistocene glaciations, valley glaciers extended to the coastal lowlands and, in some cases, beyond the modern shoreline (Thackray, Reference Thackray2001).
Near the downstream end of our study area, the SF Hoh River (approximately 30 km long, 140 km2 catchment area) joins the main Hoh River (approximately 90 km long, 770 km2 catchment area), which flows west-southwest before entering the Pacific Ocean (Fig. 1). Elevations in the SF Hoh catchment range from 125 to 2430 m above sea level (m asl), with Mount Olympus as the high point. Estimated equilibrium line altitudes during the LGM were approximately 640 m asl for the Hoh River and approximately 650 m asl for the SF Hoh (Thackray, Reference Thackray1996). In comparison, the modern terminus of Blue Glacier reaches approximately 1340 m asl and had an equilibrium line altitude of 1700 m in 1997 (Conway et al., Reference Conway, Rasmussen and Marshall1999). Several times during the last 100 ka glacial period, ice from the Hoh and SF Hoh merged and extended toward the coast (Thackray, Reference Thackray1996, Reference Thackray2008).
METHODS
This study used field and laboratory methods to develop a detailed chronostratigraphy of ice advance and retreat in the SF Hoh. Geomorphologic mapping of an approximately 5 km reach of the valley was accomplished with LiDAR data and satellite imagery. Field research included description of the stratigraphic architecture and sedimentologic composition of 10 river cutbank exposures along the SF Hoh (sites A–J) lettered from downvalley to upvalley (Fig. 1). Outcrop exposures ranged from <30 to >150 m in length and <10 to >30 m in height (Fig. 1). Radiocarbon and optically stimulated luminescence (OSL) dating provide chronologic constraints on individual packages within the sedimentary exposures and provide age control of stratigraphic sequences associated with ice-marginal positions.
Geomorphologic mapping was conducted through assessment of topographic maps (USGS, 2011a, 2011b), stereo-paired aerial photographs (1:44,000 and 1:12,000), and 1-m-resolution bare-earth LiDAR data (PSLC, 2013). Dense temperate rainforest cover precluded detailed landform delineation in the field. The map extent was chosen based on location of field sites and primarily focuses on Pleistocene glacial landforms in the map area (i.e., moraines and outwash terraces; Figs. 1 and 2).
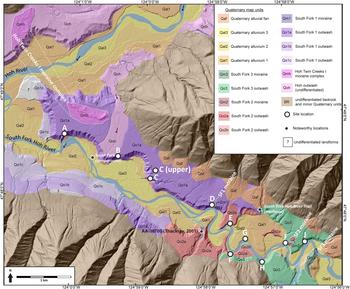
(color online) Geomorphologic map of the South Fork Hoh (SF Hoh) River valley. Exposure sites are labeled A–J. Also shown is the Twin Creeks I moraine complex in the Hoh valley. The SF Hoh valley contains three moraines that represent stable ice positions during MIS 2. Underlying hillshade derived from 1-m-resolution LiDAR data (PSLC, 2013).

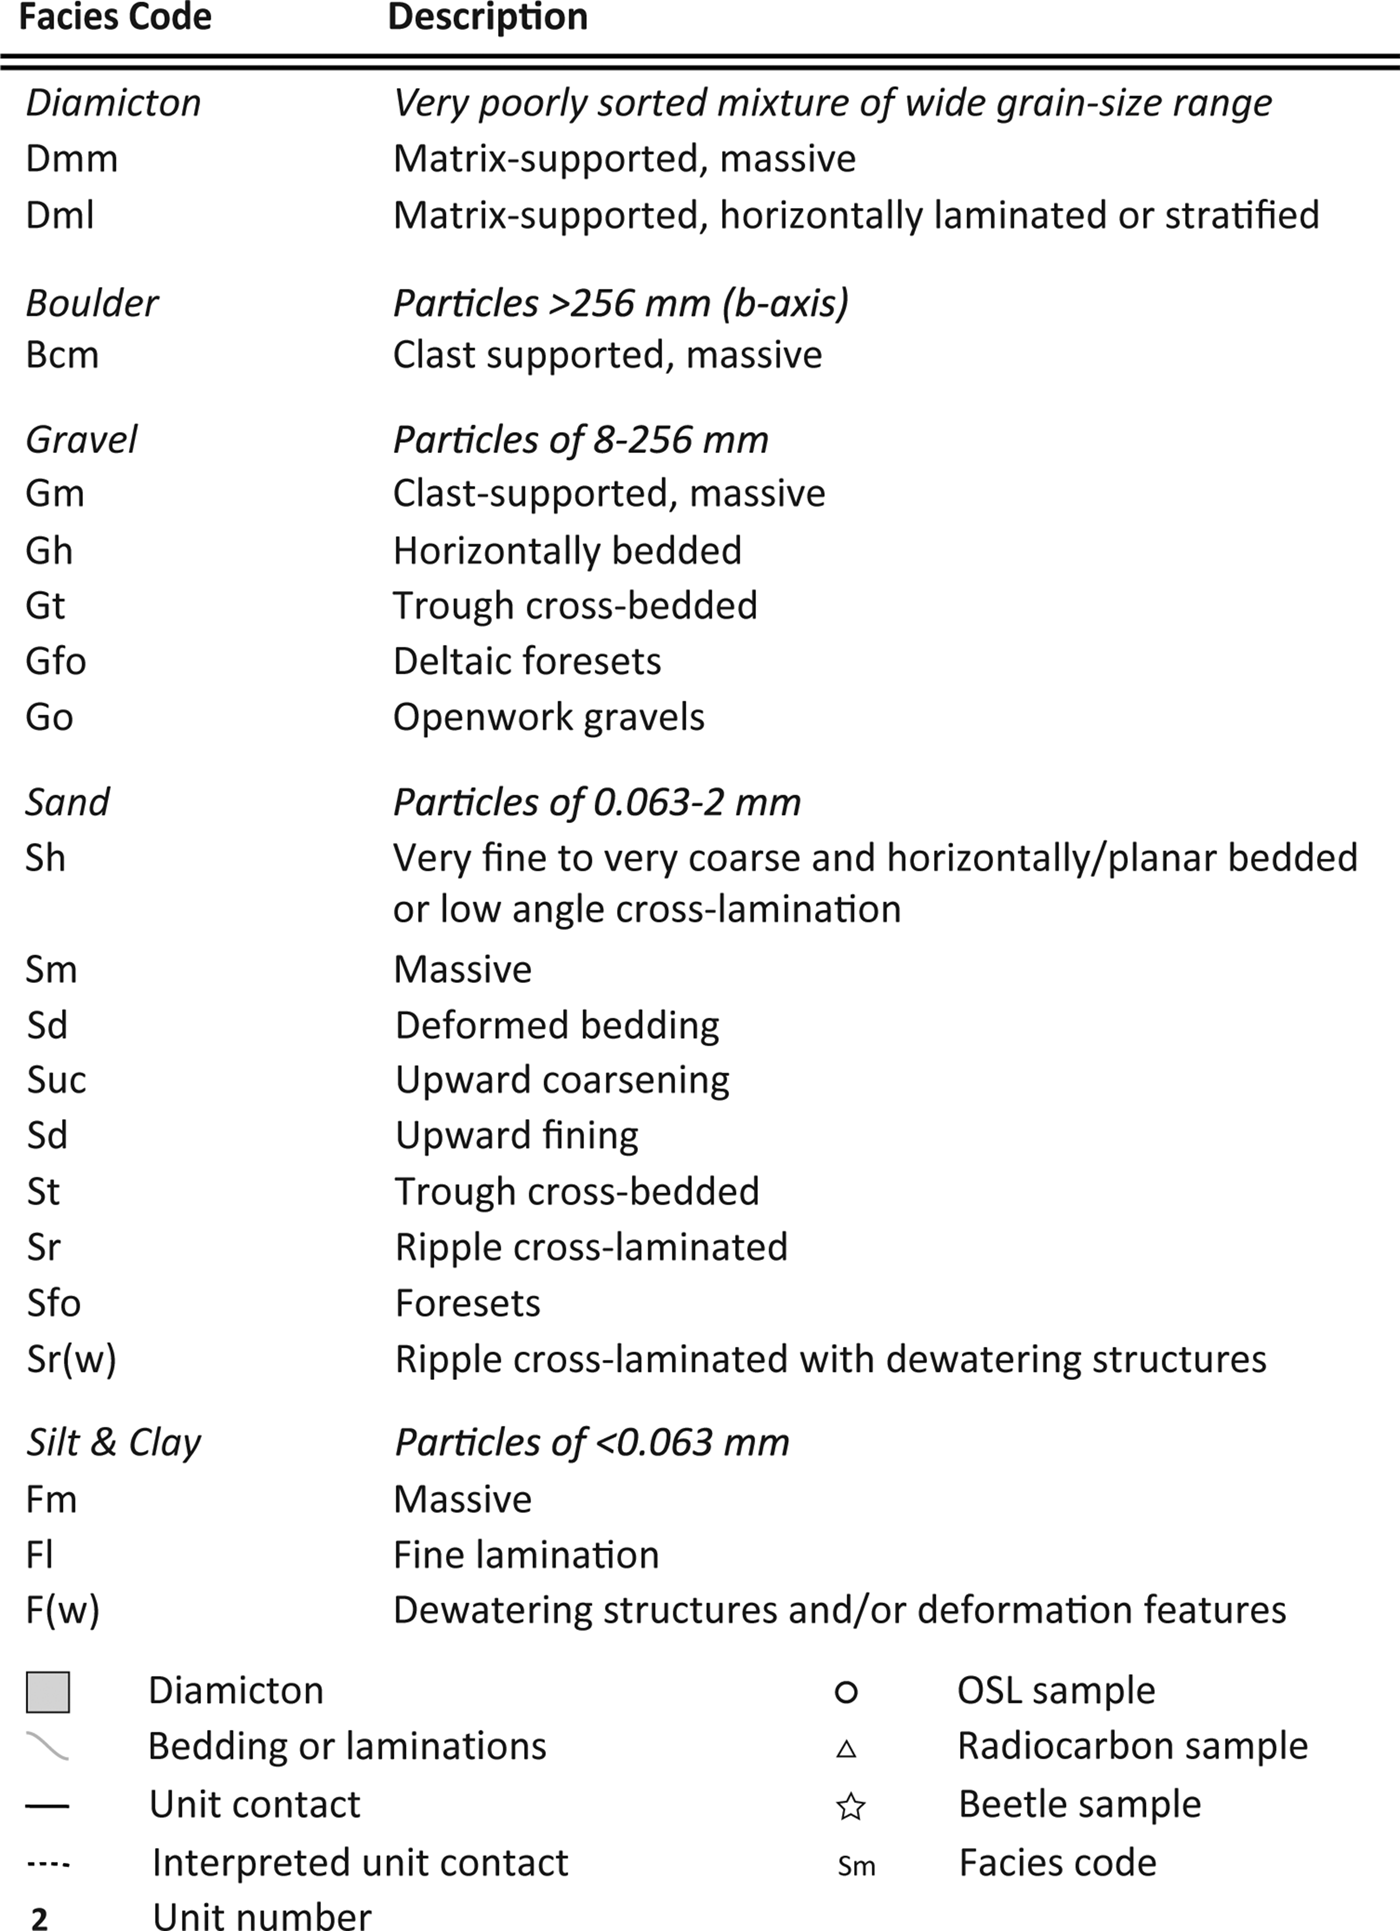
Exposures of Pleistocene sediment along river cutbanks in meander bends of the SF Hoh were chosen for detailed study due to accessibility, outcrop size, and extent of non-obstructed exposure of sediments. Outcrops were logged and detailed sedimentologic and stratigraphic measurements were made, including descriptions of unit thickness and geometry, sedimentary texture and structures, bedding, grain size, fabric, and color. These descriptions incorporated multiple scales of analysis for the most robust interpretations of transport and depositional processes and to provide information on the extent and sequence of ice fluctuations in the valleys (e.g., Benn, Reference Benn1992; Benn and Ballantyne, Reference Benn and Ballantyne1993, Reference Benn and Ballantyne1994; Evans and Benn, Reference Evans and Benn2004; Lukas, Reference Lukas2005, Reference Lukas2012; Owen et al., Reference Owen, Thackray, Anderson, Briner, Kaufman, Roe, Pfeffer and Yi2009; Shulmeister et al., Reference Shulmeister, Davies, Evans, Hyatt and Tovar2009). Facies were interpreted in the context of ice-margin dynamics and their processes of formation. Figure 3 lists facies codes used in unit descriptions, modified from Eyles et al. (Reference Eyles, Eyles and Miall1983). Due to the large along-valley length and the height of the outcrops, photographs were stitched together to aid in production of outcrop-scale stratigraphic logs.
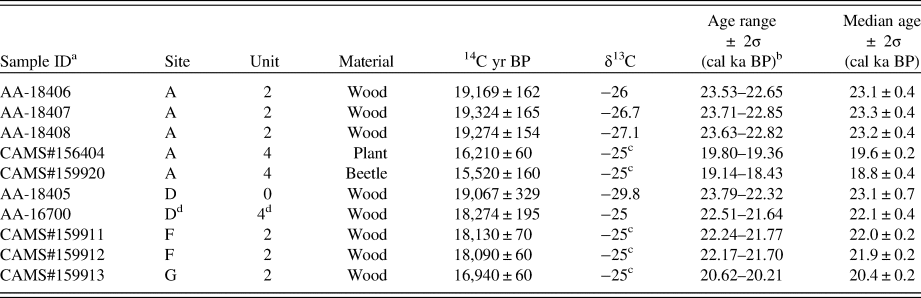
Samples for radiocarbon dating were collected where organic materials associated with glacial deposits were present. Five samples of wood, plant material, and beetle parts were analyzed at the Center for Accelerator Mass Spectrometry (CAMS) at Lawrence Livermore National Laboratory. Four additional radiocarbon samples (three from site A and one from site D) were previously collected by Thackray (Reference Thackray1996) and analyzed at the University of Arizona AMS facility. The IntCal13 calibration data set was used for calibration (Reimer et al., Reference Reimer, Bard, Bayliss, Beck, Blackwell, Bronk and Buck2013), and ages include 2σ errors and are reported as both the calibrated age range and median value of the calibrated age range (cal ka BP) in Table 2. For simplicity and easier comparison with the OSL ages, we reference the median age and 2σ calibrated age range in the text discussions.
Radiocarbon age constraint for South Fork Hoh valley exposures.

a All CAMS samples new to this study. All AA samples from Thackray (Reference Thackray2001).
b All 14C calibration in IntCal13 (Reimer et al., Reference Reimer, Bard, Bayliss, Beck, Blackwell, Bronk and Buck2013).
c Assumed δ13C value.
d Across the river from site D (Thackray, Reference Thackray2001).
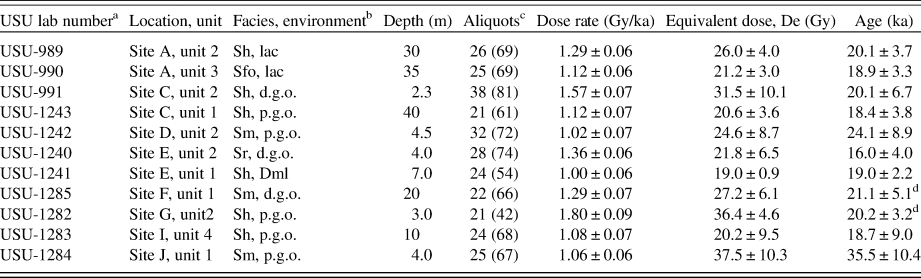
Eleven samples for luminescence dating were obtained from sandy strata and analyzed at the Utah State University Luminescence Laboratory. Optical measurements followed the single-aliquot regenerative dose method (Murray and Wintle, Reference Murray and Wintle2000). The dose rate was determined using the concentrations of K, Rb, Th, and U in representative samples for each OSL sample using inductively coupled plasma mass spectrometry (ICP-MS) and inductively coupled plasma atomic emission spectroscopy (ICP-AES), and moisture content was measured in the laboratory. Cosmic contribution was calculated from site location and burial depth (Prescott and Hutton, Reference Prescott and Hutton1994). Ages were calculated using either the central age model (USU-989, 990, 2143) or the minimum age model (USU-991, 1240–1242, 1282–1285) (Galbraith and Roberts, Reference Galbraith and Roberts2012), depending on parameters of skew and overdispersion in equivalent dose data. All OSL ages are reported with a 2σ standard error. Wyshnytzky et al. (Reference Wyshnytzky, Rittenour, Summa Nelson and Thackray2015) present specific details on OSL procedures and broadly highlight the ability to date these glacial sediments with OSL techniques.
RESULTS AND INTERPRETATIONS
Geomorphology
The lower SF Hoh River valley contains extensive outwash terraces and evidence for three ice positions marked by moraines and ice-proximal sediments. These ice-marginal positions are hereafter referred to as South Fork 1–3 (SF 1–3), from oldest to youngest (Fig. 2). The SF 1 and SF 3 moraines were previously mapped by Thackray (Reference Thackray2001) as the Twin Creeks I and Twin Creeks II end moraines, respectively. The SF 2 position had not been previously identified but is documented here through geomorphologic and stratigraphic evidence.
The SF 1–3 moraine map units (Qm1, Qm2, and Qm3) form low ridges cut by the modern channel (Fig. 2) and are associated with sedimentologic and stratigraphic differences. All moraines appear to be end moraines that at least partially spanned the valley and are in areas where the alluvial corridor of the modern river is generally narrowest. The SF 1 moraine is composed of a small arcuate ridge that is approximately 165 m long and 50 m wide and is positioned approximately 12 m above its outwash terrace, which begins in this position. On the north side of the valley, the SF 2 moraine has been truncated by the river and a meltwater channel and is composed of three discontinuous segments that before dissection would have been approximately 460 m long and 110 m wide, and it rises 9 m above its associated outwash terrace. The SF 3 moraine is the best preserved of the three and is composed of a well-defined ridge crest on the southern side of the valley that is approximately 610 m long and 150 m wide and rises to 20 m above the upvalley terrace and 42 m above the downstream terrace (Fig. 2). The associated outwash surfaces were subdivided based on surface elevation, geomorphologic character, stratigraphic association, and genetic association with the related ice-margin positions.
Sedimentology, stratigraphic descriptions, and interpretations
The facies and stratigraphic architecture of the 10 river cutbank exposures are described in the upvalley direction, from site A to site J (Figs. 1 and 2). The study outcrops have been characterized into numbered depositional units that can be differentiated based on facies assemblages, grain size, sorting, and other bedding characteristics. In most cases, the unit contacts are sharp and clear. More detailed information on unit descriptions can be found in the Supplementary Material, and facies photographs can be found in Wyshnytzky (2013). Tables 2 and 3 present radiocarbon and OSL ages.
Luminescence age constraint for South Fork Hoh valley exposures from Wyshnytzky et al. (Reference Wyshnytzky, Rittenour, Summa Nelson and Thackray2015). Age constraint exists for all sites, except sites B and H. More detailed information about optically stimulated luminescence ages can be found in Wyshnytzky et al. (Reference Wyshnytzky, Rittenour, Summa Nelson and Thackray2015).

a Quartz sand was dated for all samples. USU, Utah State University.
b See Figure 3 for facies codes. Abbreviations for depositional environments include: Dml, stratified diamicton; d.g.o., ice-distal gravel outwash; lac, lacustrine; p.g.o., ice-proximal glacial outwash.
c Number of aliquots accepted with number of aliquots analyzed in parentheses.
d Age updated from what was presented in Wyshnytzky et al. (Reference Wyshnytzky, Rittenour, Summa Nelson and Thackray2015).
Facies codes and symbology used in exposure logs for South Fork Hoh valley. Facies codes are modified from Eyles et al. (Reference Eyles, Eyles and Miall1983).

Diamicton character was documented in careful detail to elucidate details of depositional processes. Diamicton deposited in water-rich glacial systems can represent rapid sedimentation near a glacier, similar to subglacial till, but lacks evidence of fissility expected of a true subglacial till. The term “till” is an interpretation reserved for subglacially deposited, fissile, non–water sorted diamicton (Evans et al., Reference Evans, Phillips, Hiemstra and Auton2006) and is used in this paper as an interpretation. Stratified (as opposed to massive) diamictons are typically recognizable at the outcrop scale but retain their poorly sorted nature and suggest the influence of water at or immediately following deposition. Stratification is especially important in differentiating water-lain diamicton from subglacial till in the humid glacial environment of the Olympic Mountains, where significant influence of meltwater on sedimentary facies is expected. Stratified diamictons generally are interpreted to reflect ice-proximal deposition within a few hundreds of meters of the ice margin (Evans et al., Reference Evans, Shulmeister and Hyatt2010).
Proximal and distal outwash units are differentiated primarily on the basis of clast size, clast shape, and sorting. Proximal outwash contains larger clasts that are more poorly sorted, whereas distal outwash is sandier and contains finer, better-sorted clasts.
Site A
Site A exposes diamicton (unit 1) overlain by sediments of several lacustrine facies (units 2 and 3), capped by outwash gravel (units 4–6) (Fig. 4). Radiocarbon ages from lacustrine unit 2 range from 23.1 ± 0.4 to 23.3 ± 0.4 cal ka BP, and an OSL age from the same unit is 20.1 ± 3.7 ka. The OSL age of lacustrine unit 3 is 18.9 ± 3.3 ka, and radiocarbon ages from the overlying gravel (unit 4) are 18.8 ± 0.4 and 19.6 ± 0.2 cal ka BP (Tables 2 and 3).
(color online) Stratigraphic logs and photographs of the site A, C, and D exposures. Facies codes detailed in Figure 3.

The fissile, compacted basal diamicton is interpreted to represent a subglacial melt-out till, and the two overlying units are interpreted as lacustrine and deltaic sediments that formed in ponded water, likely due to downvalley damming of the SF Hoh valley by ice or a moraine in the Hoh valley from the Hoh Twin Creeks I moraine complex (Fig. 3). These were then overlain by glacial outwash. Preliminary analysis of beetle fragments from a silty bed within the outwash indicates a summer temperature regime similar to modern (Ashworth, A., personal communication, 2019).
Site B
Site B exposes a single coarsening-upward pebble–cobble gravel unit (>5 m) interpreted as having been deposited as ice-proximal outwash.
Site C
Site C is an exposure of two gravel units separated by a sharp and clear contact (Fig. 4). The deposits range in age from 18.4 ± 3.8 (unit 1) to 20.1 ± 6.7 ka (unit 2) based on OSL ages (Table 3). These two units are interpreted to represent ice-proximal (unit 1, lower) and ice-distal outwash (unit 2, upper).
Site D
Site D is composed of outwash gravel (units 1–3) overlain by a stratified diamicton (unit 4) and capped by pebble–cobble gravel (unit 5) (Fig. 4). Radiocarbon dating of lacustrine sediment underlying the current exposure (here labeled unit 0 to keep stratigraphic order) produced an age of 23.1 ± 0.7 cal ka BP (Thackray, Reference Thackray2001). A radiocarbon sample from diamicton exposed directly across the SF Hoh valley, and interpreted by Thackray (Reference Thackray1996, Reference Thackray2001) to correlate with the diamicton unit at this exposure (unit 4), produced an age of 22.1 ± 0.4 cal ka BP (Table 2). This unit is interpreted as sediment deposited subaqueously at the ice front. OSL dating produced an age of 24.1 ± 8.9 ka for the outwash gravel stratigraphically between these radiocarbon ages (unit 2) (Table 3); however, the slight overestimation of this sample might be due to incomplete solar resetting (see discussion in Wyshnytzky et al. [Reference Wyshnytzky, Rittenour, Summa Nelson and Thackray2015]).
Site E
Site E exposes a stratified diamicton interpreted as ice-proximal outwash (unit 1) overlain by sand and gravel outwash (unit 2) (Fig. 5). OSL dating constrains the depositional ages of the diamicton (unit 1) to 19.0 ± 2.2 ka and the overlying outwash (unit 2) to 16.0 ± 4.0 ka (Table 3).
(color online) Stratigraphic logs and photographs of the site E and F exposures. Facies codes detailed in Figure 3.

Site F
Site F contains three outwash gravel packages (units 1–3), each less than 5 m thick, with gravel unit 2 much coarser and less sorted than the upper and lower units. The depositional age of the basal outwash (unit 1) is constrained by OSL to 21.1 ± 5.1 ka (Table 3). Radiocarbon ages from buried logs incorporated into the middle gravel (unit 2) constrain its depositional age to after 22.0 ± 0.2 to 21.9 ± 0.2 cal ka BP (Table 2). These three outwash units are interpreted to record a sequence of ice retreat, advance, and retreat (Fig. 5).
Site G
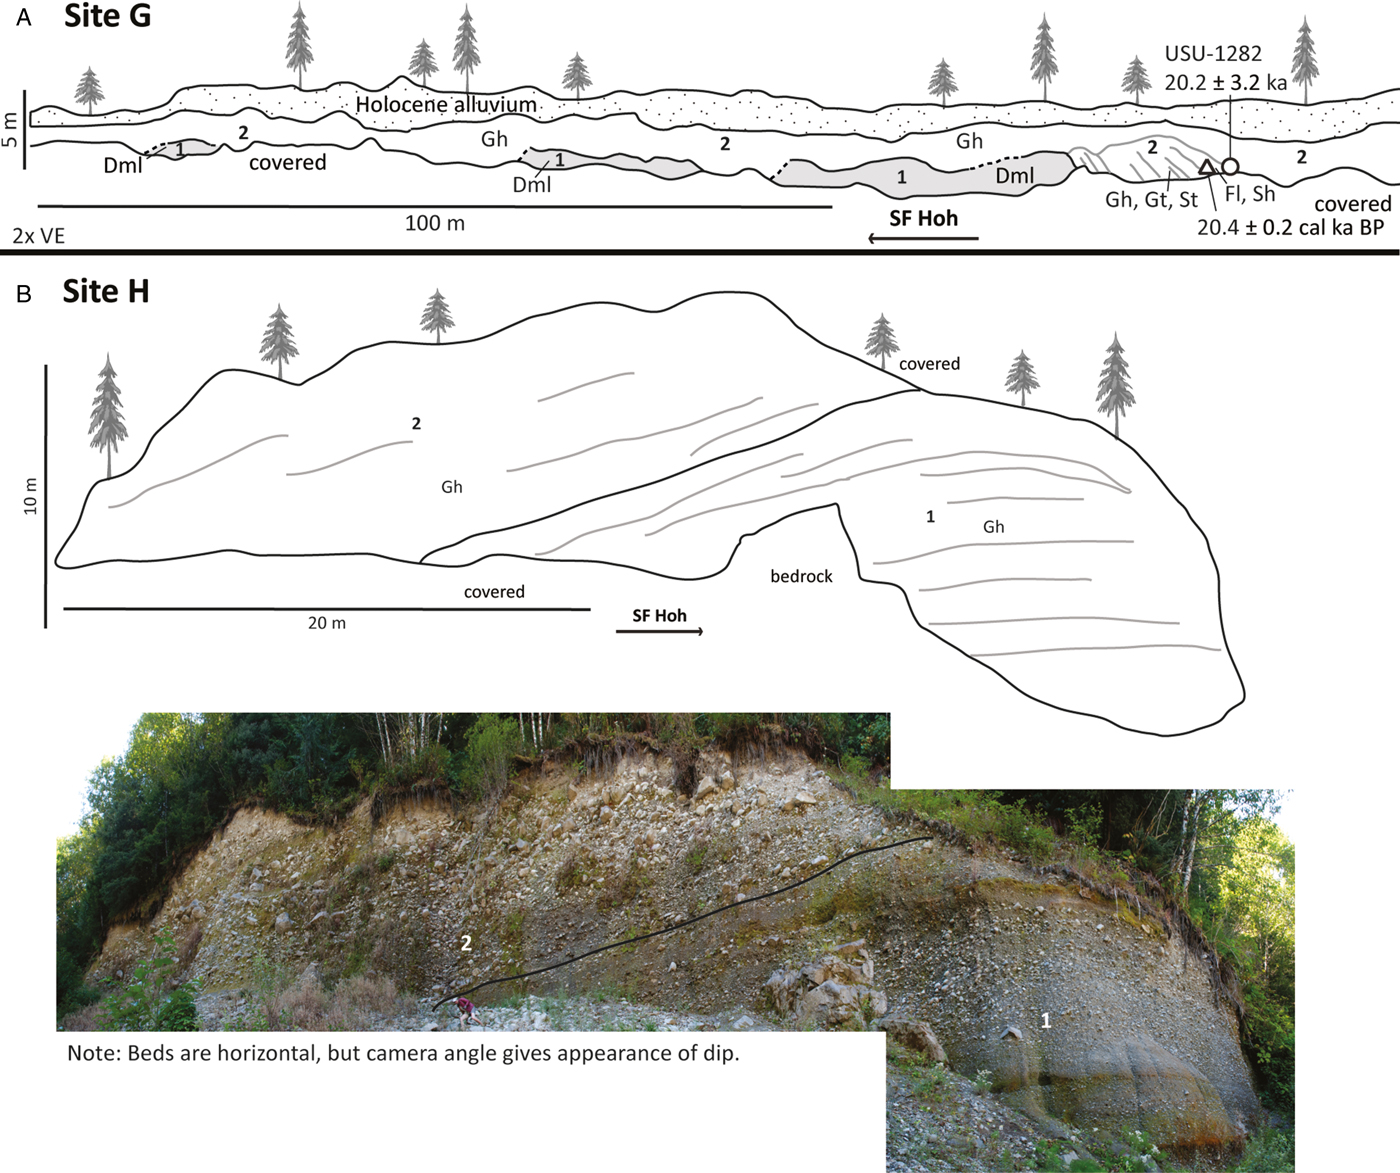
Site G contains a weakly stratified diamicton (unit 1), overlain by coarse gravel (unit 2) (Fig. 6). Radiocarbon and OSL ages from the outwash (unit 2) constrain its deposition to 20.4 ± 0.2 cal ka BP and 20.2 ± 3.2 ka, respectively (Tables 2 and 3). Unit 1 is interpreted to represent deposition at the ice margin, and the sequence represents ice advance and retreat.
(color online) Stratigraphic logs and photographs of the site G and H exposures. VE = vertical exaggeration. Facies codes detailed in Figure 3.

Site H
Site H contains a basal pebble gravel unit overlain by a coarser gravel unit (Fig. 6). These units are interpreted as a sequence of more ice-distal outwash (unit 1) followed by an advance showing ice-proximal outwash (unit 2)
Site I
Site I exposes a compact diamicton (unit 1) overlain by coarse gravel (unit 2), a weakly stratified diamicton (unit 3), and additional finer gravel units (units 4 and 5) (Fig. 7). An OSL age from outwash (unit 4) suggests a depositional age to 18.7 ± 9.0 ka (Table 3). The diamicton in unit 1 is interpreted as a subglacial melt-out till, and the weakly stratified diamicton in unit 3 is interpreted to represent an ice readvance to or across the site in an ice-proximal or water-deposited setting. The gravel units are interpreted to be glacial outwash.
(color online) Stratigraphic logs and photographs of the site I and J exposures. Facies codes detailed in Figure 3.

Site J
Site J is composed of gravels (units 1 and 3) separated by localized ponded sediments (unit 2) (Fig. 7). An OSL age of 35.5 ± 10.4 ka from the basal gravel (unit 1) is considered unreliable due to partial bleaching (incomplete solar resetting) in a massive sand lens (Wyshnytzky et al., Reference Wyshnytzky, Rittenour, Summa Nelson and Thackray2015). Unit 2 is interpreted to represent proglacial glaciolacustrine deposition, and unit 3 is interpreted as outwash representing the final ice retreat from the study area.
DISCUSSION
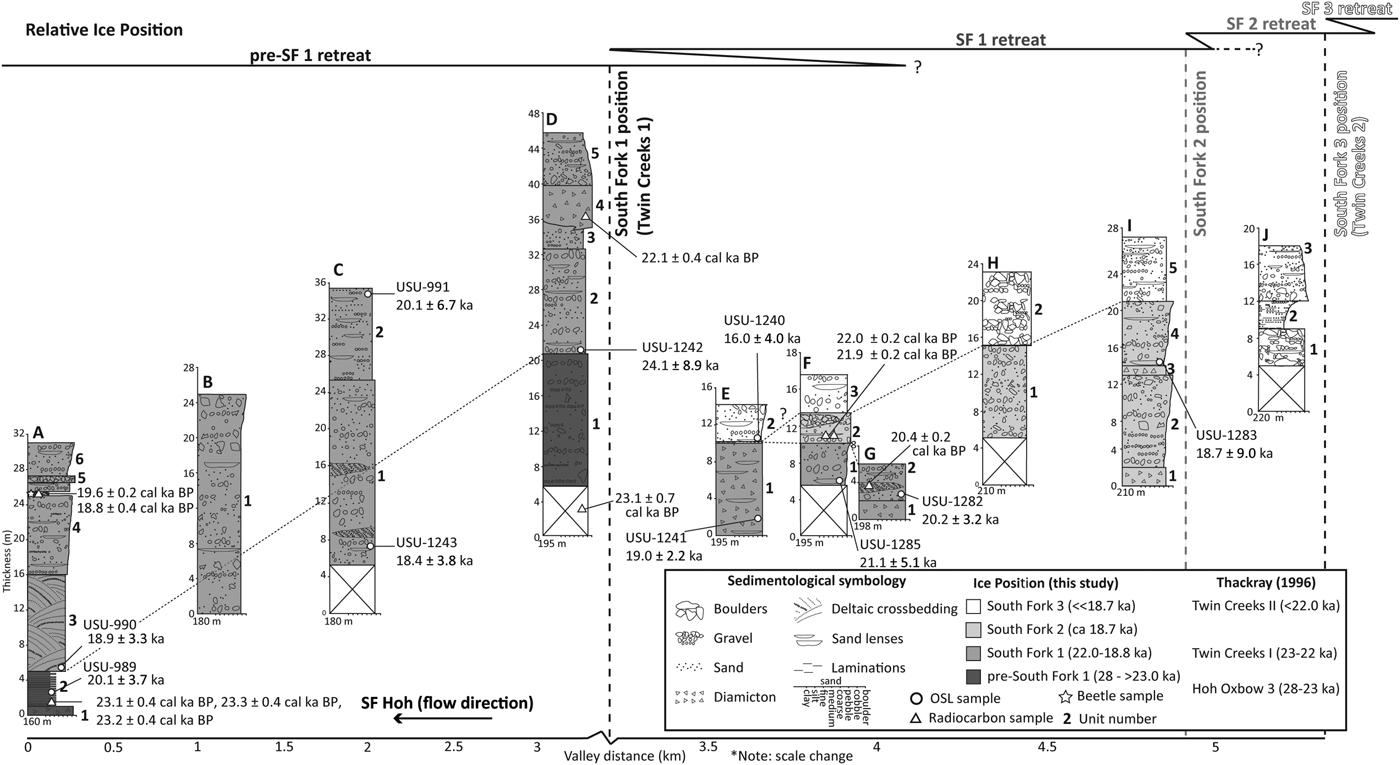
The relationships among stratigraphic exposures in the SF Hoh River valley are summarized, with stratigraphic columns plotted by elevation and distance along a downstream profile (Fig. 8). These exposures are interpreted to preserve deposits associated with four ice-marginal positions, referred to here as the pre–SF 1 position, and the SF 1, SF 2, and SF 3 positions in the study area (Figs. 2 and 8). SF 2 is an ice-marginal position not previously recognized but is interpreted here as an ice-front position primarily based on glacial depositional sequences and LiDAR evidence for a partially preserved moraine-like landform at this position in the valley (Fig. 2).
Stratigraphic columns representative of all 10 South Fork Hoh (SF Hoh) River valley exposures. All sample locations are represented with the same symbols used in the stratigraphic panels. The base of each site is represented here at the elevation of the river at each site. Each individual stratigraphic column also shows thickness on the y-axis. The color designation refers to the favored interpretation for correlation to each ice position. The upper lines depict the history of ice positions, spanning pre–SF 1 retreat and the SF 3 ice position.

Pre–SF 1 sequence (~28–23 ka)
The Hoh Oxbow 3 position (Thackray, Reference Thackray2001; Fig. 1) is a moraine 8 km upvalley of the prominent landform formally named “Hoh Oxbow” in the middle reaches of the Hoh River, approximately 17 km downstream of its junction with the South Fork, and is the youngest moraine in the MIS 3 ice advance sequence. OSL dating by Marshall (Reference Marshall2013) indicates that the Hoh Oxbow ice-marginal sequence dates to 40–30 ka, rather than 34–23 ka as originally inferred by Thackray (Reference Thackray2001, Reference Thackray2008) in part from basal radiocarbon ages of the lacustrine facies at site A. Sites A and D contain sediment interpreted to have been deposited following retreat from a pre–SF 1 position (Fig. 8). The subglacial melt-out till at site A (unit 1) suggests that the ice front was downvalley of this exposure and that the South Fork Hoh glacier was confluent with the main Hoh Valley glacier at the time of its emplacement. It is possible that the glacier retreated farther upvalley in the SF Hoh valley than in the Hoh valley, forming an ice-dammed lake. The deposits overlying the till at site A (units 2 and 3) indicate a glaciolacustrine setting transitioning from deeper-water conditions to a prograding delta front in shallow water. Site D exposes basal outwash (unit 1) that we interpret to represent deposition during upvalley ice retreat from the pre–SF 1 position, based on stratigraphic relationships and chronology (Fig. 8). Other sedimentary packages related to retreat from the pre–SF 1 position have not been identified.
Age control for the timing of retreat from the pre–SF 1 position is based on an OSL age from site A and four radiocarbon ages from sites A and D (see Fig. 8). Results indicate that lacustrine deposition at site A began by approximately 23 ka following retreat from the pre–SF 1 ice position due to damming in the main Hoh valley by either ice or sediment. The age constraints on the glaciolacustrine and deltaic sediments at site A are in stratigraphic order, but also within analytical uncertainty of each other, suggesting rapid deposition. Further support for lake formation during pre–SF 1 retreat comes from the stratigraphy from site D and a radiocarbon age of 23.1 ± 0.7 cal ka BP collected by Thackray (Reference Thackray2001) from basal clast-rich lacustrine sediment (unit 0) (Table 2). It is clear from geomorphologic evidence in the confluence area that the main Hoh valley glacier had also retreated upstream of the confluence following the formation of the Hoh Oxbow 3 moraine and before readvancing to the moraine correlative with the SF 1 moraine (Twin Creeks I moraine in Fig. 2). We therefore reinterpret the chronology at sites A and D to represent formation of a lake following retreat from a previously unrecognized pre–SF 1 ice-marginal position between the Hoh Oxbow 3 moraine and the mouth of the South Fork, rather than from the Hoh Oxbow 3 position, as originally suggested by Thackray (Reference Thackray2001). The proposed location of the pre–SF 1 ice-margin position is outside our study area. Future geomorphologic and stratigraphic work is needed to constrain the location of the pre–SF 1 ice position.
SF 1 ice-marginal sequence (22–18.8 ka)
The SF 1 ice-terminal sequence was previously mapped as the Twin Creeks I position by Thackray (Reference Thackray2001) based primarily on sediments exposed at site A and the mapped head of outwash near site D (Qo1a, Fig. 2). This study further supports the inference of this ice-marginal position through LiDAR data–derived mapping (Fig. 2) and more thoroughly described stratigraphy of now-larger outcrops (Fig. 8). The Twin Creeks I moraine in the main Hoh River valley lies approximately 600 m upvalley of the Hoh River–SF Hoh River confluence and within 1.3 km of site A. The coeval SF 1 moraine in the SF Hoh River valley lies approximately 3 km upvalley of site A (Fig. 2). Furthermore, the continuity of the Qo1a outwash terrace from site D, directly downvalley of the SF 1 moraine, to site A (Fig. 2) indicates that the upper outwash packages at these locations are correlative (Fig. 8).
The presence of the SF 1 moraine indicates that the SF Hoh outwash had joined the Hoh valley outwash, as represented by outwash units 4–6 at site A, which merge into a common outwash terrace at the confluence. At site D, the diamicton (unit 4) interfingering with underlying outwash (unit 3) represents ice-marginal sedimentation on top of outwash (units 2 and 3) and records readvance to the SF 1 position. The stratification of this diamicton suggests a proglacial or ice-contact environment, and therefore provides firm evidence for the proximity of the ice margin at this time. The coarsening-upward outwash sequences at site A (units 4–6) and site B (unit 1) may also be related to the advancing ice front, although the gravel at site B should be interpreted with caution due to lack of sedimentologic detail from a paucity of exposure. The relative elevations and gradient of the outwash surface (map unit Qo1a) (Fig. 2) from sites D to A also indicate that the upper outwash packages at these sites are correlated (Fig. 8).
Sediment recording the retreat from the SF 1 position also appears to be exposed in sites upvalley of the SF 1 moraine. The diamicton at site G (unit 1) is inferred to represent the upvalley limit of ice retreat from the pre–SF 1 position and subsequent SF 1 position, here showing sedimentation at the ice margin followed by outwash deposition (unit 2) during readvance. The ice front readvanced approximately 1 km from location G to the SF 1 position just upstream of site D (Figs. 2 and 8).
Other outwash packages (sites C, D, and F) and one diamicton unit (site E) are interpreted to mark a period of retreat from the SF 1 position (Fig. 8). The more distal outwash at site C (unit 2 [Fig. 4] and Qo1a [Fig. 2]) and fining-upward outwash at site D (unit 5 [Fig. 4] and Qo1a [Fig. 2]) suggest ice retreat. The thick (>10 m), stratified diamicton at site E (unit 1) suggests considerable time and meltwater flux to allow for the sediment to accumulate and water sorting to occur, perhaps suggesting accumulation while the ice front retreated upvalley.
We constrained the age of the SF 1 position to 22.0–18.8 ka based on age control from sites A and D–G (Fig. 8; Tables 2 and 3). The 22.1 ± 0.4 cal ka BP age (Thackray, Reference Thackray1996, Reference Thackray2001; Table 2) projected to unit 4 at site D (Fig. 4) provides a maximum age for the SF 1 ice position. Age control constraining the SF 1 position also comes from the 18.9 ± 3.3 ka OSL age of the deltaic (unit 3) (Table 3) and 19.6 ± 0.2 to 18.8 ± 0.4 cal ka BP outwash sediments (unit 4) (Table 2) at site A and coarsening-upward sequences that may be related to the advancing ice front.
The outwash at site G yields radiocarbon and OSL ages in close correspondence (20.4 ± 0.2 cal ka BP [Table 2] and 20.2 ± 3.2 ka [Table 3]), which correlate with the timing of advance recorded at site D. The 22.1 ± 0.4 cal ka BP age at site D (unit 4, Table 2) is slightly older than ages recorded at site G. This is expected for radiocarbon results, which provide a maximum age for deposition due to incorporation of plant material that was growing before sediment deposition.
SF 2 ice-marginal sequence (~18.7 ka)
A previously unidentified ice-marginal sequence, consisting of a moraine (Qm2) and outwash valley train (Qo2), has been mapped approximately 6.5 km upstream of the confluence of the Hoh and SF Hoh Rivers (Fig. 2). This SF 2 margin lies between the Twin Creeks I (SF 1) and Twin Creeks II (SF 3) moraines identified by Thackray (Reference Thackray2001) (Fig. 1). This ice-marginal position was initially recognized based on the stratigraphy of upvalley sites E–I (Fig. 8) and was later confirmed by landform mapping with newly available LiDAR data (Fig. 2).
Stratigraphic evidence for this advance comes from a compacted diamicton (melt-out till) at the base of site I (unit 1) and outwash packages from sites E (unit 2 and Qo2) (Fig. 2), F (unit 2), and H (unit 1) (Fig. 8). The overlying coarsening-upward outwash at site I (unit 2) is interpreted to represent retreat from the SF 2 position and readvance to near site I, as recorded by the overlying stratified diamicton unit (unit 3) representing ice-proximal or ice-contact deposition. This diamicton is overlain by outwash interpreted to represent retreat from the SF 2 position.
The radiocarbon ages from buried logs in unit 2 at site F (22.0 ± 0.2 to 21.9 ± 0.2 cal ka BP; Table 2) are older than the 18.7 ± 9.0 ka OSL age recorded at site I from a similar outwash unit interpreted to represent advance to the SF 2 ice position (unit 4) (Table 3). The radiocarbon ages are interpreted to provide maximum age constraint for the deposit. The 18.7 ± 9.0 ka OSL age at site I therefore provides the only reliable age constraint for the SF 2 period (Table 3), although the large error (9.0 ka) should be noted. As this outwash package was interpreted as having been deposited during a period of overall retreat, we infer that the SF 2 position stabilized before 18.7 ka.
SF 3 ice-marginal sequence (<18.7 ka)
The SF 3 ice-marginal position is marked by a moraine directly upvalley of site J (Fig. 3), which was mapped as the Twin Creeks II moraine by Thackray (Reference Thackray2001). Outwash terraces (mapped as Qo3 on Fig. 2) extend downvalley from and are graded to this moraine position.
No till or diamicton units were found in the stratigraphy to relate to deposition at this ice margin. However, the coarse basal boulder–gravel of site J (unit 1) was likely shed from the ice margin during advance to the SF 3 moraine immediately upvalley of this site (Figs. 2 and 8). The upper outwash unit at site H (unit 2 [Fig. 6] and Qo3a [Fig. 2]) additionally indicates a high-energy environment, here likely representing advance to the SF 3 position. The upper units at site F (unit 3 [Fig. 5] and Qo3b [Fig. 2]) and site I (unit 5 [Fig. 7] and Qo3a [Fig. 2]) also correspond to SF 3 outwash terraces in Figure 3. Unit 2 at site J is interpreted to represent local ponding, perhaps in an abandoned outwash channel (Fig. 7). The upper unit at site J (unit 3 [Fig. 7] and Qo3a [Fig. 2]) is interpreted to represent retreat from the SF 3 position.
Although there is no direct age control for these sediments, age control for the SF 2 positions constrains the timing of the SF 3 position to after 18.7 ka (Fig. 8). The upper outwash unit at site E (unit 2) may be connected with the SF 3 moraine. If so, the OSL age of 16.0 ± 4.0 ka (Table 3) provides a minimum age for the timing of this advance.
Glacial history of the SF Hoh valley
This study details the complexity of MIS 2 ice-marginal fluctuations in the SF Hoh from stratigraphic, geochronologic, and geomorphologic evidence. Results provide details of ice-marginal and proglacial sedimentation associated with three terminal positions (SF 1–3) and refine age control on four ice positions (pre–SF 1 through SF 3) (Figs. 2 and 8). In each case, the glacier is documented to have retreated <0.5 to 5 km upvalley before readvancing, showing that the SF 1–3 ice-marginal positions are not simple recessional positions. This study shows the importance of pairing detailed stratigraphic and LiDAR-based geomorphologic observations and analyses in glacial environments. This importance is highlighted by the discovery of the SF 2 ice position, which was not previously recognized from geomorphology alone. This research extends the findings of Thackray (Reference Thackray2001) by describing the sedimentology and stratigraphy of new sites and sites that have changed since that earlier work, improving mapping, and providing new OSL and radiocarbon ages.
Geomorphologic and stratigraphic relationships dictate that the pre–SF 1 ice position was occupied after the ice retreated from the Hoh Oxbow 3 moraine in the main Hoh valley (Thackray, Reference Thackray2001), which has been dated to 40–30 ka (Marshall, Reference Marshall2013). Radiocarbon and OSL ages of the oldest sediment in the SF Hoh valley constrain the occupation of the pre–SF 1 position to before 23 ka (Fig. 8), which agrees with retreat beginning before 22.7 cal ka BP, as inferred from bog records (Heusser, Reference Heusser1974). Retreat at least 5.5 km upvalley from this position was followed by approximately 0.9 km readvance to the SF 1 position by 22 ka and then retreat and readvance to or still stand at the SF 2 position between 22.0 and 18.8 ka, with the SF 3 ice-marginal position occupied shortly after 18.7 ka, following <0.5 km retreat.
The new data presented here are consistent with and considerably expand the mapping, stratigraphy, and chronology of Thackray (Reference Thackray2001). The four MIS 2 ice-terminal positions (or some combination of them) may also be recorded in other western Olympic Peninsula valleys, including the Queets River valley (Thackray, Reference Thackray2001; Marshall, Reference Marshall2013) its tributary Sams River valley (Thackray, Reference Thackray2001), and the main Hoh River valley. In the Quinault River valley, Staley (Reference Staley2015) documented a single MIS 2 moraine, which impounds Lake Quinault, as well as associated outwash terraces.
Ice was restricted to positions within the SF Hoh and main Hoh valleys upvalley of the confluence (Fig. 2) during the LGM period, documenting that MIS 2 ice in the Olympic Mountains was considerably less extensive than during MIS 3 and pre–MIS 3 late Pleistocene advances (Thackray Reference Thackray2001; Marshall, Reference Marshall2013; Staley, Reference Staley2015). This study shows that the ice margin fluctuated rapidly during MIS 2, as indicated by the development of three ice-margin positions within 4 ka (SF 1–3) and facies and age evidence indicating rapid, small-scale ice fluctuations. Advances were accompanied by outwash aggradation as the ice advanced and stabilized following valley incision.
Another important finding of this work relates to the meltwater-rich character of the glacial system. The geomorphologic and sedimentologic data suggest that the SF Hoh glacier margin processes were dominated by meltwater during MIS 2. Most diamicton units are weakly stratified, suggesting deposition in water, and few basal tills are present. Outwash units are thick and longitudinally extensive, and large volumes of sediment were deposited in short time periods between advances. Evidence for water-related processes might be expected in this maritime and mild climatic setting, but this study makes clear that this system was dominated by meltwater even during the LGM, when original pollen data suggest cold and dry conditions (Heusser, Reference Heusser1972, Reference Heusser1974). However, reinterpretations of the older pollen sequences (Gavin and Brubaker, Reference Gavin and Brubaker2015) and interpretations of local LGM beetle assemblages from the lower SF Hoh and from the coast at Kalaloch (Ashworth, A., personal communication, 2019), indicate that the climate was at least as wet as today, consistent with our sedimentologic findings.
Relationship to regional glacial records and climate
The SF Hoh record provides coastal evidence of MIS 2 glaciation that augments the records from mountain glaciation across the western North America interior and other coastal ranges south of the Cordilleran Ice Sheet boundary. Most of these chronologies have been constrained using CRN dating, while indirect, glacially influenced chronologies have been developed in alluvial systems via luminescence techniques and U-Th pedogenic carbonate dating. Glacial and alluvial landform age estimates have also been derived from landforms cut by faults with well-constrained offset rates (e.g., Thackray and Staley, Reference Thackray and Staley2017).
In many inland ranges, the outermost dated Late Pleistocene moraines typically correlate with MIS 2, for example, the northern Yellowstone ice cap in Montana (Licciardi et al., Reference Licciardi, Clark, Brook, Pierce, Kurz, Elmore and Sharma2001), the Wallowa Mountains in Oregon (Licciardi et al., Reference Licciardi, Clark, Brook, Elmore and Sharma2004), the Teton Range in Wyoming (Licciardi and Pierce, Reference Licciardi and Pierce2008), and the Wasatch Mountains in Utah (Laabs et al., Reference Laabs, Marchetti, Munroe, Refsnider, Gosse, Lips, Becker, Mickelson and Singer2011). Many of these sequences contain two to three MIS 2 moraines, ranging in age from approximately 25 to 15 ka (Young et al., Reference Young, Briner, Leonard, Licciardi and Lee2011), although isolated MIS 3 exposure ages are present locally (e.g., Thackray and Colandrea, Reference Thackray and Colandrea2017). Similarly, the maximum Late Pleistocene advance of the Cordilleran Ice Sheet was during MIS 2, approximately 17 ka or later (Porter and Swanson, Reference Porter and Swanson1998; Borden and Troost, Reference Borden and Troost2001).
In contrast with interior mountain glaciers, the MIS 2 glaciation of the western Olympics and Cascade Range was less extensive than earlier Late Pleistocene glacial advances. Glaciers in both the Olympic and eastern Cascade Mountains of Washington reached their greatest extents during MIS 5 or 4 (Porter and Swanson, Reference Porter and Swanson2008; Thackray, Reference Thackray2008). Additionally, in western drainages of the North Cascades, Riedel et al. (Reference Riedel, Clague and Ward2010) described radiocarbon-dated sediments of the Evans Creek stade, constraining two late-MIS 3 to MIS 2 ice advances between 30.3 and 19.5 cal ka BP, with intervening recession around 24.9 cal ka BP. This recession period in the North Cascades is correlative with the ice-recession episode in the SF Hoh, dated at site A to approximately 23 ka, between the pre–SF 1 ice advance and the readvance to the SF 1 position.
Despite differences, the Olympic Mountains MIS 2 record contains elements of MIS 2 glacial chronologies documented elsewhere in the western United States. The four SF Hoh terminal positions (pre–SF 1 and SF 1–3) may reflect the sequences of two to three moraines common to several regional mountain ranges (Young et al., Reference Young, Briner, Leonard, Licciardi and Lee2011), although the uncertainties in the CRN chronologies and the radiocarbon/OSL chronology here preclude firm temporal correlation. It is possible that the same millennial-scale climatic events affected glacial systems near the coast and in inland ranges, or, conversely, the contrasting climatic setting and mass balance characteristics of the diverse mountain glacial systems may have caused contrasting responses to short-lived climatic shifts.
Thackray (Reference Thackray2001, Reference Thackray2008) suggests that greater pre–MIS 2 Late Pleistocene ice volume in western Washington was supported by increased or maintained maritime-source precipitation, coupled with modestly cooler temperatures. General circulation models suggest that the Cordilleran and Laurentide Ice Sheets deflected atmospheric circulation southward during the LGM (Löfverström et al., Reference Löfverström, Caballero, Nilsson and Kleman2014). These models show no change in large-scale atmospheric circulation until the Laurentide Ice Sheet reached a threshold size during the LGM. Therefore, ice volume in the Olympic Mountains may have reached its maximum before the LGM because of a consistent atmospheric circulation system allowing for maintained high precipitation and efficient conversion of rain to snow with modestly cooler air temperatures.
Regional paleoecological data constrain climatic conditions that may have influenced the multiple MIS 2 glacial fluctuations we have documented in the SF Hoh valley. Local pollen assemblages indicate that MIS 3 was dominated by temperate rainforest that transitioned into alpine tundra vegetation at 27.3 cal ka BP, lasting until 19.3 cal ka BP (Florer, Reference Florer1972; Heusser, Reference Heusser1974). Alpine tundra vegetation is reflective of a generally colder and/or drier period. These inferred cooler/drier conditions during the LGM were punctuated by two periods of warmer temperatures, at approximately 25.8–22.8 and 21.8–21.1 cal ka BP (Heusser, Reference Heusser1974). While the available age control is not sufficient for definitive testing, the periods of inferred warming during the LGM are correlative with SF Hoh ice retreat from the pre–SF 1 (before 22.7 ka) and SF 1 (after approximately 22–18.8 ka) positions.
The combined evidence from pollen, beetle, and glacial records suggests that SF Hoh ice-marginal positions were influenced by closely spaced climatic fluctuations that affected glacial mass balance. In contrast to glacial records from the interior regions that indicate mountain glacial advance during MIS 2, the SF Hoh record indicates the LGM was characterized by rapid minor readvances and still stands during a period of overall ice retreat. These results further support the general argument for reduced moisture delivery to the Olympic Mountains during the LGM due to deflection of moisture from the Cordilleran and Laurentide Ice Sheets (Löfverström et al., Reference Löfverström, Caballero, Nilsson and Kleman2014). The importance of moisture supply on the glacial mass balance of the SF Hoh glacier is evidenced by beetle and pollen data that suggest only modest LGM cooling (2°C–5°C) and the abundance of evidence for meltwater-sorted facies (stratified diamicton and outwash) at the glacial margin. Episodic changes in vegetation (pollen) and glacial mass balance (ice-margin positions) suggests moisture supply and temperature variability during the LGM. Correlative advances in glacial sequences in the North Cascades may suggest a regional climatic forcing at this time.
CONCLUSIONS
This study combined sedimentologic and stratigraphic evidence with geomorphologic assessment to provide a detailed sequence of millennial-scale MIS 2 glacial dynamics in the western Olympic Mountains. Stratigraphic descriptions of 10 exposures along river cutbanks and LiDAR-based geomorphologic mapping constrain the retreat timing from an earlier ice position in the main Hoh valley (pre–SF 1 position) and reveal evidence for three ice-marginal positions in the SF Hoh River valley (SF 1–3).
Age control and stratigraphic sequences in the SF Hoh valley indicate that the pre–SF 1 ice-marginal position was occupied in the main Hoh valley following construction of the Hoh Oxbow 3 moraine identified by Thackray (Reference Thackray2001) and later dated to 40–30 ka by Marshall (Reference Marshall2013). Age control from lacustrine sediments found upstream of the confluence of the Hoh and SF Hoh valleys (sites A and D) indicates retreat from this position occurred before 23 ka. The SF 1 ice-margin position dates to 22.0–18.8 ka and is correlative with the Twin Creeks I position recorded by Thackray (Reference Thackray2001). The previously unmapped SF 2 position is dated to 18.7 ka, and the SF 3 position is constrained by a maximum age to <18.7 ka. Several distinct glacial outwash surfaces emanate from these ice-margin positions, and most diamictons are weakly stratified, indicating the presence of abundant meltwater at the glacial margin.
The glacial records from the Olympic and Cascade Mountains are significantly different from mountain glacial sequences from interior regions, where maximum Late Pleistocene glacial advances typically occurred during MIS 2. In contrast, the SF Hoh and other glaciers from western Washington reached their greatest Late Pleistocene extents during or before MIS 3, due to deflection of atmospheric circulation from the Cordilleran and Laurentide Ice Sheets during the LGM. Results indicate overall retreat of the SF Hoh valley glacier during MIS 2, punctuated by four stable ice positions that represent readvances or still stands. The older of these changes in glacial mass balance (pre–SF 1 and SF 1) may be correlative with ice advances documented in the North Cascades (Riedel et al., Reference Riedel, Clague and Ward2010). Furthermore, the timing of retreat from these two positions are correlative with changes in local pollen records (Florer, Reference Florer1972; Heusser, Reference Heusser1974). These observations suggest that MIS 2 changes in glacial ice volume likely reflect short-duration changes in temperature and/or precipitation in the region.
The application of a stratigraphic approach to reconstructing the history of ice-marginal positions and ice dynamics is a useful tool that can aid in unraveling the paleoclimatology and glacial response of regions where stratigraphic exposures are available to augment the geomorphologic record. This research adds to a growing understanding of transport and depositional processes of valley glaciers in maritime climates and contributes to a more complete view of the structure of the LGM and corresponding ice volumes and climatic conditions in the Olympic Mountains.
ACKNOWLEDGMENTS
This project was funded through National Science Foundation grants EAR 1024657 and EAR 1024850 to Idaho State University and Utah State University, respectively, the Utah State University Department of Geosciences, and the Idaho State University Department of Geosciences as part of the CEW's MSc research at Utah State University. The U.S. National Park Service granted sampling access in Olympic National Park. Katie Marshall and Kelsey Lanan assisted with fieldwork, and Michelle Summa Nelson at the Utah State University Luminescence Laboratory assisted with OSL analysis. We thank Jerry Freilich of Olympic National Park for permitting assistance. We further extend appreciation to the reviewers of this paper, John Clague and Jon Riedel, and to editors Derek Booth and Yeong Bae Seong, for strengthening its contents and message.